

Validation of CSN1S1 transcriptional expression, promoter methylation, and prognostic power in breast cancer using independent datasets
- PMID: 33381666
- PMCID: PMC7767798
- DOI: 10.1016/j.bbrep.2020.100867
Validation of CSN1S1 transcriptional expression, promoter methylation, and prognostic power in breast cancer using independent datasets
Abstract
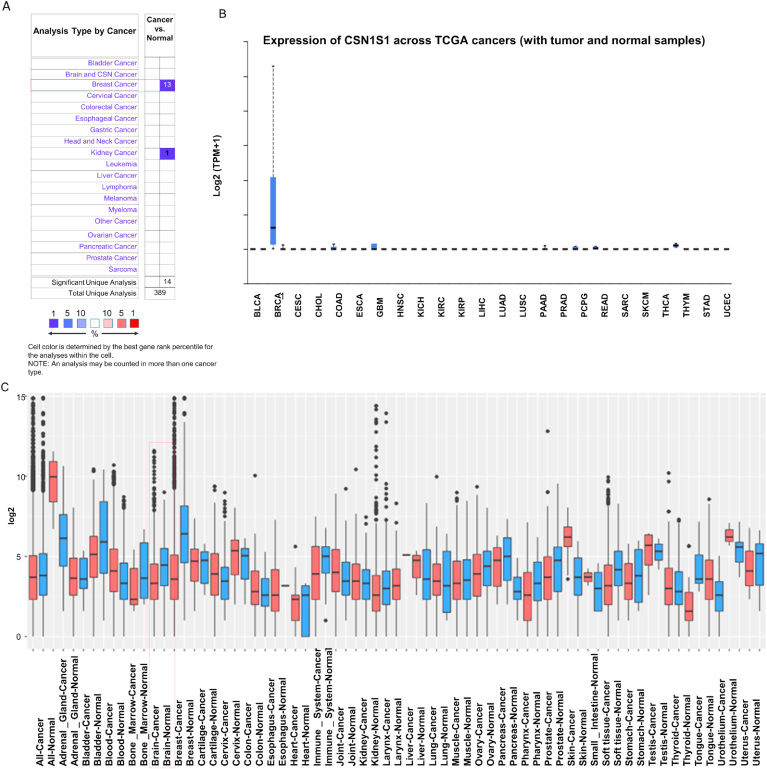
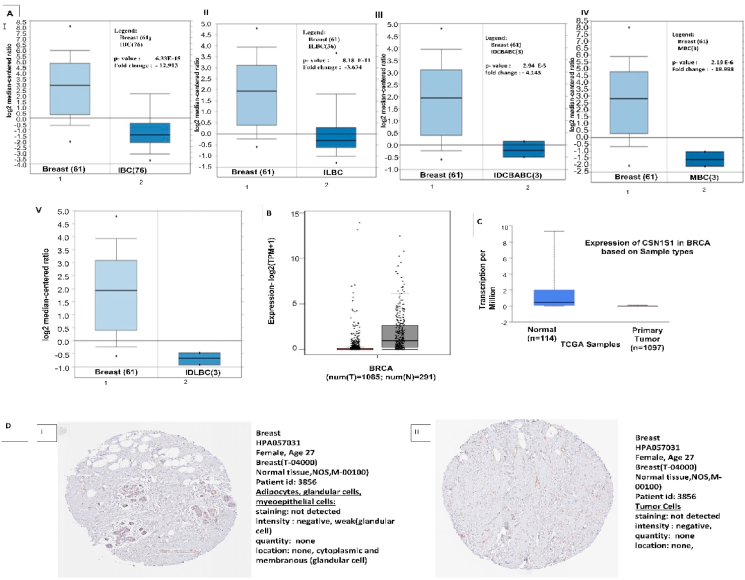
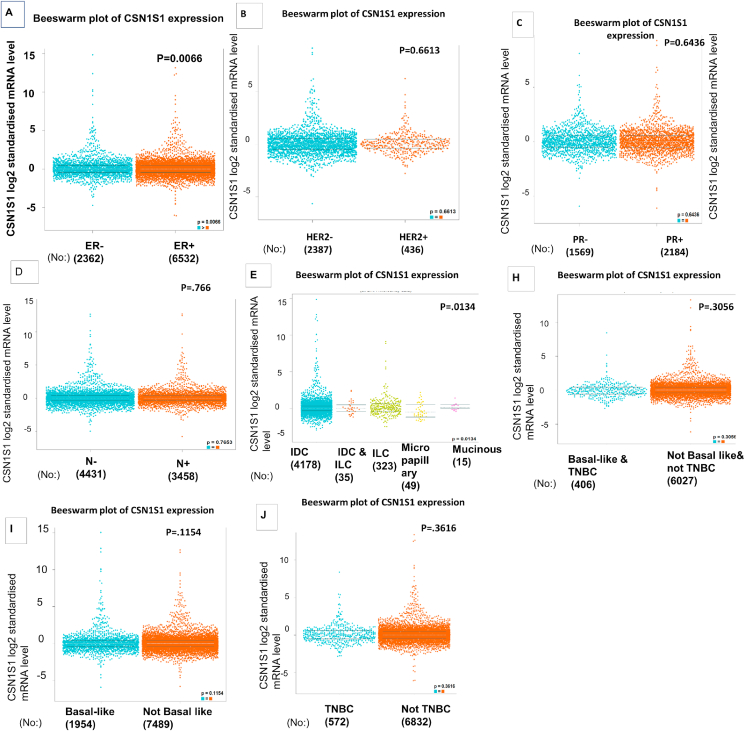
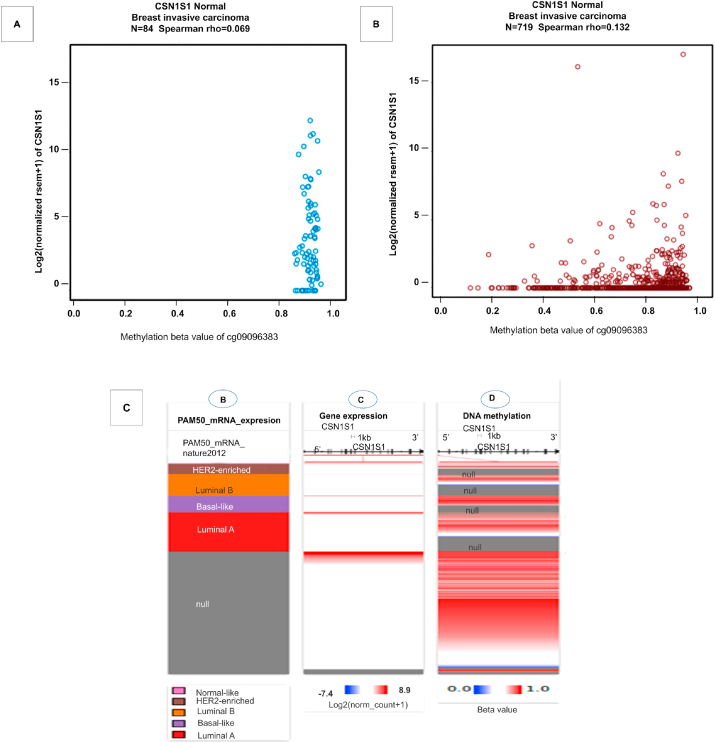
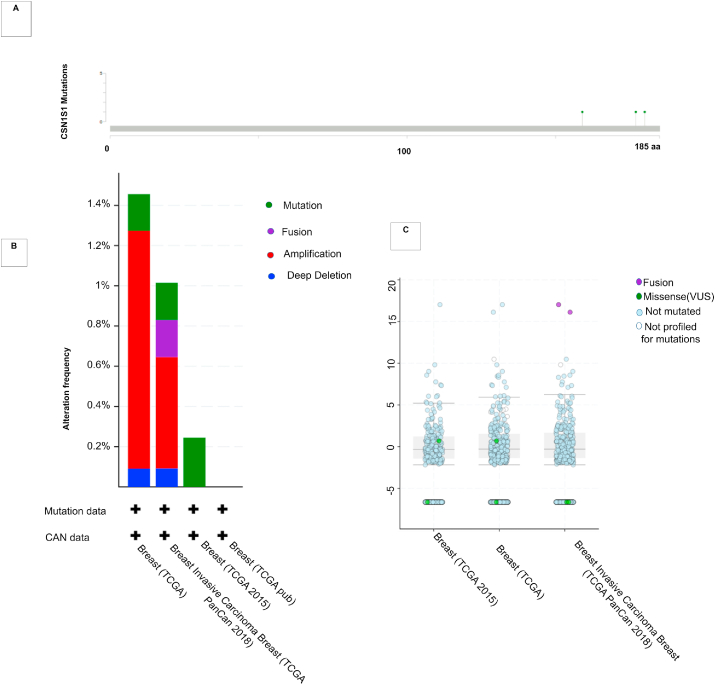
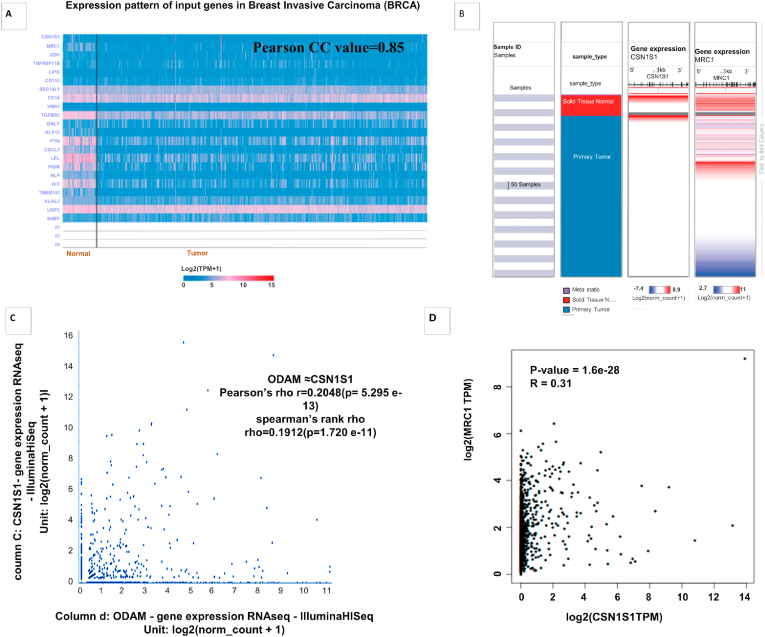
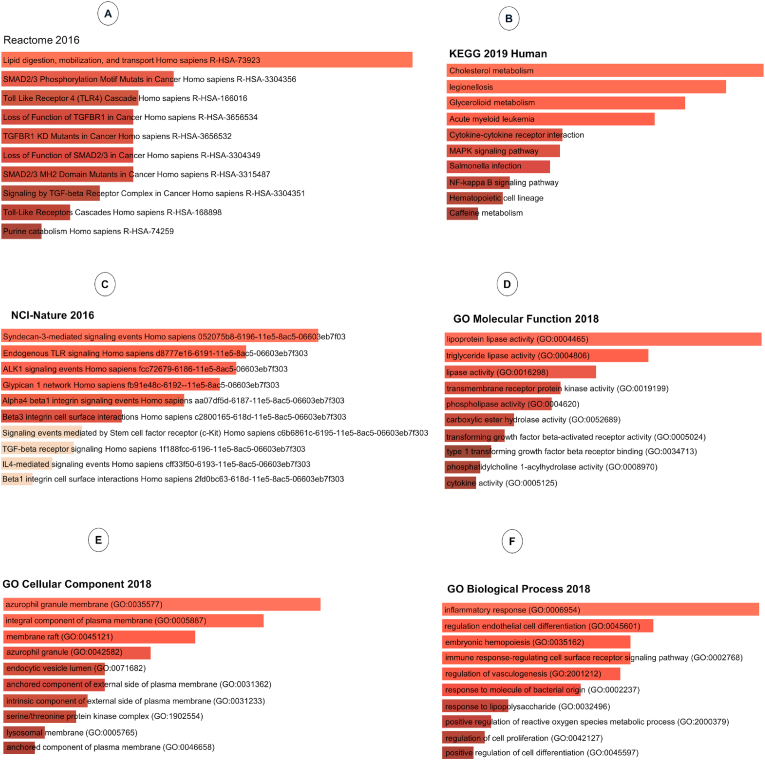
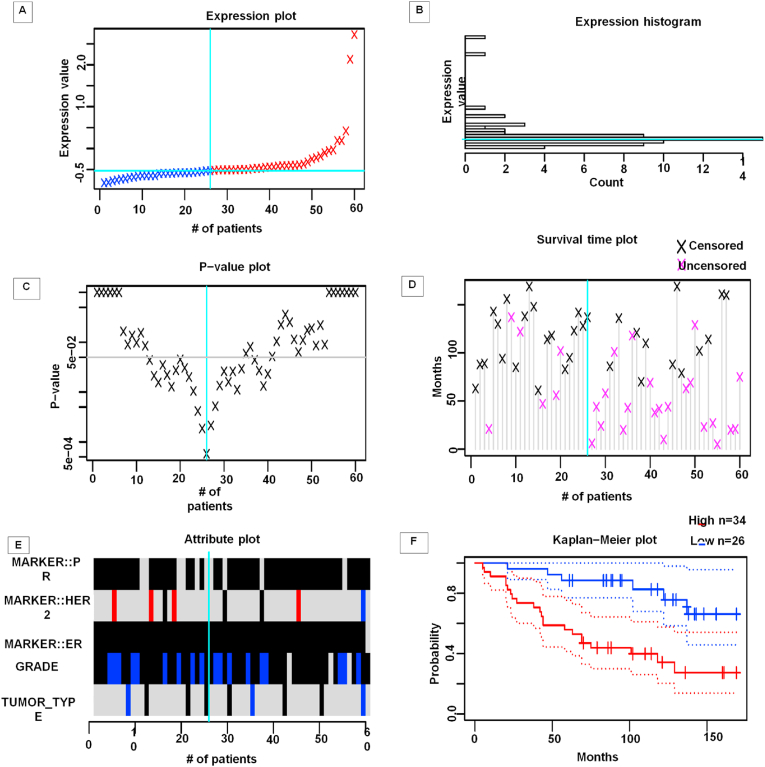
Breast cancer ranked second among most frequent cancer in the world playing a significant role in mortality rate. Having prior knowledge on differentially expressed genes in breast cell carcinoma elucidated important indications to understand the molecular mechanism underneath breast carcinogenesis. In this study we have investigated the distinguished CSN1S1 expression in human breast cancer. We have analyzed CSN1S1 mRNA expression between cancer and normal tissues using TCGA datasets. Moreover, analysis including promoter methylation, mutations, prognosis, co-expression, gene ontology, and pathways of CSN1S1 were performed by the TCGA Wanderer, UCSC Xena, cBioPortal, PrognoScan, UALCAN, and Enricher server. We have observed low mRNA expression and high promoter methylation of CSN1S1 in cancer tissues compared to normal tissues. Furthermore, we have also identified low mRNA expression in clinicopathological patients, as well as 9 deleterious mutations with highly co-expressed protein MRC1, and significantly related signaling pathways. We have found a positive correlation between the lower expression of CSN1S1 and patients surviving with breast cancer. Here we have concluded that CSN1S1 acts as a biomarker for the surveillance and prognosis of breast cancer, and also works as a novel therapeutic target at the molecular and pathway levels.
Keywords: Biomarker; Breast cancer; CSN1S1; Mutational analysis; Transcriptional expression.
© 2020 The Authors.
Conflict of interest statement
Authors declare no conflict of interest.
Figures
Similar articles
-
Systematic analysis of the expression and prognosis relevance of FBXO family reveals the significance of FBXO1 in human breast cancer.Cancer Cell Int. 2021 Feb 23;21(1):130. doi: 10.1186/s12935-021-01833-y. Cancer Cell Int. 2021. PMID: 33622332 Free PMC article.
-
Large-scale analysis of DFNA5 methylation reveals its potential as biomarker for breast cancer.Clin Epigenetics. 2018 Apr 11;10:51. doi: 10.1186/s13148-018-0479-y. eCollection 2018. Clin Epigenetics. 2018. PMID: 29682089 Free PMC article.
-
Overexpression of MUC1 predicts poor prognosis in patients with breast cancer.Oncol Rep. 2019 Feb;41(2):801-810. doi: 10.3892/or.2018.6887. Epub 2018 Nov 27. Oncol Rep. 2019. PMID: 30483806 Free PMC article.
-
Identification of methylation sites and signature genes with prognostic value for luminal breast cancer.BMC Cancer. 2018 Apr 11;18(1):405. doi: 10.1186/s12885-018-4314-9. BMC Cancer. 2018. PMID: 29642861 Free PMC article.
-
Identification of Methylation Markers and Differentially Expressed Genes with Prognostic Value in Breast Cancer.J Comput Biol. 2019 Dec;26(12):1394-1408. doi: 10.1089/cmb.2019.0179. Epub 2019 Jul 10. J Comput Biol. 2019. PMID: 31290690
Cited by
-
In silico investigation of the role of vitamins in cancer therapy through inhibition of MCM7 oncoprotein.RSC Adv. 2022 Oct 31;12(48):31004-31015. doi: 10.1039/d2ra03703c. eCollection 2022 Oct 27. RSC Adv. 2022. PMID: 36349041 Free PMC article.
-
A Novel Seven Gene Signature-Based Prognostic Model to Predict Distant Metastasis of Lymph Node-Negative Triple-Negative Breast Cancer.Front Oncol. 2021 Sep 16;11:746763. doi: 10.3389/fonc.2021.746763. eCollection 2021. Front Oncol. 2021. PMID: 34604089 Free PMC article.
-
HSD3B1 (c.1100C) Genotype Is Associated with Distinct Tumoral and Clinical Outcomes in Breast and Endometrial Cancers.Int J Mol Sci. 2025 Jun 14;26(12):5720. doi: 10.3390/ijms26125720. Int J Mol Sci. 2025. PMID: 40565184 Free PMC article.
-
Increased expression of SYCP2 predicts poor prognosis in patients suffering from breast carcinoma.Front Genet. 2022 Sep 7;13:922401. doi: 10.3389/fgene.2022.922401. eCollection 2022. Front Genet. 2022. PMID: 36159998 Free PMC article.
-
Oncoinformatic screening of the gene clusters involved in the HER2-positive breast cancer formation along with the in silico pharmacodynamic profiling of selective long-chain omega-3 fatty acids as the metastatic antagonists.Mol Divers. 2023 Dec;27(6):2651-2672. doi: 10.1007/s11030-022-10573-8. Epub 2022 Nov 29. Mol Divers. 2023. PMID: 36445532
References
-
- Ferlay J., Colombet M., Soerjomataram I., Mathers C., Parkin D.M., Piñeros M., Znaor A., Bray F. Estimating the global cancer incidence and mortality in 2018: GLOBOCAN sources and methods. Int. J. Canc. Apr 15, 2019;144(8):1941–1953. - PubMed
-
- Bray F., Ferlay J., Soerjomataram I., Siegel R.L., Torre L.A., Jemal A. Global cancer statistics 2018: GLOBOCAN estimates of incidence and mortality worldwide for 36 cancers in 185 countries. CA Canc J Clin. Nov, 2018;68(6):394–424. - PubMed
-
- Zhang X., Rice M., Tworoger S.S., Rosner B.A., Eliassen A.H., Tamimi R.M., Joshi A.D., Lindstrom S., Qian J., Colditz G.A., Willett W.C., Kraft P., Hankinson S.E. Addition of a polygenic risk score, mammographic density, and endogenous hormones to existing breast cancer risk prediction models: a nested case-control study. PLoS Med. Sep, 2018;15(9):e1002644. - PMC - PubMed
-
- Duffy M.J., Walsh S., McDermott E.W., Crown J. Biomarkers in breast cancer: where are we and where are we going? Adv. Clin. Chem. 2015;71:1–23. - PubMed
LinkOut - more resources
Full Text Sources
Miscellaneous
