. 2020 Dec 31:9:e56551.
doi: 10.7554/eLife.56551.

Dysregulation of sonic hedgehog signaling causes hearing loss in ciliopathy mouse models

Affiliations

Dysregulation of sonic hedgehog signaling causes hearing loss in ciliopathy mouse models

Kyeong-Hye Moon et al. Elife. .

Abstract

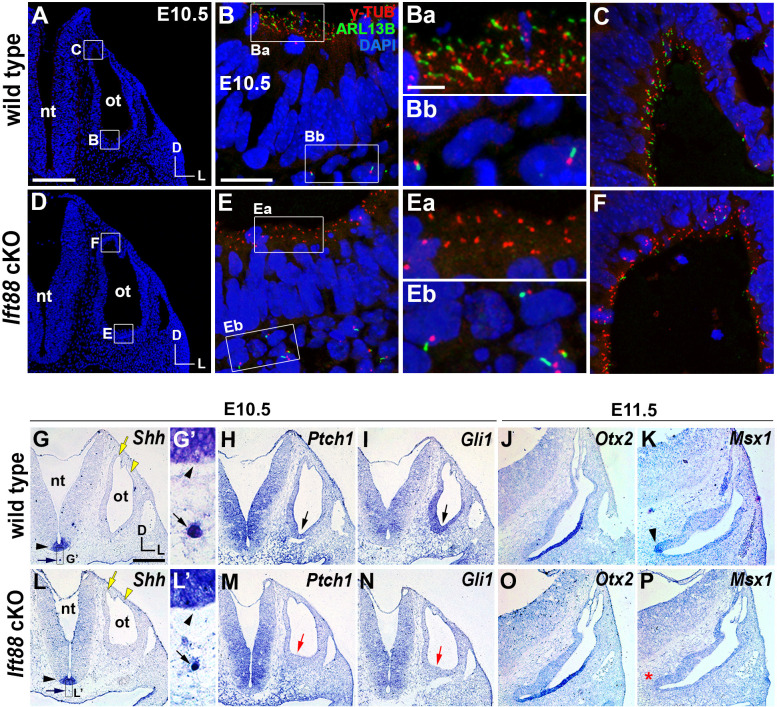
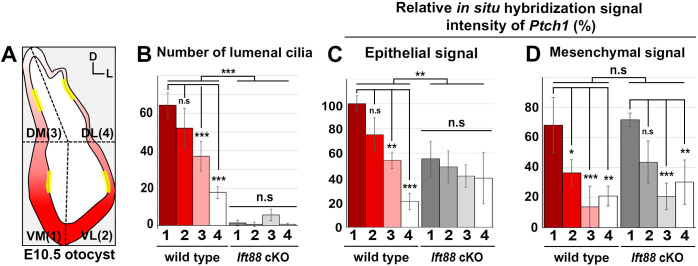
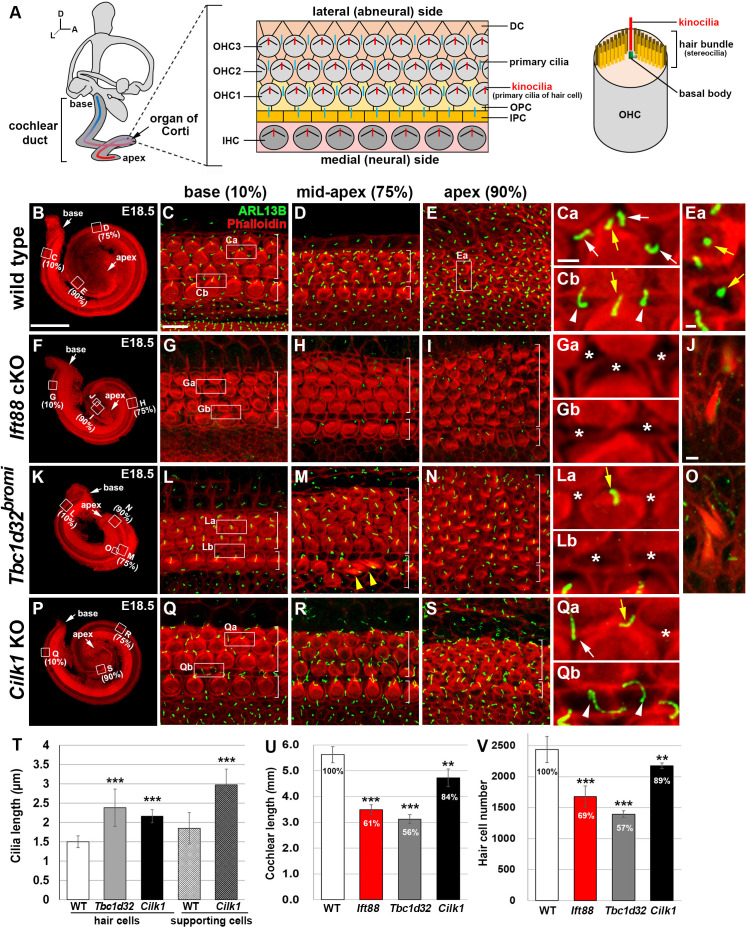
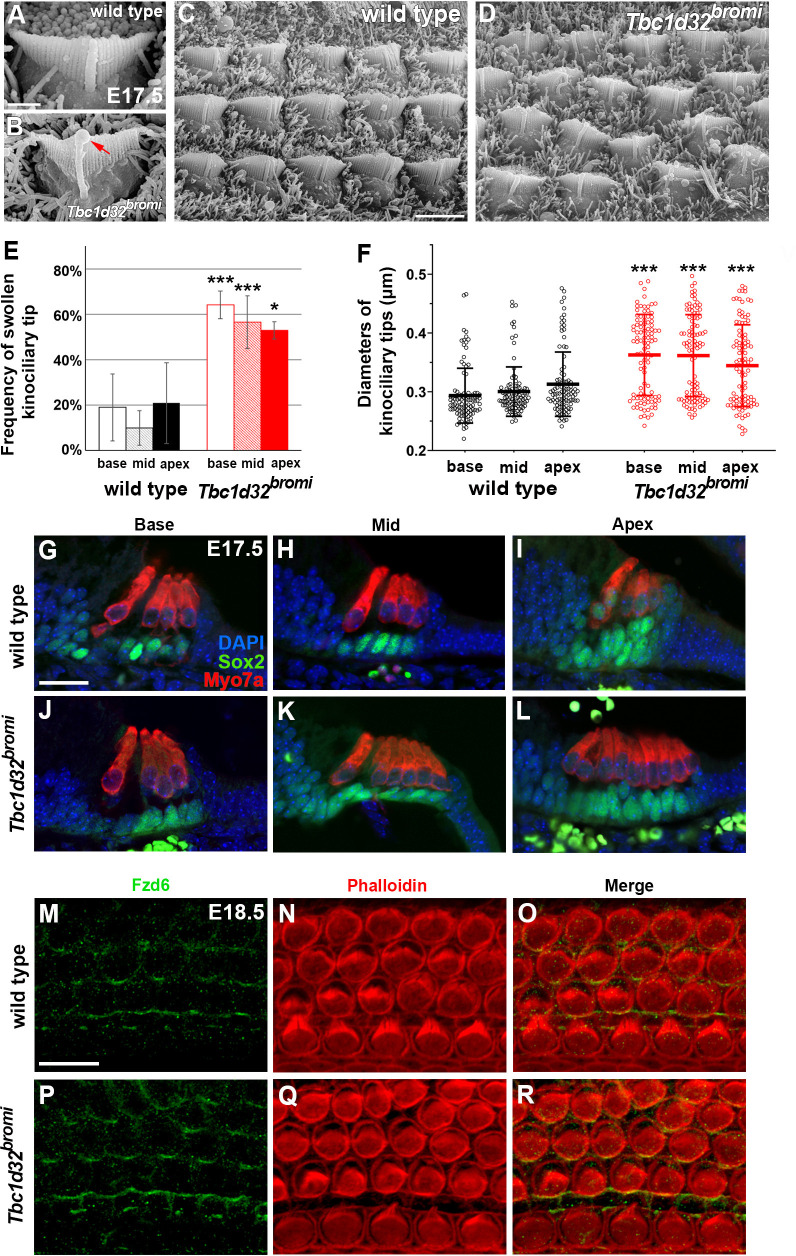
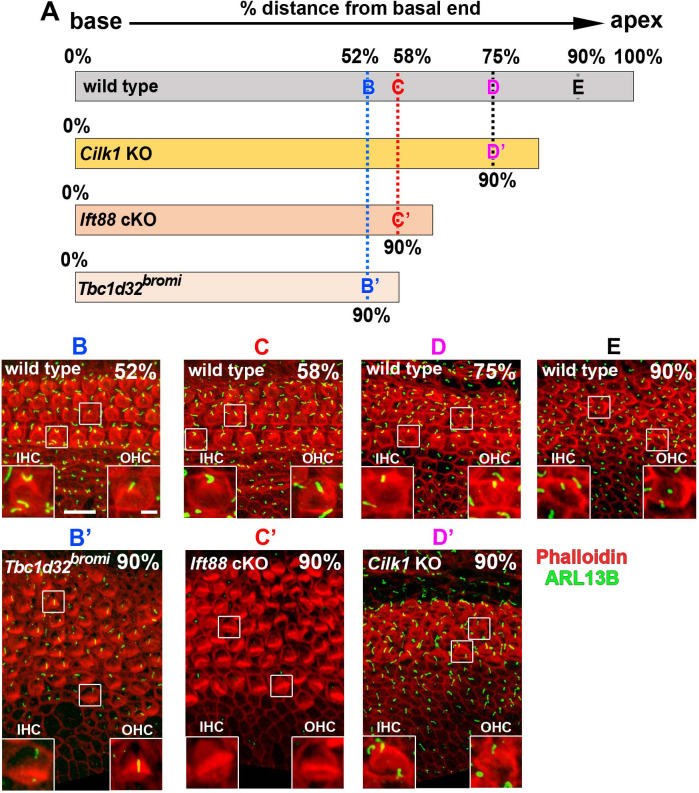
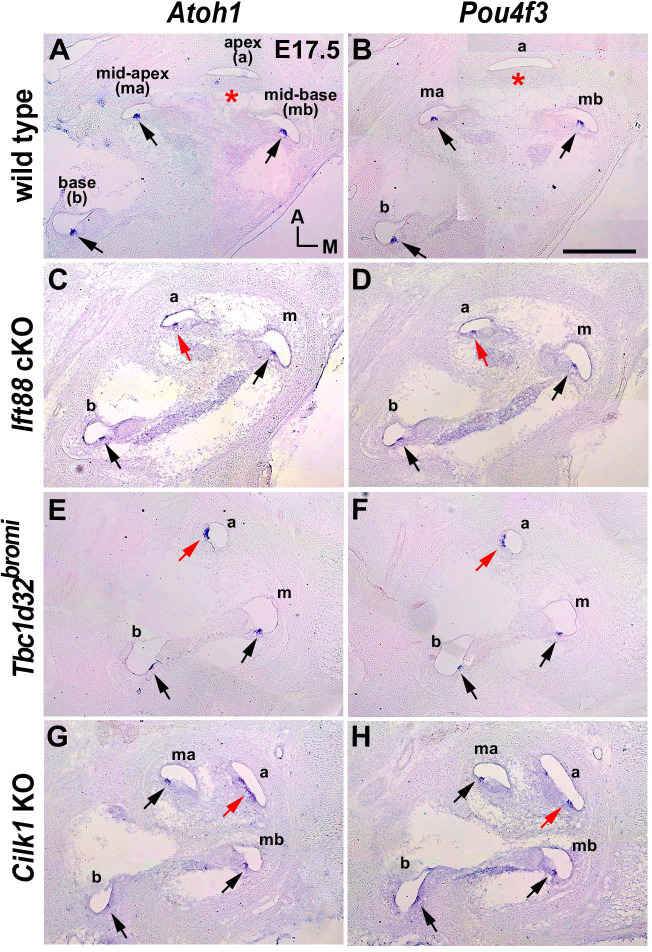
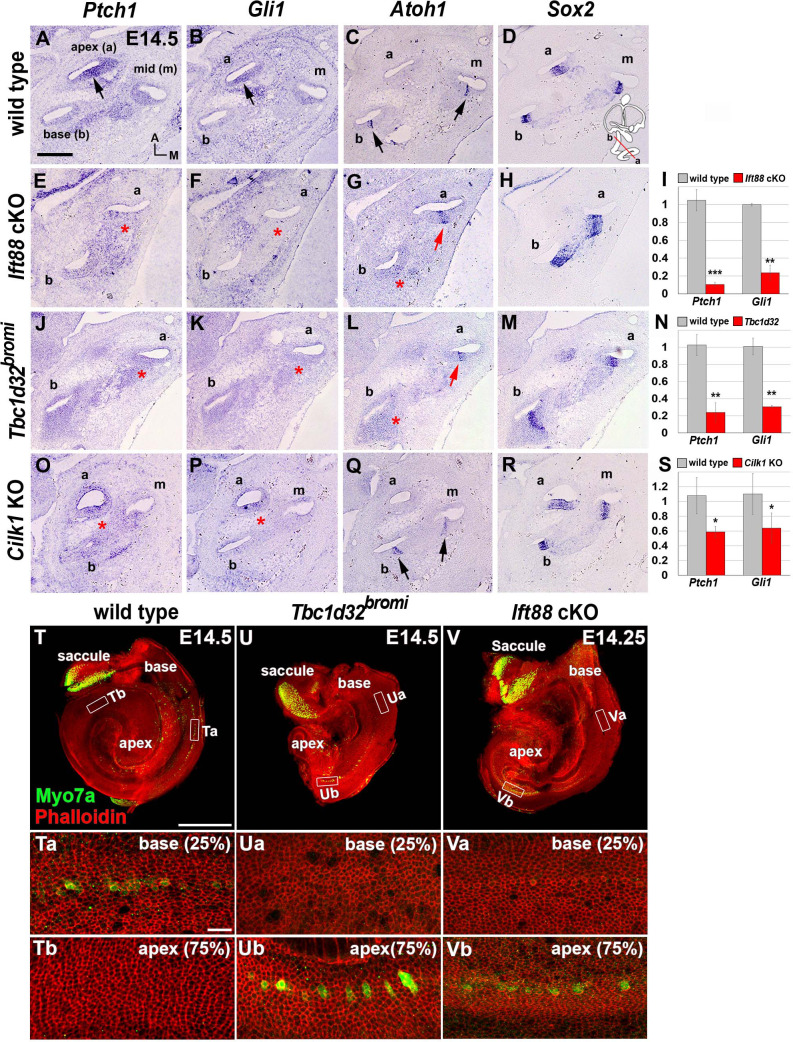
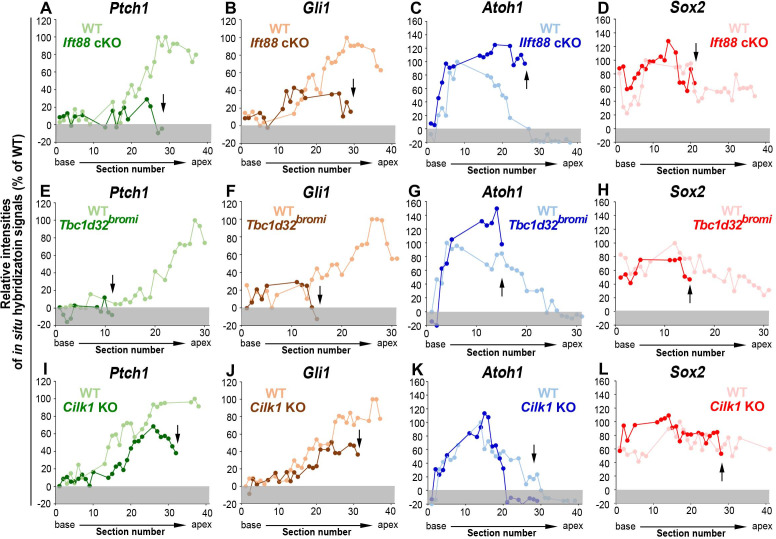
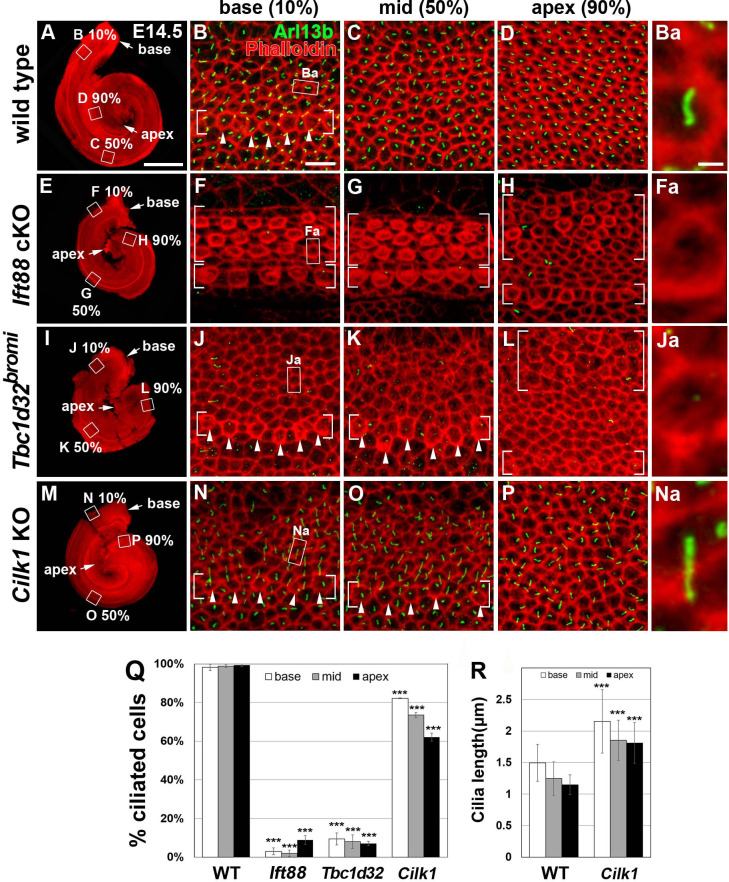
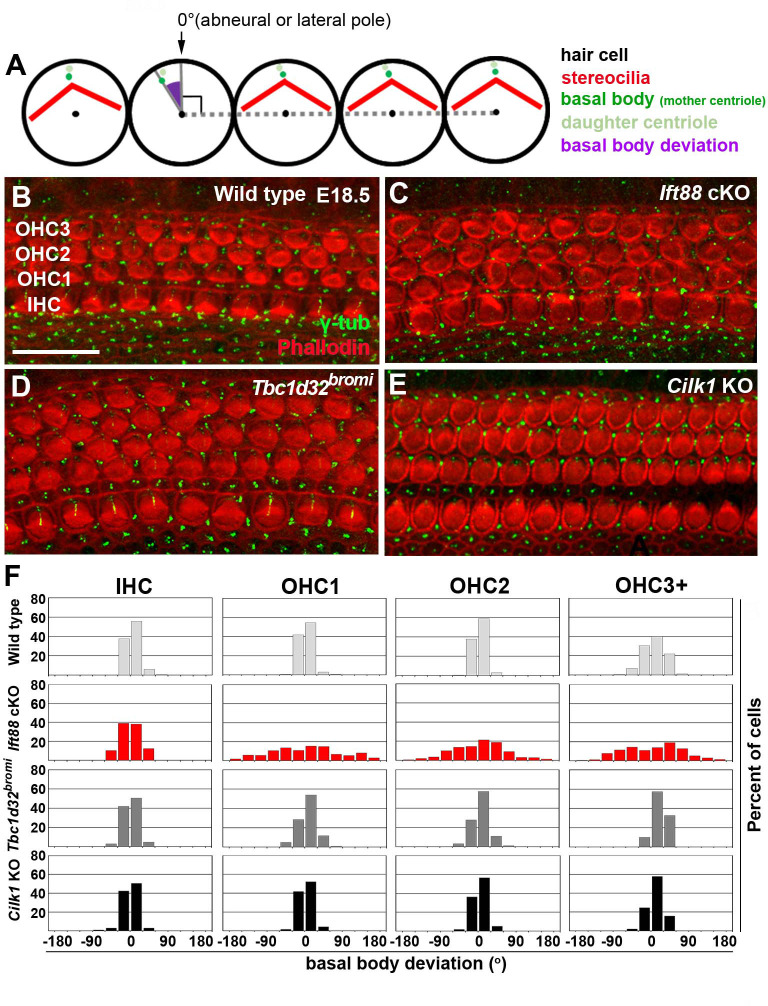
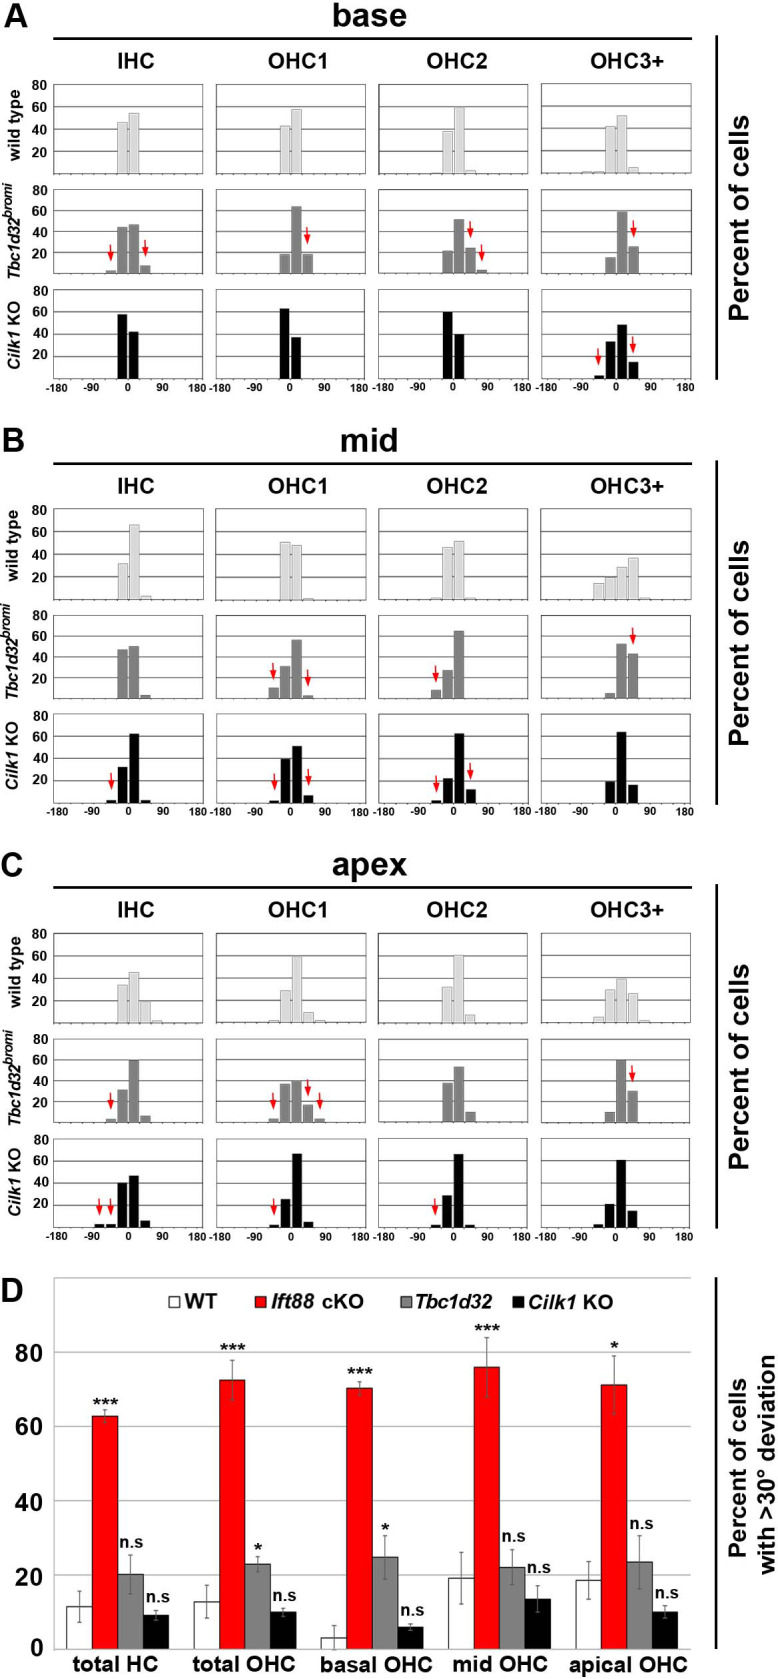
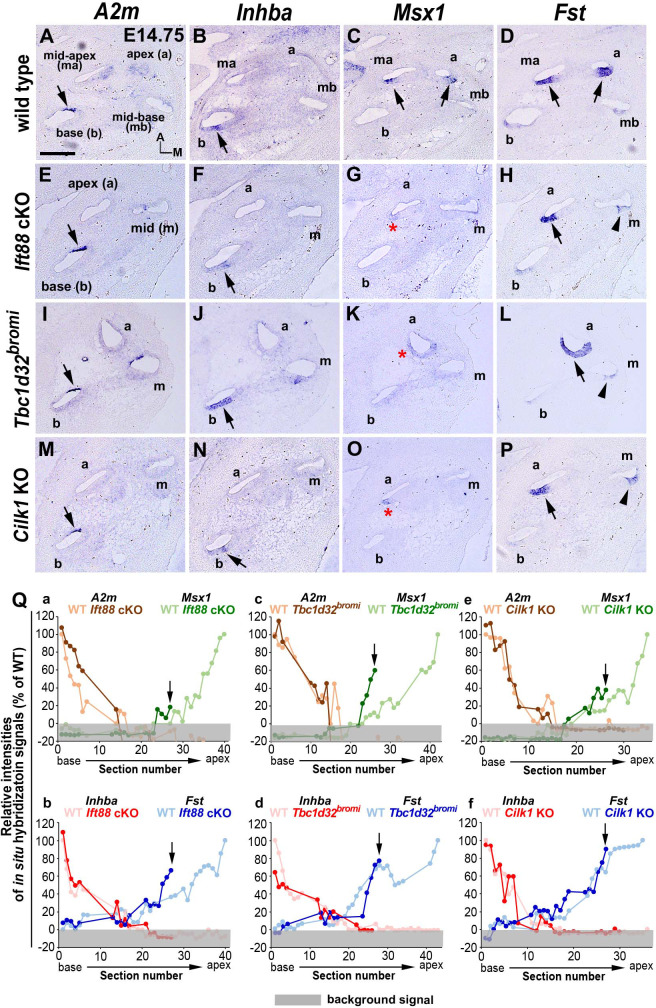
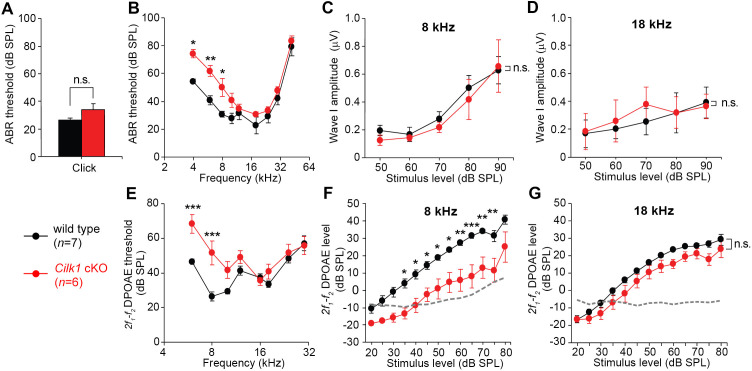
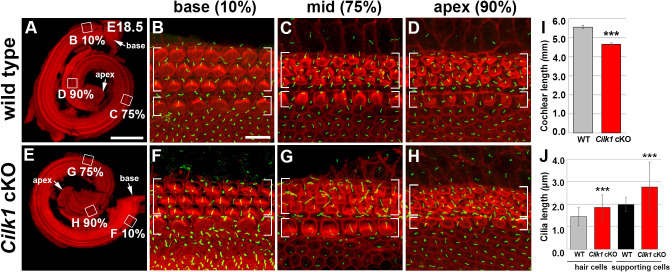
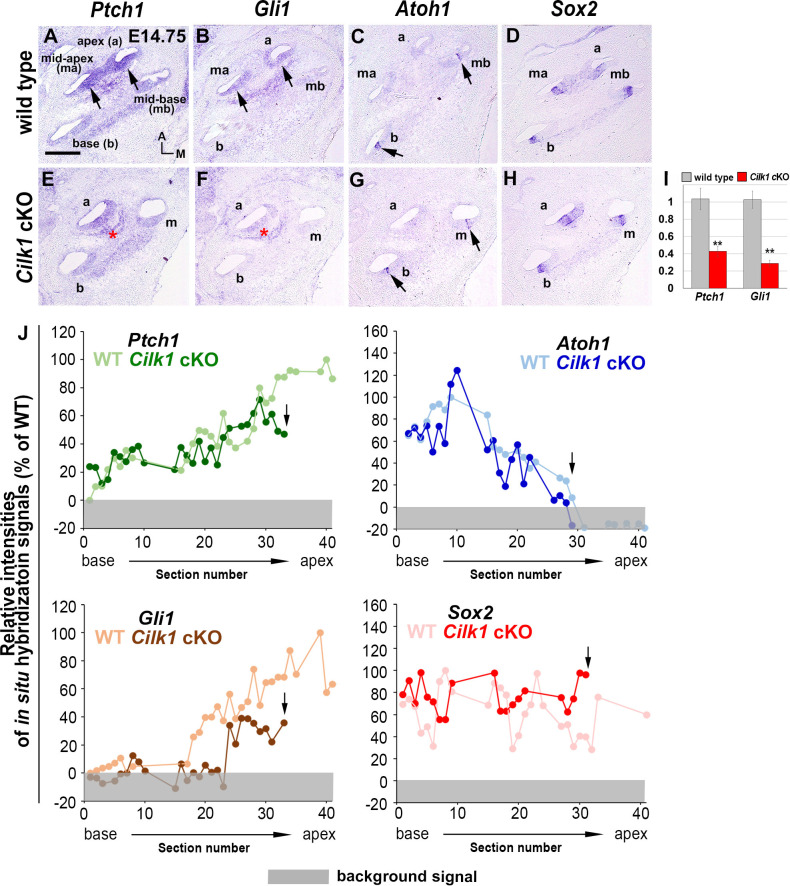
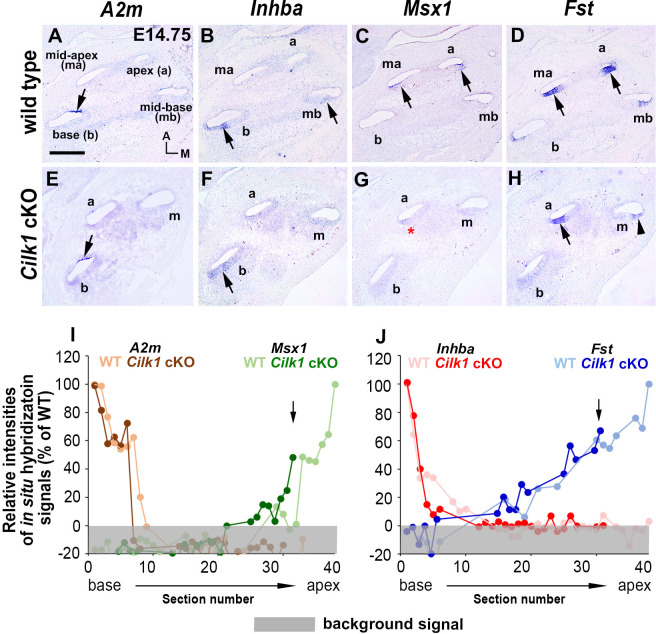
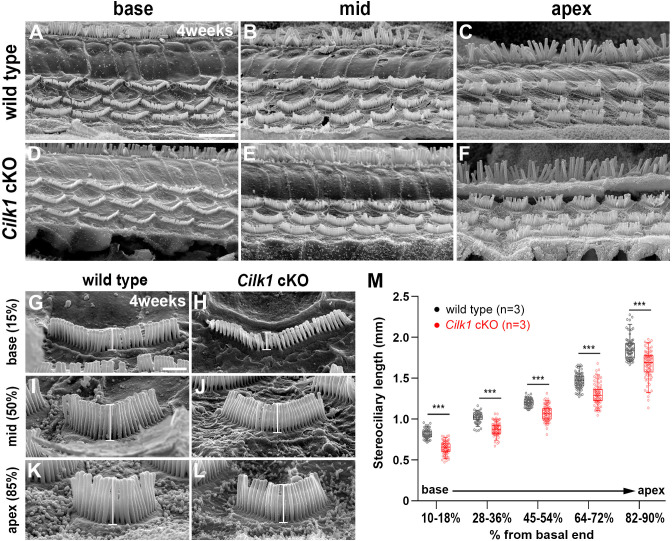
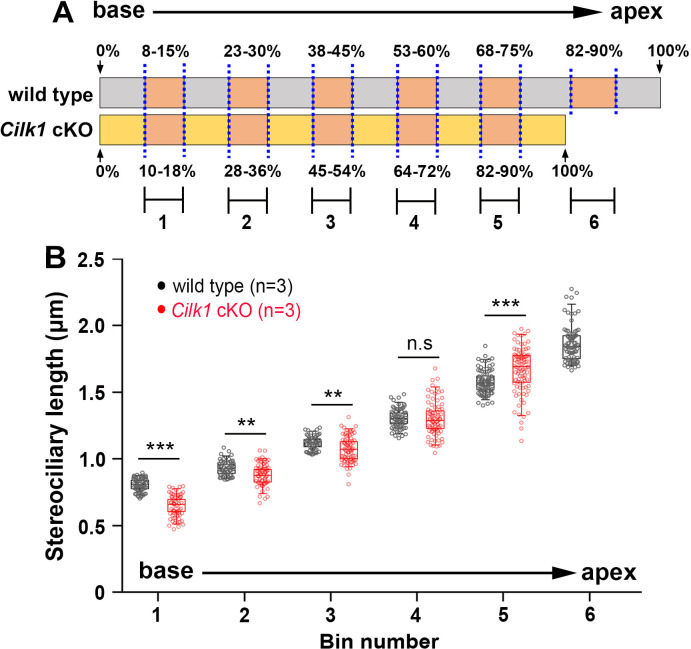
Defective primary cilia cause a range of diseases known as ciliopathies, including hearing loss. The etiology of hearing loss in ciliopathies, however, remains unclear. We analyzed cochleae from three ciliopathy mouse models exhibiting different ciliogenesis defects: Intraflagellar transport 88 (Ift88), Tbc1d32 (a.k.a. bromi), and Cilk1 (a.k.a. Ick) mutants. These mutants showed multiple developmental defects including shortened cochlear duct and abnormal apical patterning of the organ of Corti. Although ciliogenic defects in cochlear hair cells such as misalignment of the kinocilium are often associated with the planar cell polarity pathway, our results showed that inner ear defects in these mutants are primarily due to loss of sonic hedgehog signaling. Furthermore, an inner ear-specific deletion of Cilk1 elicits low-frequency hearing loss attributable to cellular changes in apical cochlear identity that is dedicated to low-frequency sound detection. This type of hearing loss may account for hearing deficits in some patients with ciliopathies.

Keywords: ciliopathies; developmental biology; hearing loss; mouse; primary cilia; sonic hedgehog.


Conflict of interest statement

KM, JM, HM, HK, HK, HK, JB No competing interests declared

Figures

Figure 1.
Figure 1.. Sonic hedgehog signaling is affected in Ift88 cKO otocysts.
(A–C) In E10.5 wild-type embryos, primary cilia visualized by ARL13B and γ-tubulin immunostaining were observed in the otic epithelium (B, Ba, C) and periotic mesenchyme (Bb). (D–F) In Ift88 cKO embryos, primary cilia were disappeared in the otic epithelium (E, Ea, F) but not in periotic mesenchyme (Eb). (G–I, L–N) Shh is expressed in the floor plate (G, G’, L, L’; black arrowheads) and notochord (G, G’, L, L’; black arrows) in both E10.5 wild-type and Ift88 cKO embryos. Yellow arrows and arrowheads indicate the endolymphatic duct and vertical pouch, respectively. The sonic hedgehog (SHH) target genes, Ptch1 and Gli1, are expressed in a graded pattern, stronger in the ventral and medial regions and weaker in the dorsolateral region of the otocyst in wild-type embryos (H, I), but dramatically decreased in Ift88 cKO embryos (M, N; red arrows). (J, K) In E11.5 wild-type otocysts, Otx2 is expressed in the lateral side of the developing cochlea and Msx1 is expressed in the apical tip of the cochlea (K; arrowhead). (O, P) In Ift88 cKO otocysts, while Otx2 expression appears normal, Msx1 expression is completely downregulated (P; red asterisk). nt, neural tube; ot, otocyst. In all images, dorsal is up and lateral is right. Scale bar in A, 200 μm, also applies to D; scale bar in B, 20 μm, also applies to C, E, F; scale bar in Ba, 3 μm, also applies to Bb, Ea, Eb; scale bar in G, 200 μm, also applies to H–P.
Figure 1—figure supplement 1.
Figure 1—figure supplement 1.. Quantification of cilia number and sonic hedgehog (SHH) target gene expression in the inner ear.
(A) The otocyst is divided into four regions: ventromedial (VM), ventrolateral (VL), dorsomedial (DM), and dorsolateral (DL), which are numbered 1, 2, 3, and 4, respectively. The number of lumenal cilia was counted in the areas indicated by yellow lines (80 µm in length). (B) Quantification of the number of cilia in control and Ift88 cKO otocysts. The number of cilia is higher in the ventral otic regions than the dorsal regions in controls, while nearly no cilia are observed in Ift88 cKO otocysts (n = 3 for wild type, n = 3 for Ift88 cKO). (C,D) Quantification of the signal intensity for in situ hybridization of Ptch1. The strongest intensity among all measurements was set as 100%, and the relative signal intensity of otic epithelium and periotic mesenchyme in each region of wild-type and Ift88 cKO otocysts are plotted (n = 3 for wild types, n = 3 for Ift88 cKO). Values and error bars represent the mean ± standard deviation. Statistical comparisons were made using two-way ANOVA with Bonferroni correction for multiple comparisons (*p<0.05 **p<0.01, ***p<0.001).
Figure 2.
Figure 2.. Cochlear phenotypes of three ciliary mutants at E18.5.
(A) Schematic diagram of E18.5 organ of Corti. OHC, outer hair cell; IHC, inner hair cell; DC, Deiter’s cell; OPC, outer pillar cell; IPC, inner pillar cell. (B–E) In E18.5 wild-type cochlea, stereociliary bundles and primary cilia were visualized by staining with phalloidin (red fluorescence) and immunostaining with anti-ARL13B antibody (green fluorescence), respectively. Images of organ of Corti from 10% (base), 75% (mid-apex), and 90% (apex) cochlear positions from the basal end show a progression of HC differentiation from base to apex based on overall organization and stereociliary bundles in the hair cells (HCs). White brackets indicate one row of IHCs and three or more rows of OHCs. Magnified images show kinocilia of OHCs (Ca, Cb, Ea; yellow arrows) and primary cilia of Deiters’ cells (Ca; white arrows) and pillar cells (Cb; white arrowheads). (F–J) In Ift88 cKO mutants, cochlea shows a severe shortening (F), premature HC differentiation (G–I), and multiple extra rows of OHCs in the apex (H, I). Both kinocilia and primary cilia are absent from most HCs and supporting cells (SCs) (Ga, Gb; asterisks). Ectopic vestibule-like HCs are present in the Kölliker’s organ (J). (K–O) In Tbc1d32bromi mutants, cochlea shows a severe shortening (K), premature HC differentiation (L–N), and multiple rows of OHCs in the apex (M, N). Kinocilia of HCs are present (La; yellow arrow) but primary cilia in the SCs are missing (La, Lb; asterisks). Ectopic vestibule-like HCs are present adjacent to inner HCs (M; yellow arrowheads) and in the Kölliker’s organ (O). (P–S) In Cilk1 KO mutants, cochlea shows a slight shortening (P), slightly premature HC differentiation (Q–S), and increased OHCs in the apex (S). Both kinocilia and primary cilia are abnormally elongated (Qa, Qb) and primary cilia are often absent from SCs (Qa; asterisk). Scale bar in B, 500 μm, also applies to F, K, P; scale bar in C, 10 μm, also applies to D, E, G–I, L–N, Q–S; scale bar in Ca, 2 μm, also applies to Cb, Ea, Ga, Gb, La, Lb, Qa, Qb; scale bar in J, 2 μm, also applies to O. (T–V) Quantification of ciliary lengths (T; measured from at least 100 cells from three or more embryos for each genotype), cochlear lengths (U; n = 5–7 embryos for each genotype), and HC numbers (V; n = 3–5 embryos for each genotype). Values and error bars represent the mean ± standard deviation. Statistical comparisons were made using the two-tailed Student’s t-test (**p<0.01, ***p<0.001).
Figure 2—figure supplement 1.
Figure 2—figure supplement 1.. SEM and immunofluorescent images of hair cells (HCs) of Tbc1d32bromi mutants.
(A–D) Scanning electron micrographs of OHCs of wild-type and Tbc1d32bromi mutants at E17.5. Tbc1d32bromi mutants exhibit abnormally elongated kinocilia with swollen tips more frequently compared to wild types (B; red arrow). (E, F) The frequency of swollen kinociliary tips and their diameters are quantified from at least 100 HCs in each region of wild-type (n = 3) and Tbc1d32bromi mutants (n = 3). Values and error bars represent the mean ± standard deviation. Statistical comparisons were made using the two-way ANOVA with Bonferroni correction for multiple comparisons (**p<0.01, ***p<0.001). (G–L) Section immunofluorescent images of the organ of Corti of E17.5 wild-type and Tbc1d32bromi cochleae. HCs are stained with anti-MYO7A antibody (red) and supporting cells (SCs) are stained with anti-SOX2 antibody (green). Extra rows of HCs and SCs are displayed in the middle and apical cochlear section of Tbc1d32bromi mutants. (M–R) Whole mount immunofluorescent images of the organ of Corti of E18.5 wild-type and Tbc1d32bromi cochleae, stained with phalloidin and anti-FZD6 antibody. Scale bar in A, 1 μm, also applies to B; scale bar in C, 4 μm, also applies to D; scale bar in G, 20 μm, also applies to H–L; scale bar in M, 10 μm, also applies to N–R.
Figure 2—figure supplement 2.
Figure 2—figure supplement 2.. Comparison of hair cells (HCs) located at the same distance from the basal end of wild-type and ciliary mutant cochlea.
(A) Schematic diagram showing the relative cochlear lengths of wild-type and ciliary mutant cochlea. The basal cochlear end is set to 0%, and the apical end is set to 100%. The absolute distance of the 90% position of Tbc1d32bromi, Ift88, or Cilk1 mutant cochlea corresponds to 52%, 58%, or 75% of wild-type cochlea. (B–E) Stereocilia and primary cilia were visualized by staining with phalloidin (red fluorescence) and immunostaining with anti-ARL13B antibody (green fluorescence). HCs located at 90% position of Tbc1d32bromi (B, B’), Ift88 (C, C’), or Cilk1 (D, D’) mutant cochlea were compared with wild-type HCs located at the same distance from the base. Scale bar in B, 10 μm, also applies to all panels; scale bar in the inset in B, 2 μm, also applies to all insets.
Figure 2—figure supplement 3.
Figure 2—figure supplement 3.. Premature hair cell differentiation in ciliary mutant cochlea.
(A, B) Atoh1 and Pou4f3 are expressed in the base, mid-base, and mid-apex (black arrows), but not in the apex (asterisks), of wild-type cochlea at E17.5. (C–H) Atoh1 and Pou4f3 are expressed in the entire cochlear duct including the apex (red arrows) in E17.5 ciliary mutants. Scale bar in B, 200 μm, also applies to A–G.
Figure 3.
Figure 3.. Impaired sonic hedgehog (SHH) signaling and reversed wave of HC differentiation in ciliary mutant cochleae.
(A–D) In E14.5 wild-type cochlea, SHH target genes Ptch1 and Gli1 are expressed in a graded pattern of stronger in the apex (A, B; arrows) and weaker toward the base. Atoh1 expression representing HC differentiation is observed in the base and middle cochlear turns but not in the apical turn (C; arrows), whereas Sox2 expression representing prosensory domain is observed in all cochlear turns (D). (E–H) In Ift88 cKO cochlea, Ptch1 and Gli1 are greatly downregulated (E, F; asterisks). Atoh1 is ectopically expressed in the apex (G; red arrow) but not in the base (G; red asterisk). (J–M) In Tbc1d32bromi mutant cochlea, Ptch1 and Gli1 are greatly downregulated (J, K; asterisks). Atoh1 is ectopically expressed in the apex (L; red arrow) but not in the base (L; red asterisk). (O–R) In Cilk1 KO cochlea, Ptch1 and Gli1 are downregulated (O, P; asterisks). Unlike Ift88 cKO and Tbc1d32bromi mutants, Atoh1 is expressed in the base and middle turns (Q; arrows). (I, N, S) Quantitative real-time PCR analyses to determine expression levels of Ptch1 and Gli1 in the cochleae of Ift88 cKO (n = 4), Tbc1d32bromi (n = 3), and Cilk1 KO (n = 4) mutants relative to wild-type controls (n = 3). Values and error bars represent the mean ± standard error. Statistical comparisons were made using two-tailed Student’s t-test (*p<0.05, **p<0.01). (T–V) E14.5 whole cochlear images stained with phalloidin and anti-MYO7A antibody. In wild-type controls, MYO7A immunofluorescence is detected in the basal cochlea region (T, Ta; 25% from basal end) but not in the apical region (Tb; 75% from basal end). In Tbc1d32bromi and Ift88 cKO mutants, MYO7A immunofluorescence is detected in the apical cochlear region (Ub, Vb; 75% from basal end) but not in the basal region (Ua, Va; 25% from basal end). Scale bar in A, 100 μm, also applies to B–R; scale bar in T, 500 μm, also applies to U and V; scale bar in Ta, 20 μm, also applies to Tb, Ua, Ub, Va, and Vb.
Figure 3—figure supplement 1.
Figure 3—figure supplement 1.. Relative signal intensity of in situ hybridization for Ptch1, Gli1, Atoh1, and Sox2 along the cochlea.
In situ hybridization signal intensity was measured from all cochlear sections of wild-type and ciliary mutant cochlea. For each gene, the strongest signal intensity among all wild-type cochlear sections was set to 100%, and the relative signal intensity (Y-axis) of each cochlear section of wild-type and ciliary mutant cochlea is plotted from the base to apex (X-axis). Arrows indicate the apical end of the shortened cochlear duct of each mutant. Gray boxes below 0% in each graph indicate background signals. Representative measurement graphs from one wild-type and one mutant cochlea for each gene are shown.
Figure 4.
Figure 4.. Frequency of ciliated cells in E14.75 ciliary mutant cochleae.
Immunofluorescent staining of primarily cilia with anti-ARL13B antibody (green) and cell boundaries with phalloidin (red) of 14.5 cochleae from wild-type (A–D), Ift88 cKO (E–H), Tbc1d32bromi (I–L), and Cilk1 KO (M–P) mice. Brackets indicate IHC and OHC rows, and arrowheads indicate cells with cortical actin condensation. Higher magnification images showing the lack of abnormally elongated cilia are displayed for each genotype (Ba, Fa, Ja, Na). Scale bar in A, 500 μm, also applies to E, I, and M; scale bar in B, 10 μm, also applies to CD, F–H, J–L, and N–P. (Q) Percentages of ciliated cells are quantified in basal, middle, and apical regions of the cochlea from each genotype. The presence or absence of primary cilia is determined from at least 150 cells per region (at least 450 cells per embryo) from three different embryos for each genotype embryos. (R) Quantification of ciliary lengths measured from at least 100 cells from wild-type (n = 3) and Cilk1 KO (n = 3) embryos. Values and error bars represent the mean ± standard deviation. Statistical comparisons were made using the two-way ANOVA with Bonferroni correction for multiple comparisons (**p<0.01, ***p<0.001).
Figure 5.
Figure 5.. Deviation of basal body positioning in the three ciliary mutants.
(A) Diagram showing how to measure the deviation of basal body position. When the basal body is positioned at the abneural side of HCs, the angle was defined as 0°. The basal position was determined by measuring angles deviated from the abneural side. (B–E) Whole mount cochlear images of WT and the three ciliary mutants stained with phalloidin to visualize F-actin (red) and anti-γ-tubulin antibody to visualize basal bodies (green). (F) Percentages of HCs showing the degrees of basal body deviation in each genotype. Angles are measured from at least 100 hair cells per embryo from at least three different embryos for each genotype. Scale bar in B, 20 μm, also applies to C–E.
Figure 5—figure supplement 1.
Figure 5—figure supplement 1.. Deviation of basal body positioning in Tbc1d32bromi and Cilk1 KO mutants.
Percentages of HCs showing the angles of basal body position in the base (A), middle (B), and apex (C) of wild-type, Tbc1d32bromi, and Cilk1 KO mutant cochleae. Angles are measured from at least 30 hair cells per region from at least three different embryos for each genotype. Red arrows indicate basal body positioning deviated more than wild types. (D) The percentage of HCs with >30° deviations is significantly higher in all regions in Ift88 cKO mutants, compared to wild-type cochlea. In contrast, Cilk1 and Tbc1d32bromi mutants show no significant difference in all cochlear regions, compared to wild types, except for the basal OHCs in Tbc1d32bromi mutants. Values and error bars represent the mean ± standard deviation. Statistical significance was determined using the unpaired Student’s t-test (n.s. nonsignificant, *p<0.05, ***p<0.001).
Figure 6.
Figure 6.. Specification of apical cochlear regional identity is compromised in ciliary mutants.
(A–P) Gene expression patterns of basal cochlear markers (A2m, Inhba) and apical cochlear markers (Msx1, Fst) in cochleae of E14.75 ciliary mutants. (A–D) In wild-type controls, A2m and Inhba are expressed in the basal cochlear turn (A, B; arrows), whereas Msx1 and Fst are expressed in the apical cochlear turns (C, D; arrows). (E–P) In Ift88 cKO, Tbc1d32bromi, and Cilk1 KO mutants, basal genes (A2m and Inhba) are generally unaffected and maintained in the basal cochlear turns (E, F, I, J, M, N; arrows). In contrast, Msx1 is greatly downregulated in apical turns (G, K, O; red asterisks), and Fst is reduced and more restricted in the apical turns (H, L, P; black arrows for strong expression and arrowheads for weak expression). (Q) Relative signal intensity of in situ hybridization for A2m, Inhba, Msx1, and Fst along the cochlear duct of wild-type and ciliary mutants. For each gene, the strongest signal intensity among all wild-type cochlear sections is set to 100%, and the relative signal intensity (Y-axis) of each cochlear section of wild-type and ciliary mutants is plotted from the base to apex (X-axis). Arrows indicate the apical end of the shortened cochlear duct of each mutant. Gray boxes below 0% in each graph indicate background signals. Representative measurement graphs from one wild-type and one mutant cochlea for each gene are shown. Scale bar in A, 100 μm, also applies to B–P.
Figure 7.
Figure 7.. Low frequency hearing loss in 4-week-old Cilk1 cKO mutants.
(A–D) Auditory brainstem response (ABR) thresholds of wild-type and Cilk1 cKO mice are not significantly different in response to click stimuli (A) but are significantly increased in low frequency pure tone stimuli at 4, 6, and 8 kHz but not in higher frequencies in Cilk1 cKO mice (B). Input/output function analyses of wave I amplitudes show no significant differences between wild-type and Cilk1 cKO mice at 8 and 18 kHz (C, D). (E–G) 2f1-f2 distortion product otoacoustic emission (DPOAE) thresholds are significantly increased in low frequencies at 6 and 8 kHz but not in higher frequencies in Cilk1 cKO mice (E). DPOAE input/output function analyses of 2f1-f2 DPOAE levels show a significant reduction at 8 kHz (F) but not at 18 kHz (G) in Cilk1 cKO mice. Values and error bars are mean ± standard error. Statistical comparisons were determined using the two-way ANOVA with Bonferroni correction for multiple comparisons (n.s., non-significant, *p<0.05, **p<0.01, ***p<0.001).
Figure 7—figure supplement 1.
Figure 7—figure supplement 1.. Cochlear phenotypes of Cilk1 cKO mutants at E18.5.
Stereocilia and primary cilia are visualized by staining with phalloidin (red fluorescence) and immunostaining with anti-ARL13B antibody (green fluorescence). In Cilk1 cKO mutants, cochlea exhibits slight shortening (E, I), and both kinocilia in HCs and primary cilia in supporting cells (SCs) are abnormally elongated (F–H, J). Values and error bars (I, J) represent the mean ± standard deviation. Statistical significance was determined using the unpaired Student’s t-test (***p<0.001).
Figure 7—figure supplement 2.
Figure 7—figure supplement 2.. Sonic hedgehog (SHH) signaling is impaired in Cilk1 cKO mutant cochlea.
SHH target genes Ptch1 and Gli1, expressed in a graded pattern in E14.5 wild-type cochlea (A, B), are downregulated in Cilk1 cKO cochlea (E, F). Atoh1 and Sox2 expression patterns are similar between wild-type and Cilk1 cKO mutant cochlea (C, D, G, H). (I) qPCR confirms a significant reduction in Ptch1 and Gli1 in Cilk1 cKO cochlea. Values and error bars (I) represent the mean ± standard error. Statistical significance was determined using the unpaired Student’s t-test (n = 6, **p<0.01, ***p<0.0001). (J) Relative signal intensities of in situ hybridization for Ptch1, Gli1, Atoh1, and Sox2 along the cochlea of wild-type and Cilk1 cKO mutants. Arrows indicate the apical end of Cilk1 cKO cochlea. Gray boxes below 0% in each graph indicate background signals. Representative measurement graphs from one wild-type and one mutant cochlea for each gene are shown. Scale bar in A, 100 μm, also applies to B–H.
Figure 7—figure supplement 3.
Figure 7—figure supplement 3.. Specification of apical cochlear identity is impaired in Cilk1 cKO mutants.
In Cilk1 cKO mutants, expressions of basal genes (A2m and Inhba) are generally unaffected and maintained in the basal cochlear turns (A, B, E, F; arrows). In contrast, Msx1 expression is severely downregulated in apical turns (C, G; red asterisk), and Fst expression is reduced and more restricted in the apical turn (D, H; black arrows for strong expression and arrowheads for weak expression). (I, J) Relative signal intensity of in situ hybridization for A2m, Inhba, Msx1, and Fst along the ducts of wild-type and Cilk1 cKO mutant cochlea. Scale bar in A, 100 μm, also applies to B–H.
Figure 8.
Figure 8.. Decreased stereocilia lengths in 4-week-old Cilk1 cKO mutants.
(A–L) Scanning electron micrographs of the organ of Corti of wild-type and Cilk1 cKO mutants. There is no obvious HC degeneration in the base, middle, and apex of the cochlea (A–F). Higher magnification images show that OHC stereociliary lengths are decreased in the basal, middle, and apical cochlea of Cilk1 cKO mutants (G–L; brackets). (M) Quantification of stereociliary lengths of OHCs demonstrate significant decreases along the cochlear duct position in Cilk1 cKO mutants. Stereociliary lengths were measured from at least 30 OHCs per each region from three animals per each genotype. Data are displayed as box plots. Individual dots represent individual data values, the boxes represent a range of 25–75%, the horizontal lines in the boxes represent the median, the whiskers represent the 5% and 95% values, and the points outside the whiskers represent outliers. Scale bar in A, 5 μm, also applies to B–F; scale bar in G, 1 μm, also applies to H–L. ***p<0.001, as determined by two-way ANOVA with Bonferroni correction for multiple comparisons.
Figure 8—figure supplement 1.
Figure 8—figure supplement 1.. Comparison of OHC stereociliary lengths at the same distance from the basal end of wild-type and Cilk1 cKO mutant cochlea.
(A) Schematic diagram showing the relative lengths of wild-type and Cilk1 cKO mutant cochlea. Numbers 1 through 6 represent locations at the same absolute distance from the basal end in wild-type and Cilk1 cKO mutant cochlea. Since the cochlear length of Cilk1 cKO mutant is shorter than that of wild-type controls, the apical region (82–90%) of Cilk1 cKO mutants corresponds to the mid-apical region (68–75%) of wild-type controls. (B) Quantification of stereociliary lengths of OHCs located at the same distance from the basal end. Stereociliary length was measured from a minimum of 30 OHCs per each region from three animals per each genotype. The data are presented as box plots. Individual dots represent individual data values, boxes represent the 25–75% range, horizontal lines in boxes represent median values, whiskers represent 5% and 95% values, and points outside the whiskers represent outliers. Statistical significance was determined by two-way ANOVA with Bonferroni correction for multiple comparisons (n.s. nonsignificant, **p<0.01, ***p<0.001).

Similar articles

Cited by

References

    1. Abdelhamed ZA, Natarajan S, Wheway G, Inglehearn CF, Toomes C, Johnson CA, Jagger DJ. The Meckel-Gruber syndrome protein TMEM67 controls basal body positioning and epithelial branching morphogenesis in mice via the non-canonical wnt pathway. Disease Models & Mechanisms. 2015;8:527–541. doi: 10.1242/dmm.019083. - DOI - PMC - PubMed
    1. Ankamreddy H, Min H, Kim JY, Yang X, Cho ES, Kim UK, Bok J. Region-specific endodermal signals direct neural crest cells to form the three middle ear ossicles. Development. 2019;146:dev167965. doi: 10.1242/dev.167965. - DOI - PubMed
    1. Bangs F, Anderson KV. Primary cilia and mammalian hedgehog signaling. Cold Spring Harbor Perspectives in Biology. 2017;9:a028175. doi: 10.1101/cshperspect.a028175. - DOI - PMC - PubMed
    1. Bok J, Bronner-Fraser M, Wu DK. Role of the hindbrain in dorsoventral but not anteroposterior axial specification of the inner ear. Development. 2005;132:2115–2124. doi: 10.1242/dev.01796. - DOI - PubMed
    1. Bok J, Dolson DK, Hill P, Rüther U, Epstein DJ, Wu DK. Opposing gradients of gli repressor and activators mediate shh signaling along the dorsoventral Axis of the inner ear. Development. 2007;134:1713–1722. doi: 10.1242/dev.000760. - DOI - PubMed

Publication types

MeSH terms

Substances