Review
. 2021 Apr;42(7-8):834-868.
doi: 10.1002/elps.202000313. Epub 2021 Jan 22.

Electroosmotic flow: From microfluidics to nanofluidics

Affiliations
Review

Electroosmotic flow: From microfluidics to nanofluidics

Amer Alizadeh et al. Electrophoresis. 2021 Apr.

Abstract

Electroosmotic flow (EOF), a consequence of an imposed electric field onto an electrolyte solution in the tangential direction of a charged surface, has emerged as an important phenomenon in electrokinetic transport at the micro/nanoscale. Because of their ability to efficiently pump liquids in miniaturized systems without incorporating any mechanical parts, electroosmotic methods for fluid pumping have been adopted in versatile applications-from biotechnology to environmental science. To understand the electrokinetic pumping mechanism, it is crucial to identify the role of an ionically polarized layer, the so-called electrical double layer (EDL), which forms in the vicinity of a charged solid-liquid interface, as well as the characteristic length scale of the conducting media. Therefore, in this tutorial review, we summarize the development of electrical double layer models from a historical point of view to elucidate the interplay and configuration of water molecules and ions in the vicinity of a solid-liquid interface. Moreover, we discuss the physicochemical phenomena owing to the interaction of electrical double layer when the characteristic length of the conducting media is decreased from the microscale to the nanoscale. Finally, we highlight the pioneering studies and the most recent works on electro osmotic flow devoted to both theoretical and experimental aspects.

Keywords: Electrical double layer / Electro osmosis / Microchannels / Nanochannels / Porous media.


Conflict of interest statement

The authors have declared no conflict of interest.

Figures

Figure 1
Figure 1
Reproduced schematic diagram [28] of the experiments done by Reuss from his article [28]. The experiments conducted in a U‐type glass tube filled with water and the lower part was filled with insoluble particles, such as sandstone, which created a porous barrier. Reuss observed that when an external voltage was applied to the water, it began to pass through the porous barrier from the anode (+) to the cathode (−) side.
Figure 2
Figure 2
Reproduced schematic diagram of Reuss’ second experiment [28, 30]. Reuss inserted two glass tubes into a block of moist clay (part A) and applied an external electric field to the water inside the glass tubes.
Figure 3
Figure 3
Schematic illustration of the Helmholtz EDL model. The surface is negatively charged and positive ions (counter‐ions) are attracted to a location called the Helmholtz plane. In this model, the net electric charge density of the ions is zero for the solution beyond the Helmholtz plane.
Figure 4
Figure 4
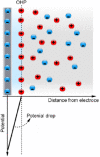
Gouy–Chapman illustration of the ionic distribution and electric potential distribution in the vicinity of a charged solid surface.
Figure 5
Figure 5
Reproduced sketch of the Stern EDL model [41] where the solid surface is assumed to be positively charged. In his model, the first layer, called Stern layer, has the thickness represented by δ, and the diffuse layer assumed to be beyond the Stern layer.
Figure 6
Figure 6
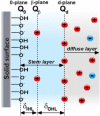
Configuration of the ETL model. In this model, it is assumed that the ions could be distributed in three layers that lie on two planes near the charged surface. The 0‐plane, β‐plane, and d‐plane are the inner‐Helmholtz plane, outer‐Helmholtz plane, and the starting edge of the diffuse layer, respectively [47].
Figure 7
Figure 7
Electrical quad‐layer model, in which a new layer was added between the zeta potential plane and the OHP, namely the BL. The figure has been reprinted from [17]. The positions of different planes are shown by X and the thickness of each layer is represented by δ.
Figure 8
Figure 8
Zeta potential versus bulk ion concentration for (A) NaCl and (B) KCl. (C) zeta potential and (D) surface charge versus the solution pH. The figures have been reprinted from [17].
Figure 9
Figure 9
Schematic of the velocity, electric field, and streaming current profiles in the vicinity of the surface at high concentrations under the basic Stern (BS) and viscoelectric double layer (VEDL) models, respectively. v, E, and ρ e denote the velocity, electric field in EDL, and space charge density, respectively. The figure has been reprinted from [18].
Figure 10
Figure 10
Schematic 2D illustration of EOF in a slit microchannel. The applied electric field (E) drives the counter‐ions in the EDL to the cathode.
Figure 11
Figure 11
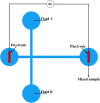
Schematic illustration of the T‐type micromixer with electrokinetically‐driven samples and buffers [79]. Arrows demonstrate the direction of EOF.
Figure 12
Figure 12
(A) Schematic illustration of the parallel EOF micromixer and (B) the fluorescence image of the mixing results. In this setup, a voltage 1 kV is employed to both buffer and sample reservoirs while the waste reservoir is grounded. (C) Schematic illustration of the serial EOF micromixer with the (D) fluorescence image of the mixing procedure of the buffer and sample. Reprinted with permission from [79]. Copyright (1999) American Chemical Society.
Figure 13
Figure 13
Schematic of mixing at the four‐way intersection of the serial mixing method [79].
Figure 14
Figure 14
Schematic depiction of the proposed micromixer by Oddy et al. [80]. The two reservoirs on the right‐ and left‐hand side of the microchip are subjected to an AC electric field while samples A and B are pumped into the vertical channel. Applying an AC electric field will disturb the two samples that are entering the straight channel and will enhance the mixing of the species.
Figure 15
Figure 15
Time‐lapsed frames of the mixing of the species. Starting from a stable interface of the species (t = 0.0 s) and its development after the onset of the instability (t = 13.3 s). Reprinted with permission from [80]. Copyright (2001) American Chemical Society.
Figure 16
Figure 16
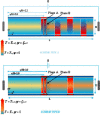
Schematic illustration of micromixers with temperature‐patterned walls. The red blocks on the microchannel walls represent high‐temperature patterns with nonzero surface charge. The other parts of the microchannel were both kept at inlet solution temperature and zero surface charge. The figure has been reprinted from [81].
Figure 17
Figure 17
Vortices created due to the temperature‐patterned walls in two arrangements. By increasing the solution temperature, the vortices influence a larger area of the microchannel, which forces mixing of the species. The figure has been reprinted from [81].
Figure 18
Figure 18
The nondimensionalized combined EOF/pressure‐driven velocity along the cross‐section of the microchannel for different applied pressure gradients. The amounts of dp¯/dy¯ curves’ labels. The figure has been reprinted from [85].
Figure 19
Figure 19
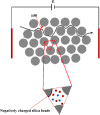
A schematic illustration of micron‐sized silica beads. The silica beads will acquire a negative surface charge due to the chemical reaction with the solution (c.f. Section 2.1). EOF is generated by applying an external electric field to both ends of the microporous media. The negatively charged silica beads will generate a polarized layer of the solution (EDL) and the external electric field will push the solution in the vicinity of the solid surface.
Figure 20
Figure 20
Pressure generated by employing an external electric field toward a micro‐size packed silica beads. The experimental measurements demonstrate the generated pressure gradient divided by the applied external electric field versus the bead diameter. The figure has been reprinted from [104].
Figure 21
Figure 21
Schematic illustrations of (A) periodic medium, (B) simple cubic array of spheres, (C) orthorhombic lattice, and (D) a bed of ellipsoids obtained via sequential deposition. All the structures have been reprinted from [113].
Figure 22
Figure 22
The schematic illustration of the porous medium which is a pack of ellipses in a microchannel. The height of the microchannel is 1 μm. The figure has been reprinted from [110].
Figure 23
Figure 23
Normalized EOF rate versus (A) semimajor axis and (B) the orientation angle. For (A), the orientation angle is considered to be θ= 0 and for (B) it is assumed that a= 61.5 nm and b= 40.6 nm. The EOF rate was normalized by the flow rate when θ= 0. The figures have been reprinted from [110].
Figure 24
Figure 24
EOF rate versus (A) particle size, (B) applied external electric field strength, (C) bulk ionic concentration, and (D) the particle zeta potential. The figures has been reprinted from [116].
Figure 25
Figure 25
Microporous medium, which is a pack of spherical particles with a structured distribution. The walls of the microchannel were charged as ζw = −50 mV while the zeta potential of the particles could be changed as a parameter to study the EOF rate. The external electric field (E) and the generated pressure gradient (ΔP) are shown in this schematic illustration. The figure has been reprinted from [116].
Figure 26
Figure 26
Generated microporous structure using the random generated‐growth method for a 60×60×60 grid system. (A) represents the porous medium structure with porosity 0.3 and (B) porosity 0.6. The structures have been reprinted from [117].
Figure 27
Figure 27
Electroosmotic permeability (κe) versus porosity (ε) of a porous medium for the reservoir concentration nb=104 M, ζ=50 mV, and E=104V/m. The figure has been reprinted from [117].
Figure 28
Figure 28
Electroosmotic permeability as a function of bulk ion concentration. The modeling results have been reprinted from [117].
Figure 29
Figure 29
Electric potential and EOF vectors for a randomly generated porous media with porosity ε=0.14. (A) Four slices of the porous media from inlet to the outlet at x=0, 1/3, 2/3, and 1. (B) The velocity vector field and the contour of EOF x direction velocity. The figures have been reprinted from [120].
Figure 30
Figure 30
EOF permeability versus porous medium porosity (ε) for solution with nb=1×10⁵ M and ζ=50 mV. The figure has been reprinted from [120].
Figure 31
Figure 31
Impact of (A) zeta potential when the bulk ion concentration is nb=1×10⁵ M and T=293 K and (B) solution pH on electroosmotic permeability when ε=0.14 and nb=1×10⁵ M. The figures have been reprinted from [120].
Figure 32
Figure 32
Three randomly generated roughness on the microchannel walls with (A) sd = 0.03 and VR = 0.06; (B) sd = 0.01 and VR = 0.06; (C) sd = 0.03 and VR = 0.01, where sd denotes the roughness distribution probability and VR denotes the total volume fraction of roughness. The xz cross‐section of the microchannel with roughness is shown as (D) to (F). Reprinted with permission from [122]. Copyright (2009) American Chemical Society.
Figure 33
Figure 33
Normalized EOF rate versus (A) roughness number density with VR = 0.05 and λ/H = 0.1683 and (B) total roughness volume fraction, where the squares are modeling results for nR = 360/μm2 and the circles are nR = 36/μm2. Reprinted with permission from [122]. Copyright (2009) American Chemical Society.
Figure 34
Figure 34
3D microporous medium that was generated by the random generation‐growth method. The black parts represent the solid and the blue parts are the voids filled by the solution. EOF will be in the x direction. This figure has been reprinted from [123].
Figure 35
Figure 35
EOFs based on the EDL overlapping regimes. The blue lines represent the distribution of the electric potential owing to the charged solid–liquid interface. The figure has been reprinted from [123].
Figure 36
Figure 36
EOF velocity through the porous media with porosity 0.46. To induce surface charge inhomogeneity, two pH gradients were employed in which the black symbol line demonstrates the pH from inlet to outlet identical to 6 and 8 and the red symbol‐line demonstrates the pH from inlet to outlet equal to 5 and 9. These results have been reprinted from [123].
Figure 37
Figure 37
Schematic illustration of the nanochannel, considered to be the space between two parallel flat plates that are equally charged. The external electric field is applied to the x direction. The height of the nanoslit is 2h.
Figure 38
Figure 38
Normalized analyte ion mobility as a function 2λ/h in nanochannel with the mobility in a microchannel. The normalized mobility is compared with the theoretical model. The large open symbols are the measured data and the closed symbols are the error bars. The overlapping of the EDL is for 2λh>1. The measurements were performed for two nanochannels with 40 and 100 nm height. Reprinted with permission from [126]. Copyright (2005) American Chemical Society.
Figure 39
Figure 39
Dimensionless velocity because of the electroosmosis for the negatively charged dye in (1) 60 nm and (2) 200 nm height nanochannels. Curves (3) and (4) represent the 60 and 200 nm nanochannels for the neutral dye, respectively. The figure has been reprinted from [140].
Figure 40
Figure 40
(A) Flow field in a negatively charged conical nanopore located between two large reservoirs carrying different salt concentrations when an axial electric field is imposed. (B) Schematics of EOF in (I) a cylindrical pore without a salt gradient, (II) a cylindrical pore with an axial salt concentration gradient, and (III) a conical pore with an axial salt concentration gradient. Reprinted with permission from [149]. Copyright (2018) American Chemical Society.
Figure 41
Figure 41
(A) Variation in ion concentrationn+, n (solid and dashed curves indicate n+ and n, respectively) along the monolayer molybdenum disulfide nanopore axis at different applied electric potential differenceΔϕ. (B) Variation in average flow velocity vave (negative and positive values indicate the solution directions toward the cathode and anode, respectively) as a function ofΔϕ. Contours of the flow velocity magnitude |ν| and streamlines in the monolayer molybdenum disulfide nanopore at the bulk concentration n0 = 1 M, and (C) Δϕ = 0.1 V, (D) Δϕ = 1 V. The gray shadow area in (A) indicates the nanopore region and “EDL EOF” and “TIC EOF” in (B) denote the “electric double layer electroosmotic flow” and “transport‐induced‐charge electroosmotic flow,” respectively. Reprinted with permission from [149]. Copyright (2018) American Chemical Society.
Figure 42
Figure 42
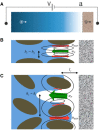
(A) Schematic illustration of the experimental setup in which the ionic current is driven from an anode in a reservoir to a perm‐selective membrane. (B) For the ordered porous media in the vicinity of the perm‐selective membrane, the strong EOF (red arrows) and back pressure‐driven (green arrows) electrolyte solution will initiate a salt (blue area) depletion region (white area) and the vortices are restricted to the space between grains. (C) For the porous media with a random distribution of the grains, the vortices are generated around the grains. Reprinted with permission from [160]. Copyright (2013) American Chemical Society.
Figure 43
Figure 43
Three regimes of ionic species transport through a microchannel, which is dead ended via a perm‐selective nanoporous membrane. For further details see [161].
Figure 44
Figure 44
Schematic illustration of the effective pore size of the pack of solid silica nanospheres. The figure has been reprinted from [162].
Figure 45
Figure 45
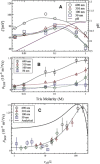
(A) Measured zeta potential as function of Tris molarity for the packed silica nanospheres. EOF mobility as a function of (B) Tris molarity and (C) the ratio of the effective pore size to the EDL thickness. The experimental measurements carried out for a different pack of solid silica nanospheres with distinct average pore sizes. The results have been reprinted from [162].
Figure 46
Figure 46
(A) Schematic illustration of the 3D randomly generated porous media where four different ionic species are introduced at the inlet of the porous media. The cross‐sections of the porous media are shown with porosities (B) ε= 0.3, (C) ε= 0.4, (D) ε= 0.5, and (E) ε= 0.6. The figures have been reprinted from [96].
Figure 47
Figure 47
Normalized cross‐sectional averaged velocity along the length of the porous media. Two scenarios were compared: homogenous and inhomogeneous external charge distribution. The figure has been reprinted from [96].
Figure 48
Figure 48
Schematic illustration of in situ EKR of groundwater from biological contaminants. The two transport mechanisms shown here are (I) electromigration and (II) electroosmosis. The figure has been reprinted from [165].

Similar articles

Cited by

References

    1. Overbeek, J. Th. G. , Wijga, P. W. O. , Recl. Trav. Chim. Pays‐Bas 1946, 65, 556–563.
    1. Burgreen, D. , Nakache, F. R. , J. Phys. Chem. 1964, 68, 1084–1091.
    1. Rice, C. L. , Whitehead, R. , J. Phys. Chem. 1965, 69, 4017–4024.
    1. Pretorius, V. , Hopkins, B. J. , Schieke, J. D. , J. Chromatogr 1974, 99, 23.
    1. Levine, S. , Marriott, J. R. , Neale, G. , Epstein, N. , J. Colloid Interface Sci. 1975, 52, 136–149.

Publication types

LinkOut - more resources