. 2021 Jan-Dec;13(1):1-24.
doi: 10.1080/19490976.2020.1854642.

Antihypertensive effects of exercise involve reshaping of gut microbiota and improvement of gut-brain axis in spontaneously hypertensive rat

Affiliations

Antihypertensive effects of exercise involve reshaping of gut microbiota and improvement of gut-brain axis in spontaneously hypertensive rat

Wen-Jie Xia et al. Gut Microbes. 2021 Jan-Dec.

Abstract

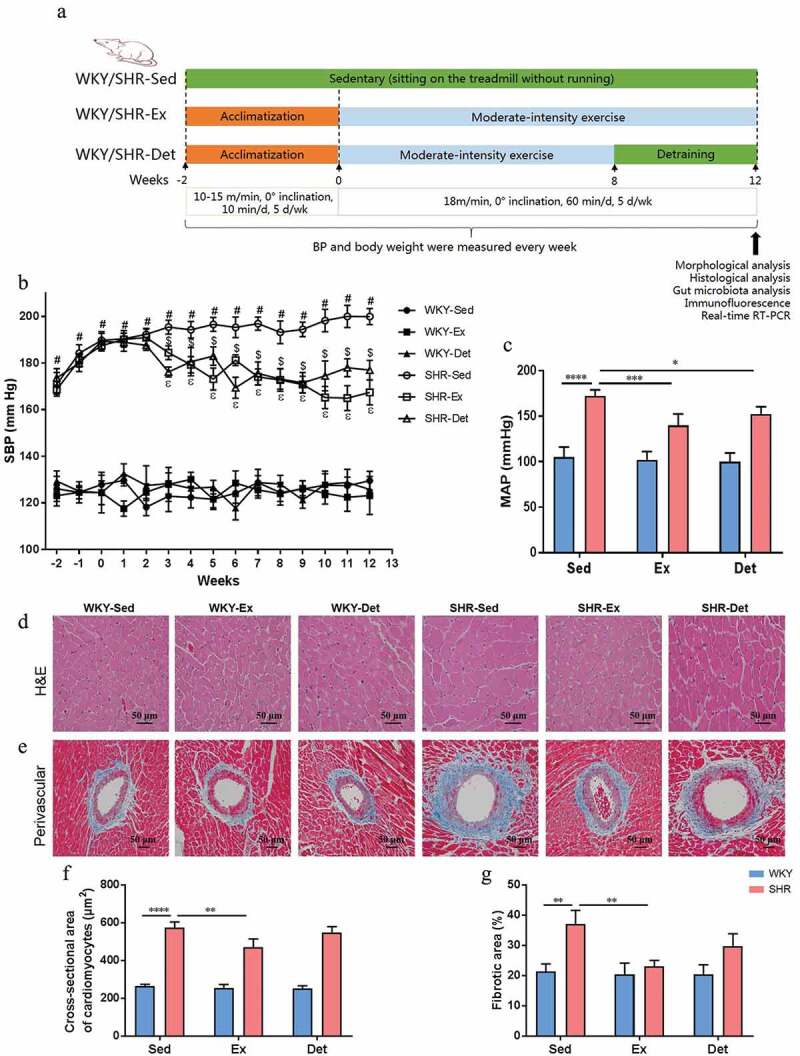
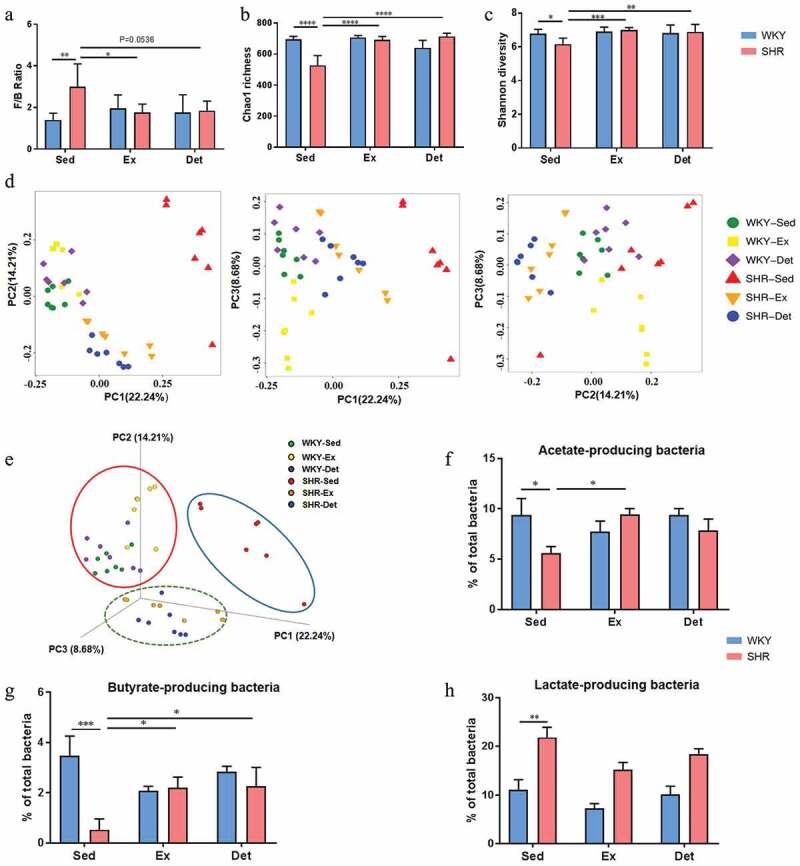
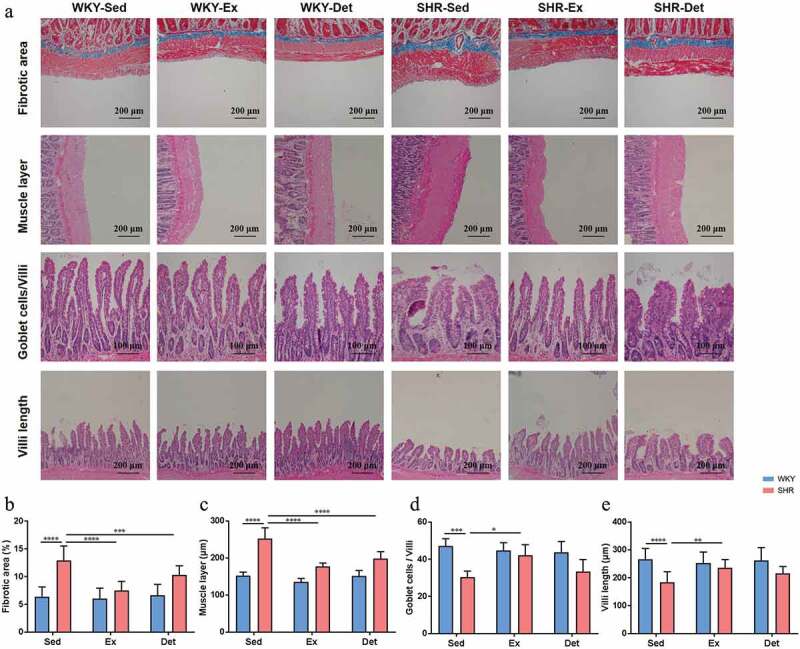
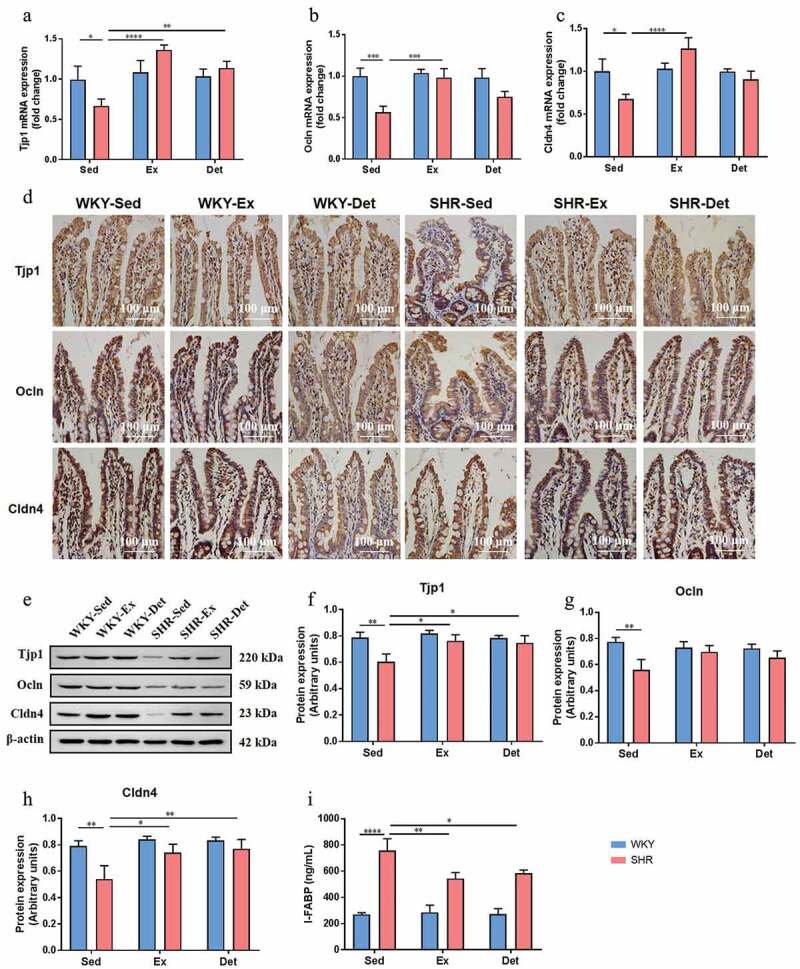
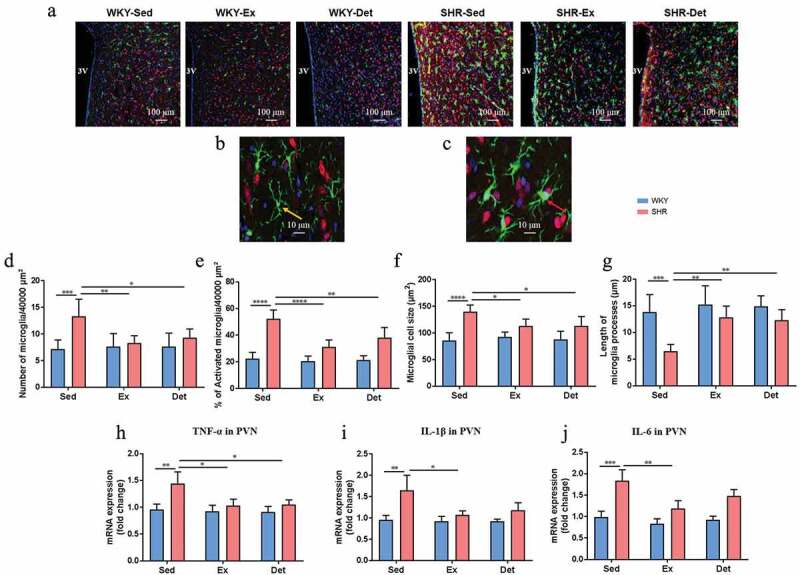
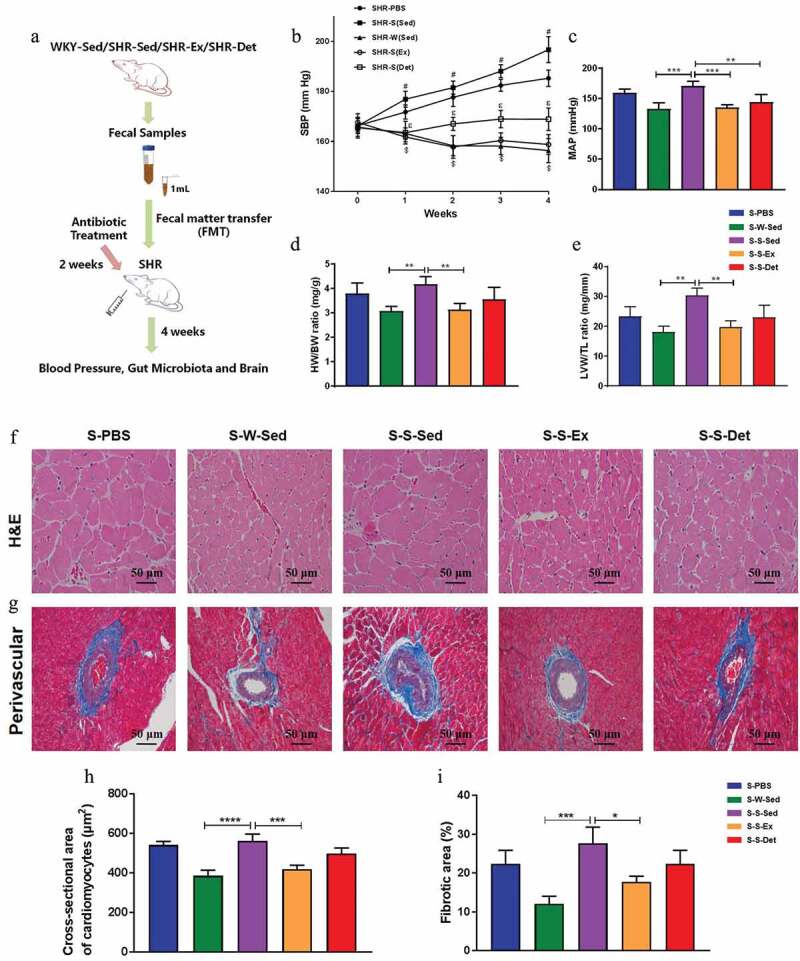
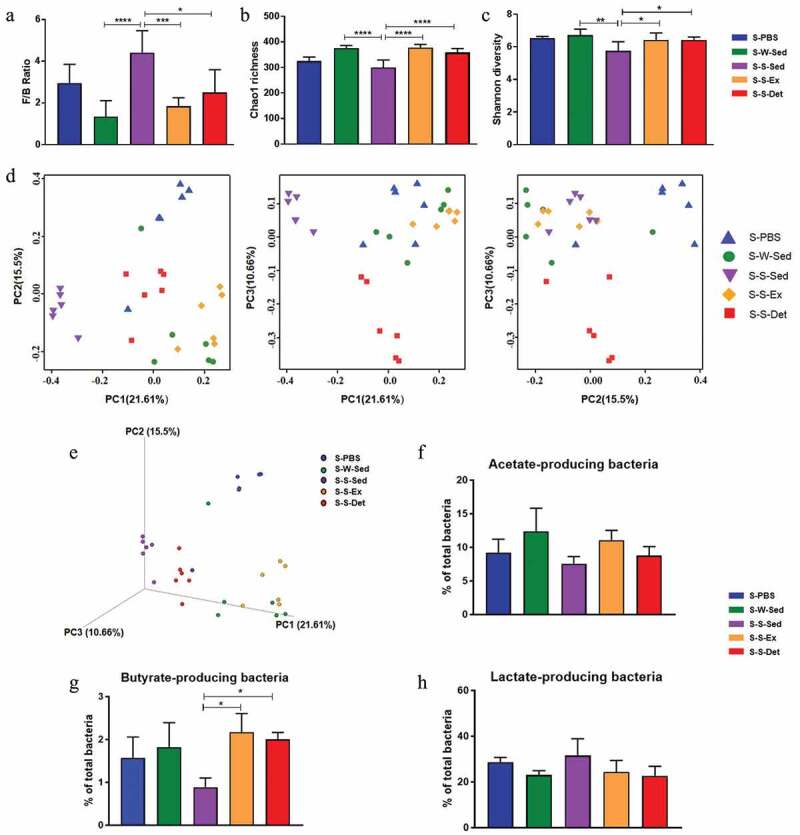
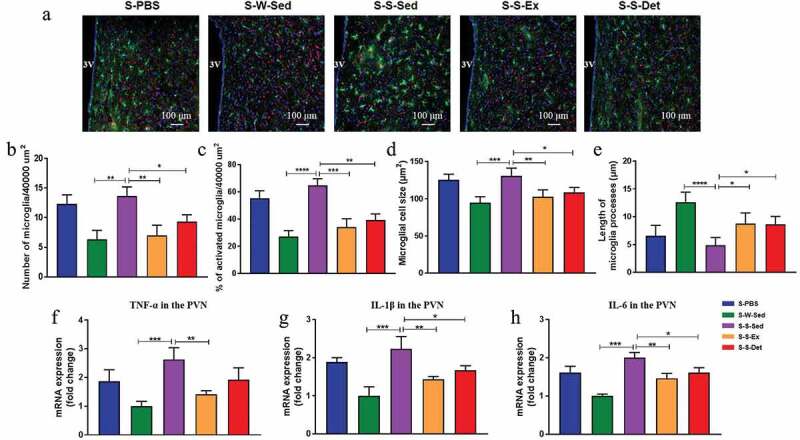
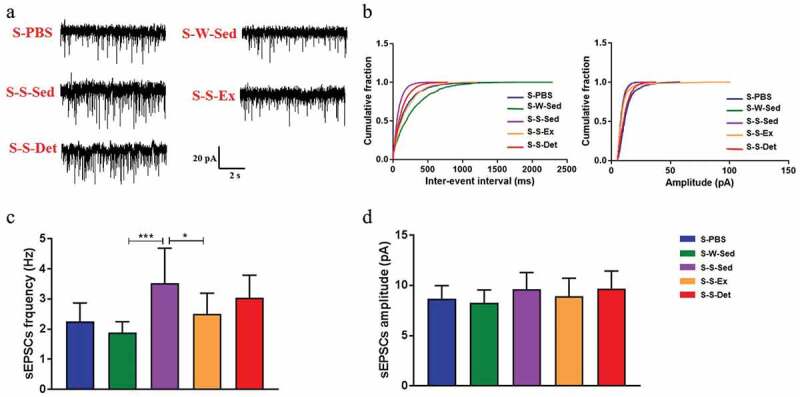
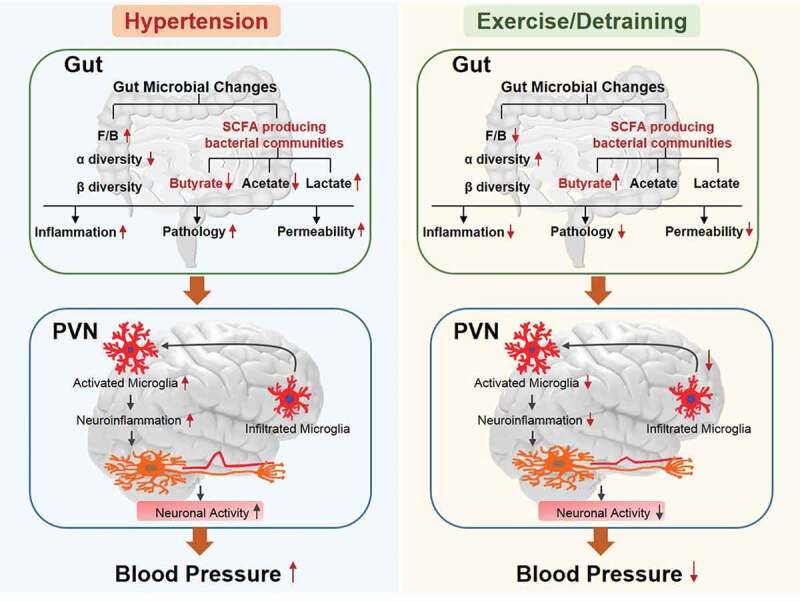
Exercise (Ex) has long been recognized to produce beneficial effects on hypertension (HTN). This coupled with evidence of gut dysbiosis and an impaired gut-brain axis led us to hypothesize that reshaping of gut microbiota and improvement in impaired gut-brain axis would, in part, be associated with beneficial influence of exercise. Male spontaneously hypertensive rats (SHR) and Wistar Kyoto (WKY) rats were randomized into sedentary, trained, and detrained groups. Trained rats underwent moderate-intensity exercise for 12 weeks, whereas, detrained groups underwent 8 weeks of moderate-intensity exercise followed by 4 weeks of detraining. Fecal microbiota, gut pathology, intestinal inflammation, and permeability, brain microglia and neuroinflammation were analyzed. We observed that exercise training resulted in a persistent decrease in systolic blood pressure in the SHR. This was associated with increase in microbial α diversity, altered β diversity, and enrichment of beneficial bacterial genera. Furthermore, decrease in the number of activated microglia, neuroinflammation in the hypothalamic paraventricular nucleus, improved gut pathology, inflammation, and permeability were also observed in the SHR following exercise. Interestingly, short-term detraining did not abolish these exercise-mediated improvements. Finally, fecal microbiota transplantation from exercised SHR into sedentary SHR resulted in attenuated SBP and an improved gut-brain axis. These observations support our concept that an impaired gut-brain axis is linked to HTN and exercise ameliorates this impairment to induce antihypertensive effects.

Keywords: Exercise; gut-brain axis; hypertension; microbiota; microglia.


Conflict of interest statement

All authors confirm that they are no conflicts of interest.

Figures

Figure 1.
Figure 1.
Effects of exercise training and detraining on blood pressure (BP) and morphological changes in organs in SHR and WKY rats. (a) Schematic illustration of exercise training and detraining program. (b) Time course of systolic BP (SBP) was measured via tail-cuff method in normotensive and hypertensive rats. (c) At the end of the study, mean arterial BP (MAP) was measured by intra-arterial recording into left carotid artery. (d) Representative micrographs showing the results of hematoxylin-eosin (H&E) staining in terms of cardiomyocytes size in different groups. (e) Representative micrographs of Masson’s trichrome staining assay showing perivascular fibrosis in myocardium. (f) A column diagram showing quantitative analysis of cross-sectional area of cardiomyocytes. (g) A column diagram showing quantitative analysis of the relative fibrotic area. n = 8–10 rats per group. Data are presented as mean ± SEM. SBP data were analyzed by one-way repeated-measures ANOVA with a Tukey’s post-hoc test. #P< .05 SHR-Sed versus WKY-Sed; $P< .05 SHR-Sed versus SHR-Ex; εP<.05 SHR-Sed versus SHR-Det. Other parameters were analyzed by two-way ANOVA with a Tukey’s post-hoc test. *P< .05; **P< .01; ***P< .001; ****P< .0001
Figure 2.
Figure 2.
Effects of exercise training and detraining on the remodeling of gut microbiota in SHR and WKY rats. (a) A column graph showing the ratio of phyla Firmicutes to Bacteroidetes (F/B). Chao1 richness (b) and Shannon diversity (c) scores of α-diversity of 16S rRNA sequencing of fecal samples in different groups.Two-dimensional (d) and three-dimensional (e) principal coordinate plot (PCoA) for β-diversity showing the clustering of gut microbial communities in different groups. Column diagrams show acetate- (f), butyrate-(g) and lactate-(h) producing bacteria in different groups. n = 7–8 rats per group. Data are presented as mean ± SEM. *P< .05; **P< .01; ***P< .001; ****P< .0001 using two-way ANOVA with a Tukey’s post-hoc test
Figure 3.
Figure 3.
Effects of exercise training and detraining on gut pathological alterations in the ileum in SHR and WKY rats. (a) Representative micrographs of hematoxylin-eosin (H&E) and Masson-trichrome staining assays showing the changes in the ileum in all experimental groups. (b) Cross section staining with Masson-trichrome stain performed to quantify the fibrotic area in the ileum. (c) Cross section staining with H&E stain performed to quantify the thickness of muscle layer in the ileum. (d) Quantitative analysis of cross section stained with H&E stain to observe the ratio of goblet cells/villi in the ileum. (e) Cross section staining with H&E stain to quantify the villi length in the ileum. n = 8–10 rats per group. Data are presented as mean ± SEM. *P< .05; **P< .01; ***P< .001; ****P< .0001 using two-way ANOVA with a Tukey’s post-hoc test
Figure 4.
Figure 4.
Effects of exercise training and detraining on gut permeability in SHR and WKY rats. The mRNA levels of tight junction proteins Tjp1 (a), Ocln (b) and Cldn4 (c) in small intestine (ileum) in all experimental groups. (d) Representative immunohistochemistry images showing Tjp1-, Ocln- and Cldn4-positive cells in the ileum in SHR and WKY rats. (e) A representative immunoblot; and (f-h) densitometric analysis of protein expression of Tjp1, Ocln and Cldn4 in the ileum in SHR and WKY rats. (i) Measurement of intestinal FABP level in the plasma in SHR and WKY rats. n = 8–10 rats per group. Data are presented as mean ± SEM. *P< .05; **P< .01; ***P< .001; ****P< .0001 using two-way ANOVA with a Tukey’s post-hoc test
Figure 5.
Figure 5.
Effects of exercise training and detraining on microglial activation and neuroinflammation in SHR and WKY rats. (a) Representative immunofluorescence images at 20× magnification show the paraventricular nucleus (PVN) sections stained with anti-Iba1 (ionized-calcium binding adaptor molecule 1) antibody indicative of microglia (green), anti-NeuN indicative of neurons (red), and DAPI showing DNA (blue). (b) Non-activated microglia exhibits a small cell body (yellow arrow) with thin and highly ramified branches extending in all directions. (c) Activated microglia manifests a more “ameboid” morphology, characterized by larger cell bodies (red arrow) with thickened and shortened processes. (d) Total number of microglia (activated + non-activated) and (e) % of activated microglia within the 40,000 µm2 area of PVN. (f) Microglial cell size and (g) average length of microglia processes (n = 15 largest cells per rat) in the PVN. The mRNA levels of TNF-α (h), IL-1β (i) and IL-6 (j) in the PVN measured by real-time PCR and normalized to GAPDH. n = 7–9 rats per group. Data are presented as mean ± SEM. *P< .05; **P< .01; ***P< .001; ****P< .0001 using two-way ANOVA with a Tukey’s post-hoc test
Figure 6.
Figure 6.
Effects of FMT on blood pressure and heart function in SHR. (a) The experimental protocol of FMT. (b) Time course of SBP was measured by tail-cuff plethysmography under each treatment. (c) MAP was measured by intra-arterial recording in the left carotid artery. Bar graphs show the ratios of HW/BW (d) and LVW/TL (e) under each treatment. (f) Representative micrographs showing the results of H&E staining in terms of cardiomyocytes size in different groups. (g) Representative micrographs of Masson’s trichrome staining assay showing perivascular fibrosis in myocardium. (h) A column diagram showing quantitative analysis of cross-sectional area of cardiomyocytes. (i) A column diagram showing quantitative analysis of the relative fibrotic area. n = 8–11 rats per group. Data are presented as mean ± SEM. SBP data were analyzed by one-way repeated-measures ANOVA with a Tukey’s post-hoc test. #P< .05 S-S-Sed versus S-W-Sed; $P< .05 S-S-Sed versus S-S-Ex; εP<.05 S-S-Sed versus S-S-Det. Other parameters were analyzed by one-way ANOVA with a Tukey’s post-hoc test. *P< .05; **P< .01; ***P< .001; ****P< .0001
Figure 7.
Figure 7.
Changes in the composition of gut microbiota after FMT in SHR. Changes in the Firmicutes to Bacteroidetes (F/B) ratio (a), Chao1 richness (b) and Shannon diversity (c) in different groups. Two-dimensional (d) and three-dimensional (e) principal coordinate analysis in the gut microbiota in all experimental groups are shown. The relative proportions of acetate- producing bacteria (f), butyrate- producing bacteria (g) and lactate-producing bacteria (h) in all experimental groups. n = 5–6 rats per group. Data are presented as mean ± SEM. *P< .05; **P< .01; ***P< .001; ****P< .0001using one-way ANOVA with a Tukey’s post-hoc test
Figure 8.
Figure 8.
Changes in the activated microglia and neuroinflammation of PVN after FMT in SHR. (a) The upper pictures show the number of microglia with anti-Iba1 antibody indicative of microglia (green), anti-NeuN indicative of neurons (red), and DAPI showing DNA (blue). (b) Total number of microglia (activated + non-activated) and (c) % of activated microglia within the 40,000 µm2 area of PVN. (d) Microglial cell size and (e) average length of microglia processes (n = 15 largest cells per rat) in the PVN. PVN mRNA levels of TNF-α (f), IL-1β (g) and IL-6 (h) measured under each treatment. n = 8–11 rats per group. Data are presented as mean ± SEM. *P< .05; **P< .01; ***P< .001; ****P< .0001 using one-way ANOVA with a Tukey’s post-hoc test
Figure 9.
Figure 9.
Changes in the physiological properties of PVN neurons after FMT in SHR. (a) Representative traces showing the spontaneous excitatory postsynaptic currents (sEPSCs) recorded in the PVN neurons in all experimental groups. (b) Cumulative inter-event interval (left) and amplitude histograms of the sEPSCs under each treatment. Statistical results of frequency (c) and amplitude (d) of the sEPSCs (n = 15 neurons/5 rats) in all experimental groups. Data are presented as mean ± SEM. *P< .05; **P< .01; ***P< .001; ****P< .0001 using one-way ANOVA with a Tukey’s post-hoc test
Figure 10.
Figure 10.
Changes in the sympathetic activity after FMT in SHR. (a) Representative immunofluorescence images of tyrosine hydroxylase (TH) in the proximal colon in all experimental groups. (b) A column diagram showing the statistical results of TH in the proximal colon under each treatment. (c) The mRNA level of TH measured by real-time RT-PCR in all experimental groups. (d) A column diagram showing plasma norepinephrine (NE) level under each treatment. n = 8–11 rats per group. Data are presented as mean ± SEM. *P< .05; **P< .01; ***P< .001; ****P< .0001 using one-way ANOVA with a Tukey’s post-hoc test
Figure 11.
Figure 11.
A schematic depicting the proposed pathways of effects of moderate- intensity exercise training and detraining on genetic hypertension. The left panel displays a dysfunctional gut-brain axis in hypertension and the right panel displays that moderate-intensity exercise in the SHR (spontaneously hypertensive rats), even with four weeks of detraining, produces a long-term antihypertensive effect and rebalanced dysfunctional gut-brain axis in hypertensive rats. F/B, Firmicutes/Bacteroidetes ratio (an important marker of gut microbiota dysbiosis); SCFA, short-chain fatty acids; PVN, paraventricular nucleus

Similar articles

Cited by

References

    1. Yang T, Santisteban MM, Rodriguez V, Li E, Ahmari N, Carvajal JM, Zadeh M, Gong M, Qi Y, Zubcevic J, et al. Gut dysbiosis is linked to hypertension. Hypertension. 2015;65(6):1331–1340. doi: 10.1161/HYPERTENSIONAHA.115.05315. - DOI - PMC - PubMed
    1. Yang T, Richards EM, Pepine CJ, Raizada MK.. The gut microbiota and the brain-gut-kidney axis in hypertension and chronic kidney disease. Nat Rev Nephrol. 2018;14:442–456. - PMC - PubMed
    1. Li J, Zhao F, Wang Y, Chen J, Tao J, Tian G, Wu S, Liu W, Cui Q, Geng B, et al. Gut microbiota dysbiosis contributes to the development of hypertension. Microbiome. 2017;5(1):14. doi: 10.1186/s40168-016-0222-x. - DOI - PMC - PubMed
    1. Toral M, Robles-Vera I, de la Visitacion N, Romero M, Sanchez M, Gomez-Guzman M, Rodriguez-Nogales A, Yang T, Jimenez R, Algieri F, et al. Role of the immune system in vascular function and blood pressure control induced by faecal microbiota transplantation in rats. Acta Physiol (Oxf). 2019;227:e13285. doi: 10.1111/apha.13285. - DOI - PubMed
    1. Toral M, Robles-Vera I, de la Visitacion N, Romero M, Yang T, Sanchez M, Gomez-Guzman M, Jimenez R, Raizada MK, Duarte J, et al. Critical role of the interaction gut microbiota - sympathetic nervous system in the regulation of blood pressure. Front Physiol. 2019;10:231. doi: 10.3389/fphys.2019.00231. - DOI - PMC - PubMed

Publication types

MeSH terms