. 2021 Mar 1;220(3):e201912041.
doi: 10.1083/jcb.201912041.

Adaptability of the ubiquitin-proteasome system to proteolytic and folding stressors

Affiliations

Adaptability of the ubiquitin-proteasome system to proteolytic and folding stressors

Jeremy J Work et al. J Cell Biol. .

Abstract

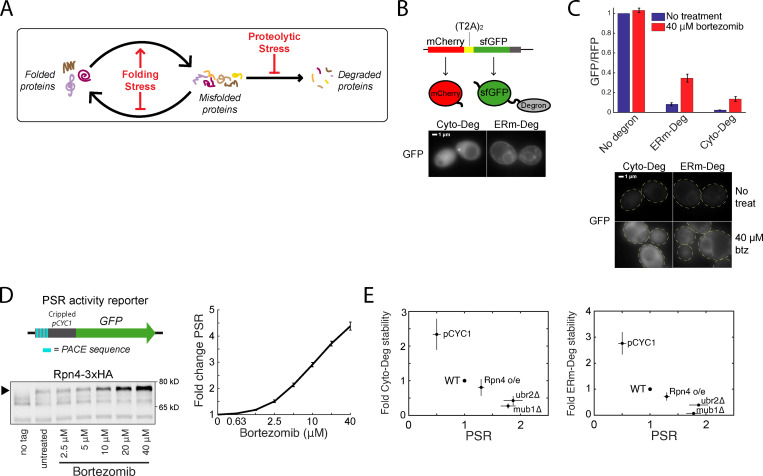
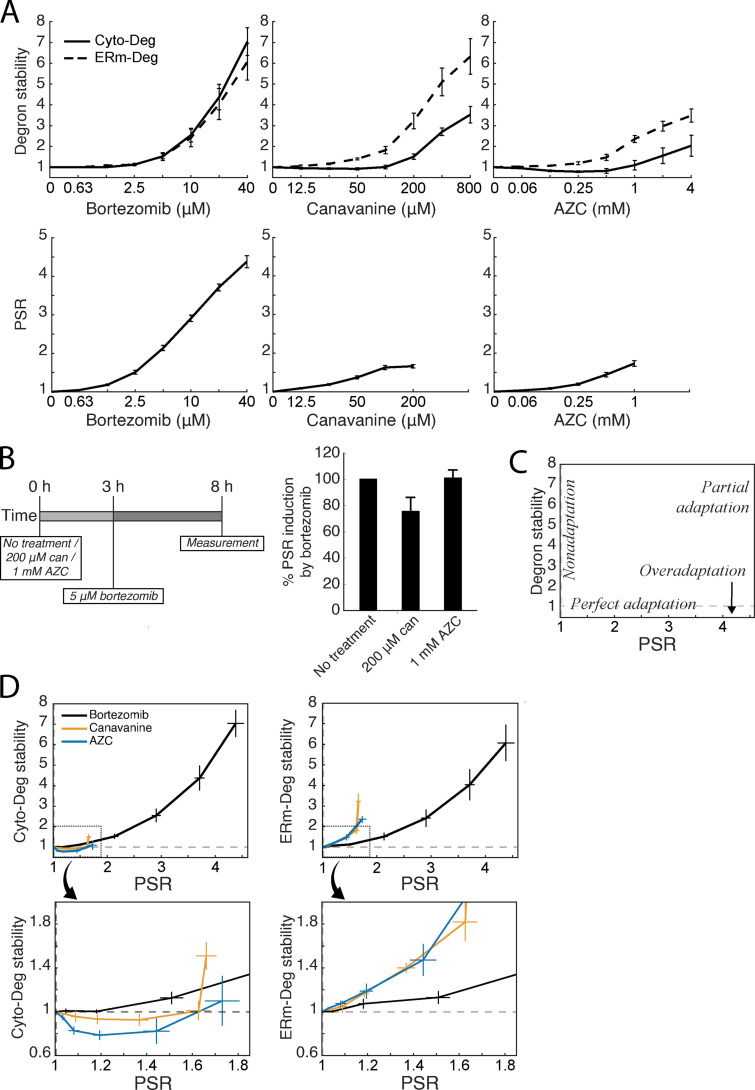
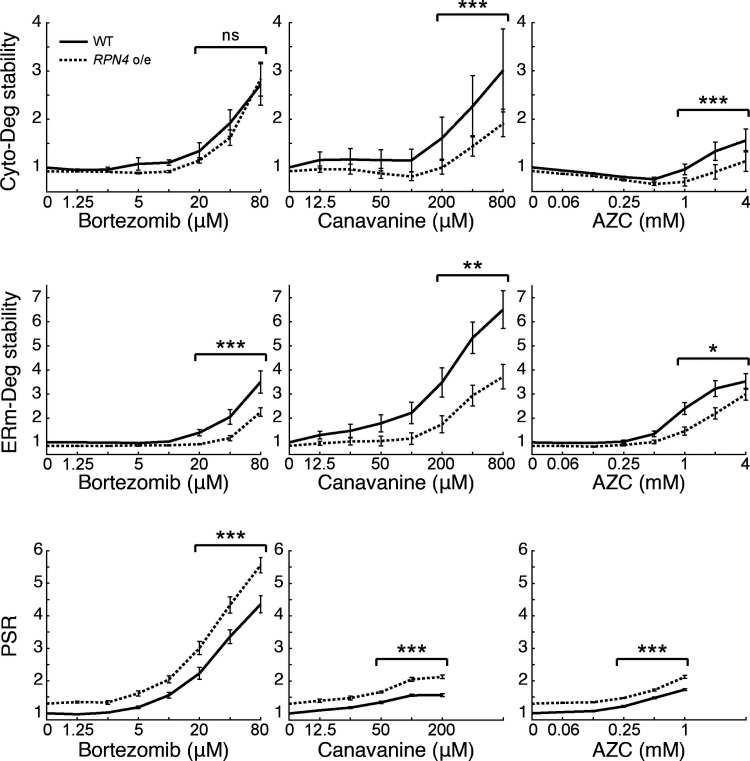
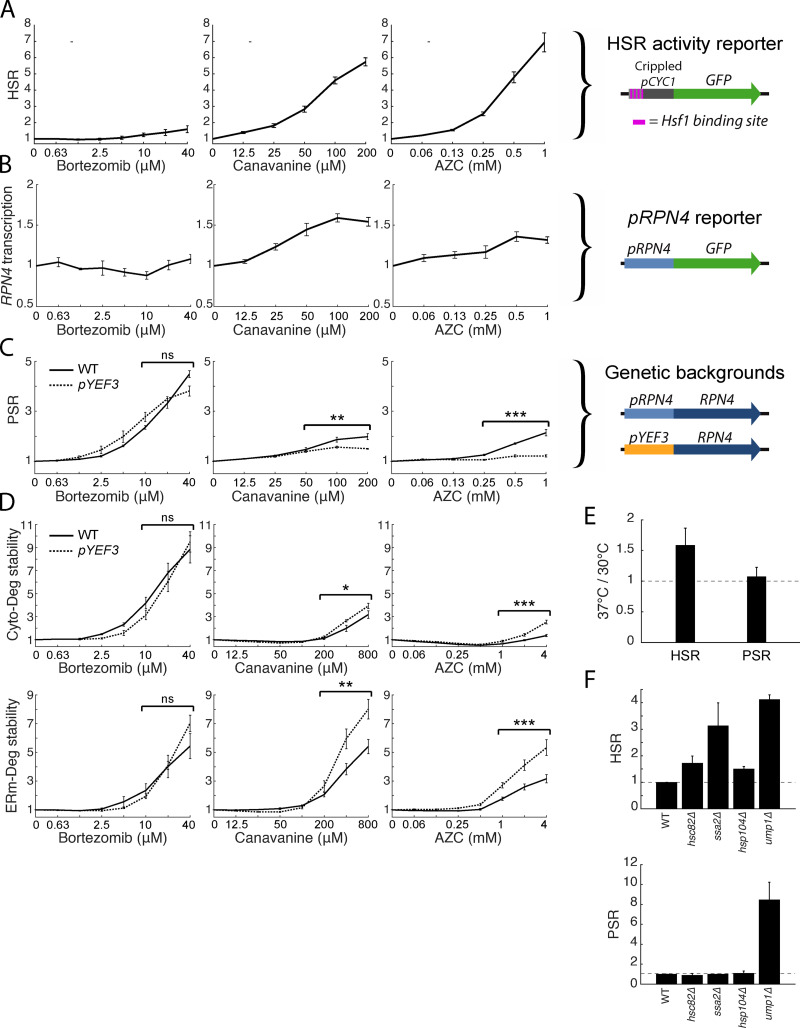
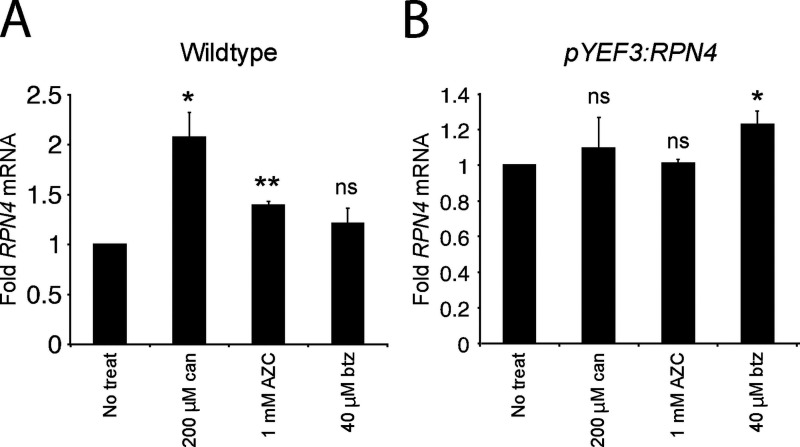
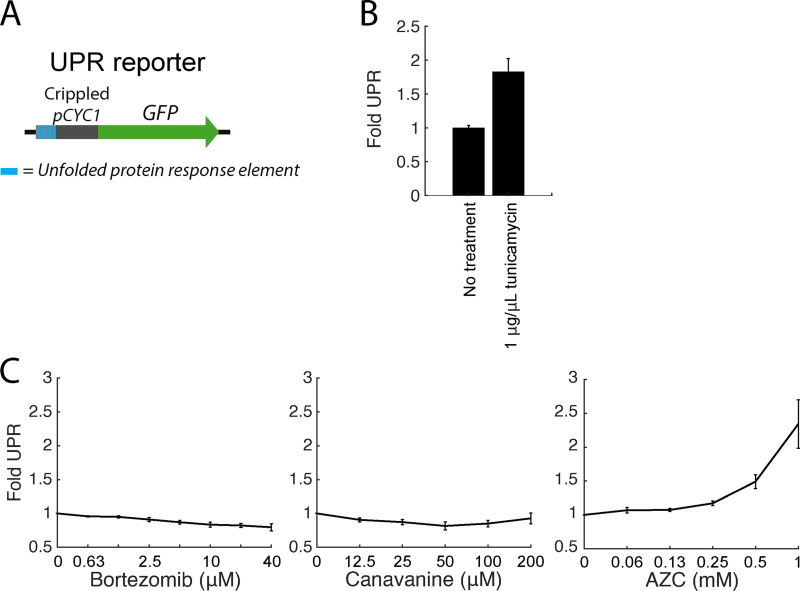
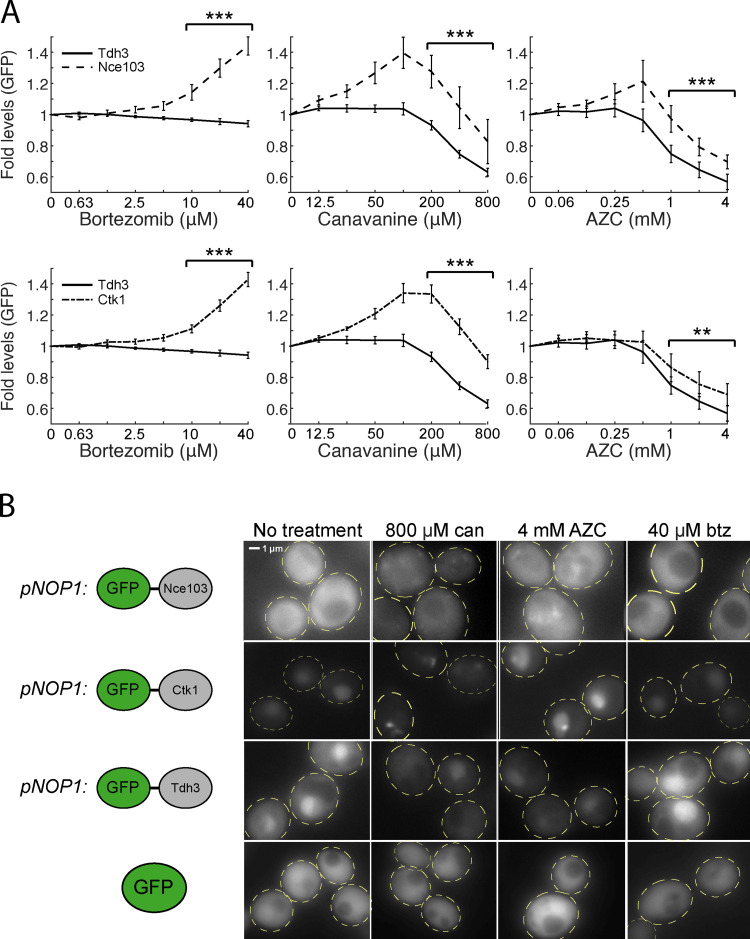
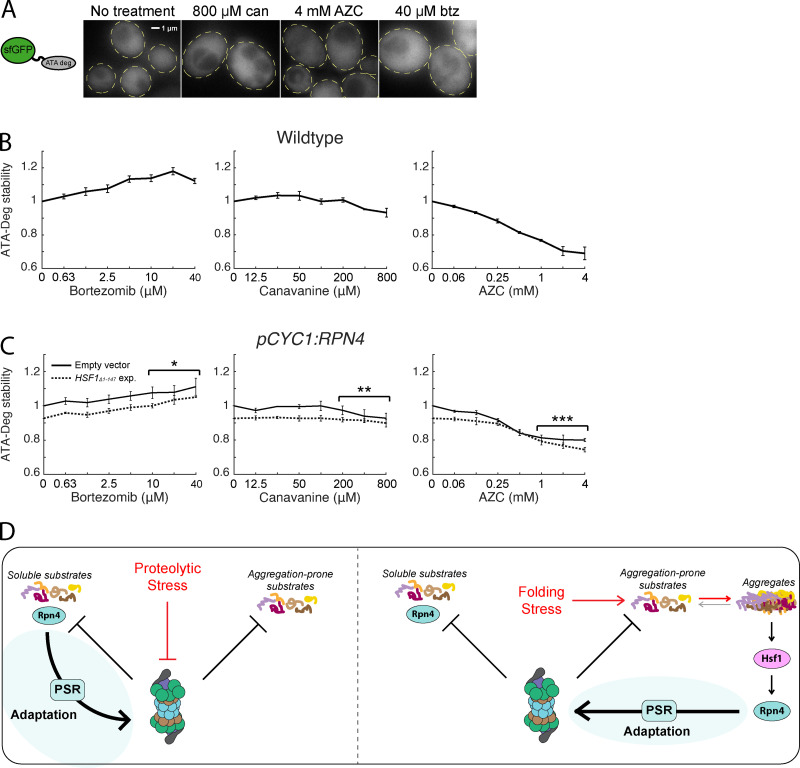
Aging, disease, and environmental stressors are associated with failures in the ubiquitin-proteasome system (UPS), yet a quantitative understanding of how stressors affect the proteome and how the UPS responds is lacking. Here we assessed UPS performance and adaptability in yeast under stressors using quantitative measurements of misfolded substrate stability and stress-dependent UPS regulation by the transcription factor Rpn4. We found that impairing degradation rates (proteolytic stress) and generating misfolded proteins (folding stress) elicited distinct effects on the proteome and on UPS adaptation. Folding stressors stabilized proteins via aggregation rather than overburdening the proteasome, as occurred under proteolytic stress. Still, the UPS productively adapted to both stressors using separate mechanisms: proteolytic stressors caused Rpn4 stabilization while folding stressors increased RPN4 transcription. In some cases, adaptation completely prevented loss of UPS substrate degradation. Our work reveals the distinct effects of proteotoxic stressors and the versatility of cells in adapting the UPS.


Figures

Figure 1.
Figure 1.
Clearance of defective proteins scales with the PSR. (A) Diagram of protein folding and degradation, and the effect of folding and proteolytic stress. (B) Top: Schematic of T2A system for controlled expression of degron reporters. Bottom: GFP localization of Cyto-Deg and ERm-Deg in normal conditions. (C) Top: Mean RFP-normalized GFP fluorescence of Cyto-Deg, ERm-Deg, and a no degron control with either 0 µM (blue bars) or 40 µM (red bars) bortezomib. Bottom: GFP localization of Cyto-Deg and ERm-Deg in either 0 µM or 40 μM bortezomib conditions. Cells are outlined in yellow dashed lines. (D) Top left: Schematic of PSR activity reporter. Bottom left: Immunoblot of HA-tagged endogenous Rpn4 under a serial titration of bortezomib. Arrow indicates the position of Rpn4-3xHA. Right: Mean forward scatter normalized GFP of PSR activity reporter under a serial titration of bortezomib. Units are fold change from no treatment. (E) Plots of fold degron stability (left: Cyto-Deg; right: ERm-Deg) versus fold PSR upon modifying Rpn4 levels through deletion of UBR2 or MUB1, replacement of the endogenous RPN4 promoter with pCYC1, or expression of a second copy of RPN4 from a plasmid. Error bars denote standard error for n = 3 biological replicates. btz, bortezomib; PACE, proteasome-associated control element; treat, treatment.
Figure 2.
Figure 2.
Proteotoxic stressors elicit multiple adaptive regimes. (A) Measurements of fold degron stability (top row, solid: Cyto-Deg; dotted: ERm-Deg) and fold PSR activity (bottom row) in titrations of bortezomib, canavanine, or AZC. (B) Measurement of PSR activity (right) after treatment with 5 µM bortezomib and either 200 µM canavanine, 1 mM AZC, or no additional treatment, at the noted time points (left). (C) Schematic of adaptive regimes as a function of degron stability and PSR activity. (D) Plots of fold degron stability (left: Cyto-Deg; right: ERm-Deg) versus fold PSR activity for the titrations in A to reveal the adaptive regime for each stressor. The boxed regions in the upper plots are enlarged in the lower plots. Error bars denote standard error for n ≥ 3 biological replicates. can, canavanine.
Figure 3.
Figure 3.
Boosting the PSR improves UPS performance under stress. Measurements of fold degron stability (top: Cyto-Deg; middle: ERm-Deg) and fold PSR activity (bottom) in titrations of bortezomib, canavanine, or AZC for cells expressing an empty vector (black, "WT") or a second copy of RPN4, causing overexpression (dotted, "RPN4 o/e"). Significance was collectively tested across the three highest concentrations measured by combining data from these concentrations into one group per genetic context, then performing a paired two-sided Student’s t test. Error bars denote standard error for n ≥ 3 biological replicates. ns, P > 0.05; *, P < 0.05; **, P < 0.01; and ***, P < 0.001.
Figure 4.
Figure 4.
Folding stressors activate the PSR via transcription of RPN4 and do not increase UPS substrate load. (A) Schematic of a HSR reporter (right) and its fold GFP induction in titrations of bortezomib, canavanine, and AZC (left). (B) Schematic of a pRPN4 reporter (right) and its fold GFP induction in titrations of bortezomib, canavanine, and AZC (left). (C) Schematic of the RPN4 locus in wild type or a pYEF3:RPN4 background (right), and measurements of fold PSR activity in stressor titrations for both strains (left). (D) Measurements of Cyto-Deg (top) and ERm-Deg (bottom) fold stability for titrations of bortezomib, canavanine, or AZC in either a wild type (solid) or pYEF3:RPN4 (dotted) background. Titrations of both strains are normalized to the no-treatment values of each reporter. (E) Mean fold activity of the HSR or PSR at 37°C relative to 30°C in wild-type cells. (F) Mean fold activity of the HSR (left) or PSR (right) relative to wild type upon deletion of HSC82, SSA2, HSP104, or UMP1. For titrations, significance was collectively tested across the three highest concentrations measured by combining data from these concentrations into one group per genetic context, then performing a paired two-sided Student’s t test. Error bars denote standard error for n ≥ 3 biological replicates. ns, P > 0.05; *, P < 0.05; **, P < 0.01; and ***, P < 0.001.
Figure S1.
Figure S1.
Folding stressors increase RPN4 mRNA in wild type but not in the pYEF3:RPN4 background. (A and B) Mean fold RPN4 mRNA measured by RT-qPCR in wild-type yeast (A) or pYEF3:RPN4 yeast (B) after treatment with canavanine, AZC, or bortezomib. Values are normalized to ACT1 mRNA, then normalized to no treatment. Significance between the untreated and treated samples was determined by a paired two-sided Student’s t test. Error bars denote standard error for n = 3 biological replicates. ns, P > 0.05; *, P < 0.05; and **, P < 0.01. btz, bortezomib; can, canavanine; treat, treatment.
Figure S2.
Figure S2.
Expression of Hsf1Δ1-147 activates the HSR and its canonical targets, Hsp104 and Sis1. (A) Mean fold activity of the HSR or PSR in cells expressing either an empty plasmid vector or a vector expressing HSF1Δ1-147. (B) Mean fold change in levels of Hsp104-mKate or Sis-mKate in cells expressing either an empty plasmid vector or a vector expressing HSF1Δ1-147. Error bars denote standard error for n = 3 biological replicates.
Figure 5.
Figure 5.
Folding stressors cause aggregation and result in failure to target aggregation-prone substrates to the proteasome. (A) Measurements of fold degron stability (top: Cyto-Deg, middle: ERm-Deg) and fold PSR activity (bottom) in titrations of bortezomib, canavanine, or AZC for cells expressing an empty vector (solid) or a copy of HSF1Δ1-147 (dotted). Significance was collectively tested across the three highest concentrations measured by combining data from these concentrations into one group per genetic context, then performing a paired two-sided Student’s t test. Error bars denote standard error for n ≥ 3 biological replicates. (B and C) Fluorescent localization of ERm-Deg (GFP), Cyto-Deg (GFP), or Hsp104-mKate2 (RFP) in cells treated with 800 µM canavanine, 4 mM AZC, 40 µM bortezomib, or no treatment for 5 h. Cells are outlined in yellow dashed lines. ns, P > 0.05; **, P < 0.01; and ***, P < 0.001. btz, bortezomib; can, canavanine.
Figure S3.
Figure S3.
Folding stressors cause aggregation and recruitment of heat shock proteins. (A) Fluorescent localization of ERm-Deg (GFP), Cyto-Deg (GFP), or Hsp104-mKate2 (RFP) in cells treated with 200 µM canavanine, 1 mM AZC, 40 µM bortezomib, or no treatment for 5 h. Cells are outlined in yellow dashed lines. (B) Immunoblot of Cyto-Deg after cells were treated with canavanine, AZC, or bortezomib. Aggregated material was collected from the cells by centrifugation, and the input, supernatant (sup), and pellet were immunoblotted. Arrows denote the position of Cyto-Deg. (C) Quantification of n = 3 biological replicates of the immunoblot in B. Values are normalized to the respective input of each sample. (D) Fluorescent localization of GFP-Sis1 and GFP-Ssa1 in cells treated with 800 µM canavanine, 4 mM AZC, 40 µM bortezomib, or no treatment for 5 h. btz, bortezomib; can, canavanine; Exp., exposure; treat, treatment.
Figure S4.
Figure S4.
Unfolded protein response (UPR) activation under folding and proteolytic stressors. (A) Schematic of the UPR reporter. (B) Mean fold UPR activity upon treatment with 1 µg/µl tunicamycin for 5 h. (C) Mean fold UPR activity upon treatment with a titration of botezomib, canavanine, or AZC. Error bars denote standard error for n = 3 biological replicates.
Figure S5.
Figure S5.
Short-lived proteins Nce103 and Ctk1 under folding and proteolytic stressors. (A) Measurements of fold protein (top: GFP-Nce103 and GFP-Tdh3; bottom: GFP-Ctk1 and GFP-Tdh3) levels in titrations of bortezomib, canavanine, or AZC. Significance was collectively tested across the three highest concentrations measured by combining data from these concentrations into one group per genetic context, then performing a paired two-sided Student’s t test. Error bars denote standard error for n > 3 biological replicates. (B) Fluorescent localization of GFP-Nce103, GFP-Ctk1, GFP-Tdh3, and free GFP in cells treated with 800 µM canavanine, 4 mM AZC, 40 µM bortezomib, or no treatment for 5 h. Free GFP is expressed from pTDH3. Cells are outlined in yellow dashed lines. **, P < 0.01; and ***, P < 0.001. btz, bortezomib; can, canavanine.
Figure 6.
Figure 6.
Folding stressors do not impair degradation of soluble UPS substrates. (A) Fluorescent localization of ATA-Deg (GFP) in cells treated with 800 µM canavanine, 4 mM AZC, 40 µM bortezomib, or no treatment for 5 h. Cells are outlined in yellow dashed lines. (B) Measurements of fold ATA-Deg stability in titrations of bortezomib, canavanine, or AZC. (C) Fold ATA-Deg stability in drug titrations in cells expressing an empty vector (solid) or a copy of HSF1Δ1-147 (dotted). Significance was collectively tested across the three highest concentrations measured by combining data from these concentrations into one group per genetic context, then performing a paired two-sided Student’s t test. Error bars throughout denote standard error for n ≥ 3 biological replicates. (D) Model for UPS adaptation by the PSR to proteolytic and folding stressors. Left: Proteolytic stressors increase the stability of all proteasome substrates. This includes Rpn4, whose accumulation leads to PSR activation. Right: Folding stressors causes some proteasome substrates to sequester into aggregates. Aggregation triggers the HSR, activates transcription of RPN4, and causes PSR activation. *, P < 0.05; **, P < 0.01; and ***, P < 0.001. btz, bortezomib; can, canavanine; exp., exposure.

Similar articles

Cited by

References

    1. Alford, B.D., and Brandman O.. 2018. Quantification of Hsp90 availability reveals differential coupling to the heat shock response. J. Cell Biol. 217:3809–3816. 10.1083/jcb.201803127 - DOI - PMC - PubMed
    1. Amorós, M., and Estruch F.. 2001. Hsf1p and Msn2/4p cooperate in the expression of Saccharomyces cerevisiae genes HSP26 and HSP104 in a gene- and stress type-dependent manner. Mol. Microbiol. 39:1523–1532. 10.1046/j.1365-2958.2001.02339.x - DOI - PubMed
    1. Betting, J., and Seufert W.. 1996. A yeast Ubc9 mutant protein with temperature-sensitive in vivo function is subject to conditional proteolysis by a ubiquitin- and proteasome-dependent pathway. J. Biol. Chem. 271:25790–25796. 10.1074/jbc.271.42.25790 - DOI - PubMed
    1. Borkovich, K.A., Farrelly F.W., Finkelstein D.B., Taulien J., and Lindquist S.. 1989. hsp82 is an essential protein that is required in higher concentrations for growth of cells at higher temperatures. Mol. Cell. Biol. 9:3919–3930. 10.1128/MCB.9.9.3919 - DOI - PMC - PubMed
    1. Brandman, O., Stewart-Ornstein J., Wong D., Larson A., Williams C.C., Li G.-W., Zhou S., King D., Shen P.S., Weibezahn J., et al. . 2012. A ribosome-bound quality control complex triggers degradation of nascent peptides and signals translation stress. Cell. 151:1042–1054. 10.1016/j.cell.2012.10.044 - DOI - PMC - PubMed

Publication types

MeSH terms