. 2021 Mar;48(3):1356-1364.
doi: 10.1002/mp.14700. Epub 2021 Feb 4.

Technical Note: A fast and monolithic prototype clinical proton radiography system optimized for pencil beam scanning

Affiliations

Technical Note: A fast and monolithic prototype clinical proton radiography system optimized for pencil beam scanning

Ethan A DeJongh et al. Med Phys. 2021 Mar.

Abstract

Purpose: To demonstrate a proton-imaging system based on well-established fast scintillator technology to achieve high performance with low cost and complexity, with the potential of a straightforward translation into clinical use.

Methods: The system tracks individual protons through one (X, Y) scintillating fiber tracker plane upstream and downstream of the object and into a 13-cm -thick scintillating block residual energy detector. The fibers in the tracker planes are multiplexed into silicon photomultipliers (SiPMs) to reduce the number of electronics channels. The light signal from the residual energy detector is collected by 16 photomultiplier tubes (PMTs). Only four signals from the PMTs are output from each event, which allows for fast signal readout. A robust calibration method of the PMT signal to residual energy has been developed to obtain accurate proton images. The development of patient-specific scan patterns using multiple input energies allows for an image to be produced with minimal excess dose delivered to the patient.

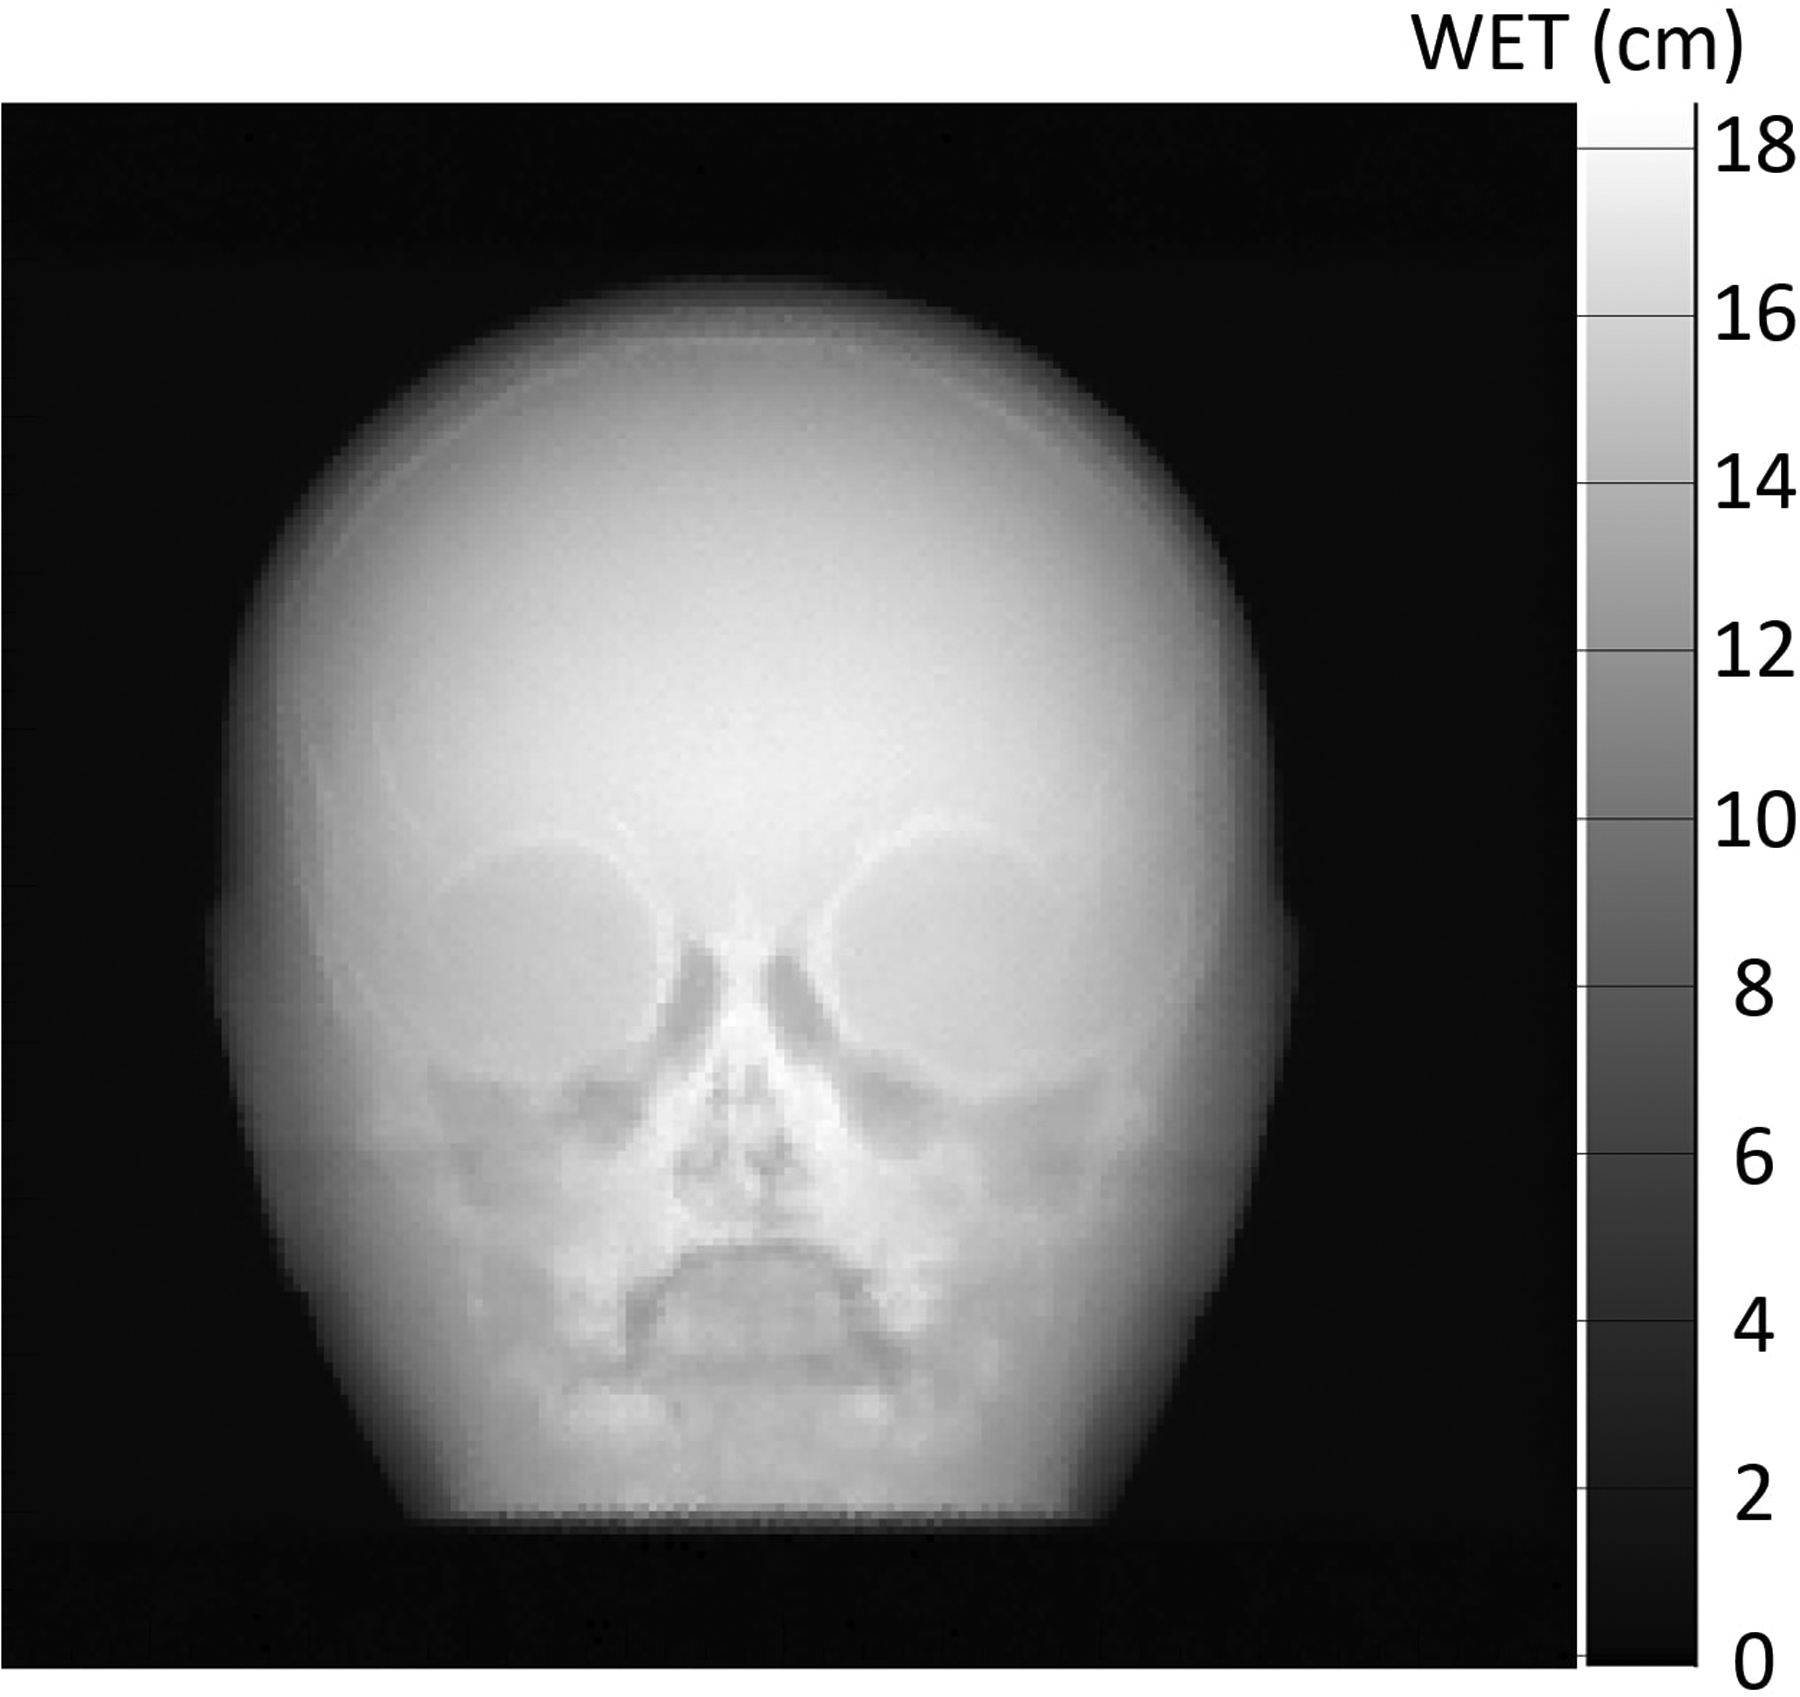
Results: The calibration of signals in the energy detector produces accurate residual range measurements limited by intrinsic range straggling. We measured the water-equivalent thickness (WET) of a block of solid water (physical thickness of 6.10 mm) with a proton radiograph. The mean WET from all pixels in the block was 6.13 cm (SD 0.02 cm). The use of patient-specific scan patterns using multiple input energies enables imaging with a compact range detector.

Conclusions: We have developed a prototype clinical proton radiography system for pretreatment imaging in proton radiation therapy. We have optimized the system for use with pencil beam scanning systems and have achieved a reduction of size and complexity compared to previous designs.

Keywords: calibration; proton imaging; proton radiography.


Conflict of interest statement

CONFLICT OF INTEREST STATEMENT

The authors have intellectual property rights to the innovations described in this paper. James S. Welsh has served as a medical advisor to ProTom International. Don F. DeJongh and Victor Rykalin are co-owners of ProtonVDA LLC.

Figures

Figure 1:
Figure 1:
Diagram depicting the radiography detector system. The proton source is on the left side of the image, and the pencil beam has a known location at isocenter. The proton passes through the upstream scintillating fiber tracker plane, the phantom, the downstream scintillating fiber tracker plane, then stops in the scintillating block of the energy detector. The scintillating block converts the residual energy of the proton into light, which is collected by 16 PMTs located on the downstream face of the scintillating block.
Figure 2:
Figure 2:
a) Cross-section of an X or Y tracker plane consisting of two layers in beam’s eye view of scintillating fibers each 1 × 1 mm2 by 40 cm active length. The fibers are grouped into 12 bunches of 32 fiber pairs where each pair includes one fiber from each layer. All fibers from every bunch with the same numerical label are attached to a single silicon photomultiplier (SiPM), which has an active area of 6 × 6 mm2. b) Top view of four adjacent fiber bunches. One fiber pair from each bunch is read out through a common SiPM. So, each SiPM reads out 12 fiber pairs regularly spaced across the plane.
Figure 2:
Figure 2:
a) Cross-section of an X or Y tracker plane consisting of two layers in beam’s eye view of scintillating fibers each 1 × 1 mm2 by 40 cm active length. The fibers are grouped into 12 bunches of 32 fiber pairs where each pair includes one fiber from each layer. All fibers from every bunch with the same numerical label are attached to a single silicon photomultiplier (SiPM), which has an active area of 6 × 6 mm2. b) Top view of four adjacent fiber bunches. One fiber pair from each bunch is read out through a common SiPM. So, each SiPM reads out 12 fiber pairs regularly spaced across the plane.
Figure 3.
Figure 3.
Block diagram of the signal flow from the trackers and energy detector to the National Instruments (NI) DAQ box.
Figure 4:
Figure 4:
a) Spatial map of the E signal, i.e., the sum of the 16 PMT signals, for a uniform scan of protons that have a 10 cm residual range in the energy detector. The spacing of the PMTs create a position dependence in the E signal. Note that the noise at the boundaries come from being at the edge of the beam field and therefore less data. b) Plot of the E signal versus residual range for the three (X, Y) positions indicated by different symbols in Figure 4a. The E signal increases with residual range because a higher energy particle entering the scintillator block will produce more light, and, therefore, a higher overall signal. For additional details, see text.
Figure 4:
Figure 4:
a) Spatial map of the E signal, i.e., the sum of the 16 PMT signals, for a uniform scan of protons that have a 10 cm residual range in the energy detector. The spacing of the PMTs create a position dependence in the E signal. Note that the noise at the boundaries come from being at the edge of the beam field and therefore less data. b) Plot of the E signal versus residual range for the three (X, Y) positions indicated by different symbols in Figure 4a. The E signal increases with residual range because a higher energy particle entering the scintillator block will produce more light, and, therefore, a higher overall signal. For additional details, see text.
Figure 5:
Figure 5:
Weights of the individual PMT signals for a) the U signal, b) the V signal, and c) the C signal.
Figure 5:
Figure 5:
Weights of the individual PMT signals for a) the U signal, b) the V signal, and c) the C signal.
Figure 5:
Figure 5:
Weights of the individual PMT signals for a) the U signal, b) the V signal, and c) the C signal.
Figure 6:
Figure 6:
a) Proton radiograph of a 6.10 cm thick block of solid water using 128 MeV protons. b) Histogram with the best-fit normal distribution of the measured WEPL values of individual protons resulting in a mean value of 6.12 cm (SD 0.26 cm). c) Histogram with the best-fit normal distribution of the reconstructed average WET values per pixel resulting in a mean value of 6.13 cm (SD 0.02 cm).
Figure 6:
Figure 6:
a) Proton radiograph of a 6.10 cm thick block of solid water using 128 MeV protons. b) Histogram with the best-fit normal distribution of the measured WEPL values of individual protons resulting in a mean value of 6.12 cm (SD 0.26 cm). c) Histogram with the best-fit normal distribution of the reconstructed average WET values per pixel resulting in a mean value of 6.13 cm (SD 0.02 cm).
Figure 7:
Figure 7:
Dose distribution in a single axial slice of the pediatric head phantom from a proton radiograph with three energy scans. The proton beam is coming from the bottom of the image. a) The phantom is scanned for each energy separately, and many protons in the lower energy scans stop in the phantom. The 100 MeV protons have the shortest range and deposit greater dose midway through the phantom. The 140 MeV protons deposit greater dose in the thickest portion of the phantom. The 180 MeV protons pass completely through the phantom and deposit very little dose in the phantom. However, in the regions outside the phantom will have too high of residual energy to stop in the energy detector. b) Diagram depicting the locations of the 100 MeV pencil beams (dark grey), 140 MeV pencil beams (light grey), and 180 MeV pencil beams(white) in the patient-specific scan pattern for an anterior-posterior (AP) proton radiograph. At these locations, most of the protons will pass completely through the phantom, minimizing the deposited dose. c) Dose distribution from the patient-specific scan pattern shown in Figure 7b. Note that different grey scales were used for Figures 7a and 7c.
Figure 7:
Figure 7:
Dose distribution in a single axial slice of the pediatric head phantom from a proton radiograph with three energy scans. The proton beam is coming from the bottom of the image. a) The phantom is scanned for each energy separately, and many protons in the lower energy scans stop in the phantom. The 100 MeV protons have the shortest range and deposit greater dose midway through the phantom. The 140 MeV protons deposit greater dose in the thickest portion of the phantom. The 180 MeV protons pass completely through the phantom and deposit very little dose in the phantom. However, in the regions outside the phantom will have too high of residual energy to stop in the energy detector. b) Diagram depicting the locations of the 100 MeV pencil beams (dark grey), 140 MeV pencil beams (light grey), and 180 MeV pencil beams(white) in the patient-specific scan pattern for an anterior-posterior (AP) proton radiograph. At these locations, most of the protons will pass completely through the phantom, minimizing the deposited dose. c) Dose distribution from the patient-specific scan pattern shown in Figure 7b. Note that different grey scales were used for Figures 7a and 7c.
Figure 8:
Figure 8:
Simulated proton radiograph using the patient-specific scan pattern shown in Figure 7b and Figure 7c. The radiograph was reconstructed using the image reconstruction techniques described in Ordoñez, et. al.. The reconstruction algorithm automatically removes protons that did not stop in the energy detector. This means that the proton radiograph created with the full-field uniform scan will be identical.

References

    1. Koehler AM. Proton radiography. Science (80- ). 1968;160(3825):303–304. doi:10.1126/science.160.3825.303 - DOI - PubMed
    1. Schneider U, Pedroni E. Proton radiography as a tool for quality control in proton therapy. Med Phys. 1995;22(4):353–363. doi:10.1118/1.597470 - DOI - PubMed
    1. Romero JL, Osborne JH, Brady FP, et al. Patient positioning for proton therapy using a proton range telescope. Nucl Inst Methods Phys Res A. 1995;356(2–3):558–565. doi:10.1016/0168-9002(94)01353-5 - DOI
    1. Krah N, Patera V, Rit S, Schiavi A, Rinaldi I. Regularised patient-specific stopping power calibration for proton therapy planning based on proton radiographic images. Phys Med Biol. 2019;64(6). doi:10.1088/1361-6560/ab03db - DOI - PubMed
    1. Doolan PJ, Testa M, Sharp G, Bentefour EH, Royle G, Lu HM. Patient-specific stopping power calibration for proton therapy planning based on single-detector proton radiography. Phys Med Biol. 2015;60(5):1901–1917. doi:10.1088/0031-9155/60/5/1901 - DOI - PubMed

LinkOut - more resources