Correlative light electron ion microscopy reveals in vivo localisation of bedaquiline in Mycobacterium tuberculosis-infected lungs
- PMID: 33382684
- PMCID: PMC7810513
- DOI: 10.1371/journal.pbio.3000879
Correlative light electron ion microscopy reveals in vivo localisation of bedaquiline in Mycobacterium tuberculosis-infected lungs
Abstract
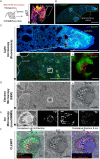
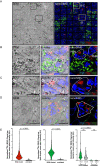
Correlative light, electron, and ion microscopy (CLEIM) offers huge potential to track the intracellular fate of antibiotics, with organelle-level resolution. However, a correlative approach that enables subcellular antibiotic visualisation in pathogen-infected tissue is lacking. Here, we developed correlative light, electron, and ion microscopy in tissue (CLEIMiT) and used it to identify the cell type-specific accumulation of an antibiotic in lung lesions of mice infected with Mycobacterium tuberculosis. Using CLEIMiT, we found that the anti-tuberculosis (TB) drug bedaquiline (BDQ) is localised not only in foamy macrophages in the lungs during infection but also accumulate in polymorphonuclear (PMN) cells.
Conflict of interest statement
The authors have declared that no competing interests exist.
Figures


Similar articles
-
Intracellular localisation of Mycobacterium tuberculosis affects efficacy of the antibiotic pyrazinamide.Nat Commun. 2021 Jun 21;12(1):3816. doi: 10.1038/s41467-021-24127-3. Nat Commun. 2021. PMID: 34155215 Free PMC article.
-
Subcellular antibiotic visualization reveals a dynamic drug reservoir in infected macrophages.Science. 2019 Jun 28;364(6447):1279-1282. doi: 10.1126/science.aat9689. Epub 2019 Jun 27. Science. 2019. PMID: 31249058 Free PMC article.
-
Validation of bedaquiline drug-susceptibility testing by BACTEC MGIT 960 system for Mycobacterium tuberculosis.Int J Mycobacteriol. 2019 Oct-Dec;8(4):329-332. doi: 10.4103/ijmy.ijmy_151_19. Int J Mycobacteriol. 2019. PMID: 31793501
-
Bedaquiline: A New Hope for Shorter and Better Anti-Tuberculosis Regimens.Recent Pat Antiinfect Drug Discov. 2018;13(1):3-11. doi: 10.2174/1574891X12666170619101904. Recent Pat Antiinfect Drug Discov. 2018. PMID: 28625141 Review.
-
Bedaquiline: a new hope to treat multi-drug resistant tuberculosis.Curr Top Med Chem. 2014;14(16):1866-74. doi: 10.2174/1568026614666140929114822. Curr Top Med Chem. 2014. PMID: 25262806 Review.
Cited by
-
Correlative 3D imaging method for analysing lesion architecture in susceptible mice infected with Mycobacterium tuberculosis.Dis Model Mech. 2025 Sep 1;18(9):dmm052185. doi: 10.1242/dmm.052185. Epub 2025 Mar 26. Dis Model Mech. 2025. PMID: 40134379 Free PMC article.
-
Lightweight YOLOv4 with Multiple Receptive Fields for Detection of Pulmonary Tuberculosis.Comput Intell Neurosci. 2022 Mar 31;2022:9465646. doi: 10.1155/2022/9465646. eCollection 2022. Comput Intell Neurosci. 2022. PMID: 35401735 Free PMC article.
-
Fluorinated trehalose analogues for cell surface engineering and imaging of Mycobacterium tuberculosis.Chem Sci. 2024 Aug 12;15(34):13966-75. doi: 10.1039/d4sc00721b. Online ahead of print. Chem Sci. 2024. PMID: 39144457 Free PMC article.
-
Microenvironments of tuberculous granuloma: advances and opportunities for therapy.Front Immunol. 2025 Mar 24;16:1575133. doi: 10.3389/fimmu.2025.1575133. eCollection 2025. Front Immunol. 2025. PMID: 40196129 Free PMC article. Review.
-
The Iron Chelator Desferrioxamine Increases the Efficacy of Bedaquiline in Primary Human Macrophages Infected with BCG.Int J Mol Sci. 2021 Mar 13;22(6):2938. doi: 10.3390/ijms22062938. Int J Mol Sci. 2021. PMID: 33805837 Free PMC article.
References
Publication types
MeSH terms
Substances
Grants and funding
LinkOut - more resources
Full Text Sources
Medical
Research Materials

