. 2020 Dec 31;15(12):e0227462.
doi: 10.1371/journal.pone.0227462. eCollection 2020.

Scrambling the skin: A psychophysical study of adaptation to scrambled tactile apparent motion

Affiliations

Scrambling the skin: A psychophysical study of adaptation to scrambled tactile apparent motion

Tatjana Seizova-Cajic et al. PLoS One. .

Abstract

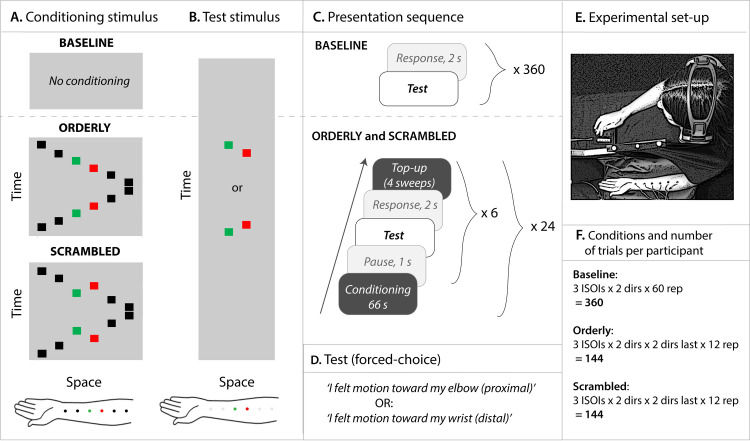
An age-old hypothesis proposes that object motion across the receptor surface organizes sensory maps (Lotze, 19th century). Skin patches learn their relative positions from the order in which they are stimulated during motion events. We propose that reversing the local motion within a global motion sequence ('motion scrambling') provides a good test for this idea, and present results of the first experiment implementing the paradigm. We used 6-point apparent motion along the forearm. In the Scrambled sequence, two middle locations were touched in reversed order (1-2-4-3-5-6, followed by 6-5-3-4-2-1, in a continuous loop). This created a double U-turn within an otherwise constant-velocity motion, as if skin patches 3 and 4 physically swapped locations. The control condition, Orderly, proceeded at constant velocity at inter-stimulus onset interval of 120 ms. The 26.4-minute conditioning (delivered in twenty-four 66-s bouts) was interspersed with testing of perceived motion direction between the two middle tactors presented on their own (sequence 3-4 or 4-3). Our twenty participants reported motion direction. Direction discrimination was degraded following exposure to Scrambled pattern and was 0.31 d' weaker than following Orderly conditioning (p = .007). Consistent with the proposed role of motion, this could be the beginning of re-learning of relative positions. An alternative explanation is that greater speed adaptation occurred in the Scrambled pattern, raising direction threshold. In future studies, longer conditioning should tease apart the two explanations: our re-mapping hypothesis predicts an overall reversal in perceived motion direction between critical locations (for either motion direction), whereas the speed adaptation alternative predicts chance-level performance at worst, without reversing.


Conflict of interest statement

The authors have declared that no competing interests exist.

Figures

Fig 1
Fig 1. An illustration of the idea that motion across a sensory surface informs about neighbourhood relationships.
Left panel: Units in a 2-D array (representing sensory neurons) have no ‘labels’ indicating their position in the array. Middle panel: Object motion proceeds in a sequence, activating units along its trajectory. Exposed to numerous motion events, adjacent localities will often be stimulated one after the other, as indicated by numerical sequences here. Right panel: As the outcome of this stimulation, units gain ‘labels’, i.e., the system gains information about their relative position in the array. Consider the central unit (labelled ‘0’ in the picture on the left): its first-degree neighbours are the units stimulated immediately before or after (labelled ‘I’); its second-degree neighbours (‘II’) are adjacent to its first-degree neighbours, etc. Each unit has a neighbourhood network (see a different unit depicted in the image on the right). Combination of these relationships makes a spatial map i.e., an array able to distinguish between different spatial configurations impinging on it.
Fig 2
Fig 2. Orderly and scrambled patterns of apparent motion across the skin.
Dots indicate touched locations. In both patterns, motion begins near the wrist and finishes near the elbow. They differ in the order of stimulation of the middle two skin patches only, as indicated by numbers. Grey arrows indicate direction of local stimulus motion i.e., motion between sequential stimulus pairs. Local motion has opposite direction to global motion in the middle of the motion trajectory in the Scrambled sequence.
Fig 3
Fig 3. Experiment design.
ISOI stands for Inter-Stimulus Onset Interval, P for proximal motion, and D for distal motion. ‘Last sweep’ refers to the last sweep in the conditioning sequence. See text for more details.
Fig 4
Fig 4. Details of the method.
A. Conditioning was used in the Orderly and Scrambled conditions, shown here as space-time diagrams. Time in arbitrary units is represented on the Y-axis, and space (along the forearm) on the X-axis. Duration of one back-and-forth sweep was approximately 1440 ms. The black and coloured squares represent position of vibrators used in these conditions. B. Test stimulus, presented as time-space diagram, was the same in all conditions. The coloured squares represent vibrators used in these conditions and grey squares, vibrators attached to the forearm but not used. C. Stimulus sequence consisted of conditioning, 1-s break, test, 2-s for response, top-up, followed by five more repeats of the test-response-top-up cycle. D. Forced-choice task used to judge motion direction in the test stimulus. E. Bird’s eye view of the experimental setup. Six vibrators were attached to participant’s left forearm throughout the experiment, occluded from participant’s view. White noise presented through headphones masked the sound of vibrators. The participant responded to test stimuli by pressing one of the two buttons on the response box. F. Conditions and number of trials per participant (‘dir’ stands for direction of the test stimulus, ‘dir last’ for the direction of the last conditioning sweep, and ‘rep’ for the number of repeats per condition). Vibrator placement, our second control variable, is not explicitly presented for simplicity; it is embedded in repeats, such that each of the vibrator orders was used in half of the repeats.
Fig 5
Fig 5. Sensitivity to motion direction, results.
Left panel. Box plots show medians and variability in d’ for 20 participants as a function of ISOI and Motion condition. Note (a) the advantage of Baseline at all ISOIs, (b) the advantage of Orderly over Scrambled at all ISOIs, and (c) a ceiling effect at 190 ms, most pronounced for Baseline. Right panel. Estimated marginal means from LMM analysis of Baseline-corrected results (d-prime values are negative because Baseline was superior to both Orderly and Scrambled). The fact that Scrambled stimulation produced higher negative d’ values indicates worse discrimination of direction compared to Orderly. See text for details.
Fig 6
Fig 6. Bias in judgments of motion direction.
A. Bias as a function of ISOI and Motion condition. Positive bias is tendency to report distal motion. Note that most medians are close to zero. B. Absolute values of bias, computed separately for each participant and condition. C. Baseline-corrected absolute bias for Orderly and Scrambled conditions, group means and linear functions estimated using linear mixed modelling. Note that the lines almost completely overlap, and that both Orderly and Scrambled conditions produced slightly more biased responses than Baseline.
Fig 7
Fig 7. Answers to the questionnaire designed to explore perception of the conditioning stimuli (medians and standard errors, n = 19).
To ensure participants were referring to the conditioning stimulus rather than test stimulus, the root question asked: ‘During the longer (1-min) period of stimulation, I felt…’).
Fig 8
Fig 8
Expected outcomes of long exposures to scrambled motion differ in case (A) of speed adaptation alone, which would simply deepen motion confusion found in the present study, and (B) of map change, in which case we expect motion reversals and locations swap.

References

    1. Herrnstein RJ, Boring EG. A Source Book in the History of Psychology Harvard University Press, 1965.
    1. Merzenich MM, Jenkins WM. Reorganization of cortical representations of the hand following alterations of skin inputs induced by nerve injury, skin island transfers, and experience. J Hand Ther. 1993;6(2):89–104. 10.1016/s0894-1130(12)80290-0 - DOI - PubMed
    1. Schweizer R, Braun C, Fromm C, Wilms A, Birbaumer N. The distribution of mislocalizations across fingers demonstrates training induced neuroplastic changes in somatosensory cortex. Exp Brain Res, 2001; 139: 435–442. 10.1007/s002210100793 - DOI - PubMed
    1. Tommerdahl M, Tannan V, Zachek M, Holden JK, Favorov O V. Effects of stimulus-driven synchronization on sensory perception. Behav Brain Funct. 2007;3:61 10.1186/1744-9081-3-61 - DOI - PMC - PubMed
    1. Darian-Smith. Plasticity of somatosensory function during learning, disease and injury In Gardner E, Kaas J, editors. The Senses (Vol. 6): Somatosensation, Elsevier, London, 2008.

Publication types