

SARS-CoV-2 PCR cycle threshold at hospital admission associated with patient mortality
- PMID: 33382805
- PMCID: PMC7774957
- DOI: 10.1371/journal.pone.0244777
SARS-CoV-2 PCR cycle threshold at hospital admission associated with patient mortality
Abstract
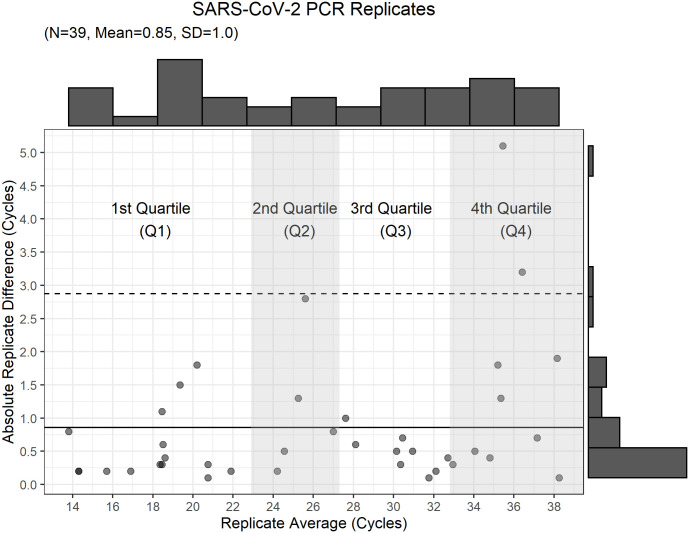
Background: Severe acute respiratory syndrome coronavirus 2 (SARS-CoV-2) cycle threshold (Ct) has been suggested as an approximate measure of initial viral burden. The utility of cycle threshold, at admission, as a predictor of disease severity has not been thoroughly investigated.
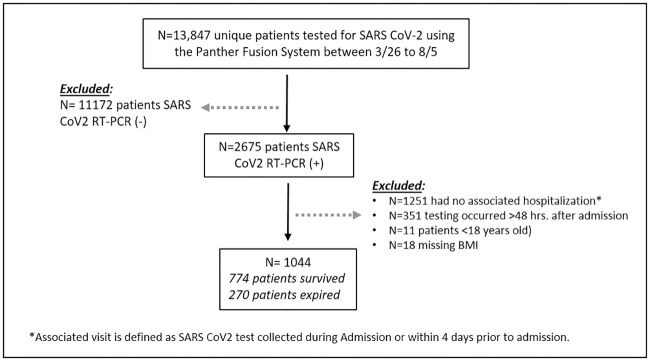
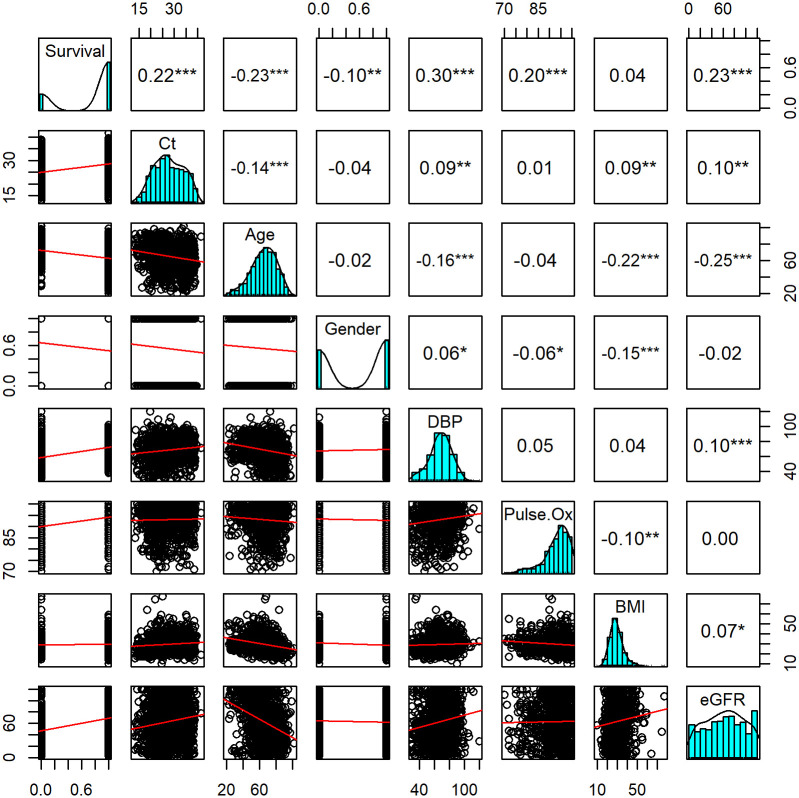
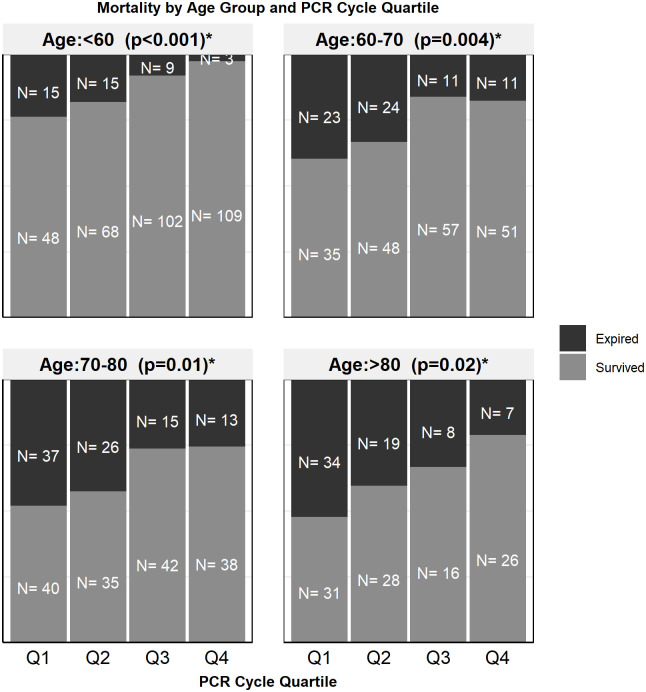
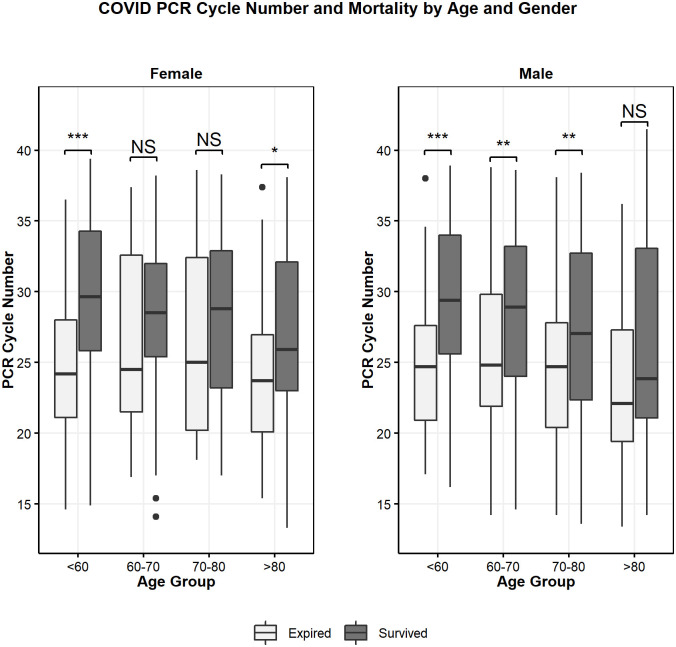
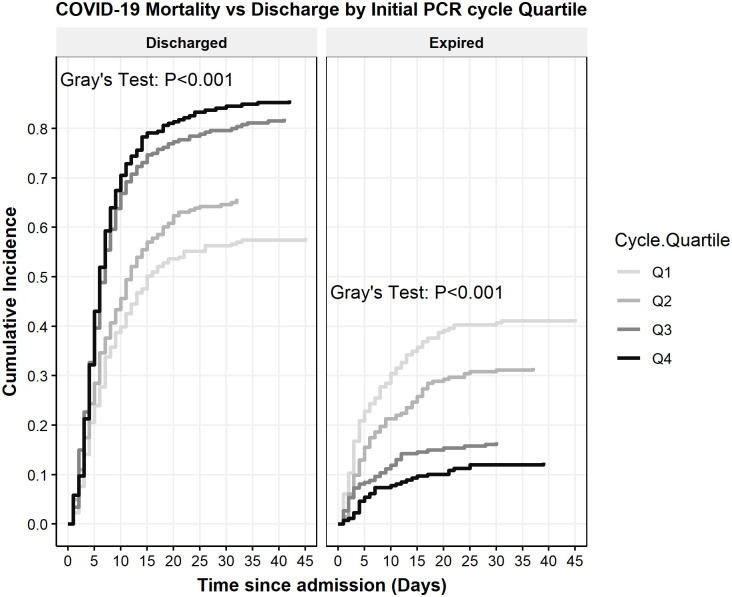
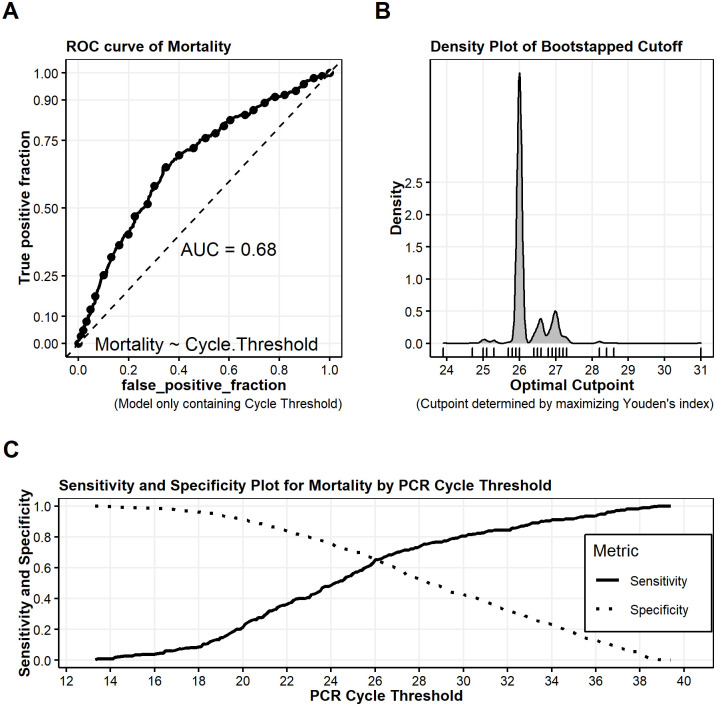
Methods and findings: We conducted a retrospective study of SARS-CoV-2 positive, hospitalized patients from 3/26/2020 to 8/5/2020 who had SARS-CoV-2 Ct data within 48 hours of admission (n = 1044). Only patients with complete survival data, discharged (n = 774) or died in hospital (n = 270), were included in our analysis. Laboratory, demographic, and clinical data were extracted from electronic medical records. Multivariable logistic regression was applied to examine the relationship of patient mortality with Ct values while adjusting for established risk factors. Ct was analyzed as continuous variable and subdivided into quartiles to better illustrate its relationship with outcome. Cumulative incidence curves were created to assess whether there was a survival difference in the setting of the competing risks of death versus patient discharge. Mean Ct at admission was higher for survivors (28.6, SD = 5.8) compared to non-survivors (24.8, SD = 6.0, P<0.001). In-hospital mortality significantly differed (p<0.05) by Ct quartile. After adjusting for age, gender, BMI, hypertension and diabetes, increased cycle threshold was associated with decreased odds of in-hospital mortality (0.91, CI 0.89-0.94, p<0.001). Compared to the 4th Quartile, patients with Ct values in the 1st Quartile (Ct <22.9) and 2nd Quartile (Ct 23.0-27.3) had an adjusted odds ratio of in-hospital mortality of 3.8 and 2.6 respectively (p<0.001). The discriminative ability of Ct to predict inpatient mortality was found to be limited, possessing an area under the curve (AUC) of 0.68 (CI 0.63-0.71).
Conclusion: SARS-CoV-2 Ct was found to be an independent predictor of patient mortality. However, further study is needed on how to best clinically utilize such information given the result variation due to specimen quality, phase of disease, and the limited discriminative ability of the test.
Conflict of interest statement
NO authors have competing interests.
Figures
References
-
- Organization WH. 2020 https://covid19.who.int/.
Publication types
MeSH terms
LinkOut - more resources
Full Text Sources
Other Literature Sources
Medical
Miscellaneous
