Observational Study
. 2020 Dec 31;15(12):e0244800.
doi: 10.1371/journal.pone.0244800. eCollection 2020.

Lack of elevated pre-ART elastase-ANCA levels in patients developing TB-IRIS

Affiliations
Observational Study

Lack of elevated pre-ART elastase-ANCA levels in patients developing TB-IRIS

Odin Goovaerts et al. PLoS One. .

Abstract

Background: Tuberculosis-associated immune reconstitution inflammatory syndrome (TB-IRIS) in HIV-TB co-infected patients receiving antiretroviral therapy (ART) has been linked to neutrophil activation. Anti-neutrophil cytoplasmic antibodies (ANCAs) are also associated with neutrophil activation. Since ANCAs are reportedly skewed in TB and HIV infections, we investigated plasma levels of 7 ANCAs in TB-IRIS patients.

Methods: We retrospectively compared 17 HIV-TB patients who developed TB-IRIS with controls of similar CD4 count, age and gender who did not (HIV+TB+ n = 17), HIV-infected patients without TB (HIV+TB-, n = 17) and 10 HIV-negative (HIV-TB-) controls. Frozen plasma was collected before ART, at 3 and 9 months of ART, and examined by ELISA for levels of 7 ANCAs directed against; Proteinase 3 (PR3), Myeloperoxidase (MPO), Permeability-increasing protein (BPI), Elastase, Cathepsin, Lysozyme, and Lactoferrin.

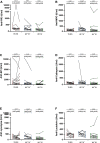
Results: Compared to HIV+TB+ controls, pre-ART anti-elastase levels were lower in TB-IRIS patients (p = 0.026) and HIV-TB- controls (p = 0.044), whereas other ANCAs did not show significant differences between groups at any time point. A significant decrease over time could be observed in TB-IRIS patients during ART for anti -PR3 (p = 0.027), -lysozyme (p = 0.011), and -lactoferrin (p = 0.019). Conversely, HIV+TB+ controls showed a significant decrease over time for anti -MPO (p = 0.002), -lyzosyme (p = 0.002) and -elastase (p < 0.001).

Conclusion: The lack of elevated anti-elastase levels in TB-IRIS patients as opposed to HIV+TB+ controls correspond to previous findings of lowered immune capacity in patients that will develop TB-IRIS. This may suggest a specific role for anti-elastase, elastase or even matrix-metalloproteinases in TB-IRIS. The precise dynamics of neutrophil activation in HIV-TB merits further investigation and could provide more insight in the early mechanisms leading up to TB-IRIS.


Conflict of interest statement

The authors have declared that no competing interests exist.

Figures

Fig 1
Fig 1. Plasma levels of anti-elastase in TB-IRIS patients and controls.
Graphs show a comparison between groups (A), as well as changes over time for individual patients (B) in the median plasma levels of anti-elastase (U/ml) measured prior to ART, and at 3 months and 9 months of ART. Significant overall differences between TB-IRIS patients (red circles), HIV+TB+ (blue triangles), HIV+TB- (green squares), and HIV-TB- (yellow hexagons) controls were calculated using Kruskal-Wallis tests, with Dunn’s post-hoc test shown as capped lines to highlight specific differences between individual groups (A). Significant variation over time was calculated for each group using Friedman tests, with Dunn’s post-hoc test shown as capped lines to highlight specific differences between individual time points (B). Out of 17 TB-IRIS patients with samples available pre-ART, only 11 had samples available at both month 3 and month 9. The total number of patients analysed over time was thus 11 for each group. Analysis were performed between all groups at each time point, and between every time points for each group with the level of significance was set to P < 0.05. Non-significant p-values have been omitted from the graphs. Overall Kruskal-Wallis p-value was ap = 0.009 and overall Friedman p-value was bp ≤ 0.001.
Fig 2
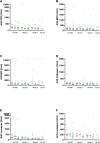
Fig 2. Plasma levels of other ANCAs in TB-IRIS patients and controls.
Graphs show a comparison between TB-IRIS patients (red circles), HIV+TB+ (blue triangles), HIV+TB- (green squares), and HIV-TB- (yellow hexagons) in the median plasma levels of anti- PR3 (A), -MPO (B), -BPI (C), -cathepsin (D), -lysozyme (E), and -lactoferin (F) (U/ml) measured prior to ART, and at 3 months and 9 months of ART. Analysis were performed between all groups at each time point using Kruskal-Wallis tests, with Dunn’s post-hoc test, and the level of significance set to P < 0.05. Non-significant p-values have been omitted from the graphs, as no significant values were observed.
Fig 3
Fig 3. Plasma levels of other ANCAs over time in TB-IRIS patients and controls.
Graphs show changes over time for individual patients in the median plasma levels of anti- PR3 (A), -MPO (B), -BPI (C), -cathepsin (D), -lysozyme (E), and -lactoferrin (F) (U/ml) measured prior to ART, and at 3 months and 9 months of ART. Significant variation over time in TB-IRIS patients (red circles), HIV+TB+ (blue triangles), and HIV+TB- (green squares) controls was calculated for each group using Friedman tests, with Dunn’s post-hoc test shown as capped lines to highlight specific differences between individual time points. Out of 17 TB-IRIS patients with samples available pre-ART, only 11 had samples available at both month 3 and month 9. The total number of patients analysed over time was thus 11 for each group. No variation over time was calculated for HIV-TB- controls, since only 1 time point was available. Analysis were performed between all groups at each time point, and between every time points for each group with the level of significance was set to P < 0.05. Overall Friedman p-values were ap = 0.027, bp = 0.002, cp = 0.011, dp = 0.002, ep = 0.019.

References

    1. Meintjes G, Lawn SD, Scano F, Maartens G, French MA, Worodria W, et al. Tuberculosis-associated immune reconstitution inflammatory syndrome: case definitions for use in resource-limited settings. Lancet Infect.Dis. pp. 516–523. 10.1016/S1473-3099(08)70184-1 - DOI - PMC - PubMed
    1. Müller M, Wandel S, Colebunders R, Attia S, Furrer H, Egger M. Immune reconstitution inflammatory syndrome in patients starting antiretroviral therapy for HIV infection: a systematic review and meta-analysis. Lancet Infect Dis. 2010;10: 251–61. 10.1016/S1473-3099(10)70026-8 - DOI - PMC - PubMed
    1. Barber DL, Andrade BB, Sereti I, Sher A. Immune reconstitution inflammatory syndrome: the trouble with immunity when you had none. Nat Rev Microbiol. Nature Publishing Group; 2012;10: 150–6. 10.1038/nrmicro2712 - DOI - PMC - PubMed
    1. Murdoch DM, Venter WDF, Van Rie A, Feldman C. Immune reconstitution inflammatory syndrome (IRIS): review of common infectious manifestations and treatment options. AIDS Res Ther. 2007;4: 9 10.1186/1742-6405-4-9 - DOI - PMC - PubMed
    1. Burman W, Weis S, Vernon A, Khan A, Benator D, Jones B, et al. Frequency, severity and duration of immune reconstitution events in HIV-related tuberculosis SUMMARY. 2007;11: 1282–1289. - PubMed

Publication types

MeSH terms

Substances