Comparative Study
. 2021 May;14(3):1049-1061.
doi: 10.1111/cts.12969. Epub 2021 Apr 3.

Characterizing the reproducibility in using a liver microphysiological system for assaying drug toxicity, metabolism, and accumulation

Affiliations
Comparative Study

Characterizing the reproducibility in using a liver microphysiological system for assaying drug toxicity, metabolism, and accumulation

Andrés Rubiano et al. Clin Transl Sci. 2021 May.

Abstract

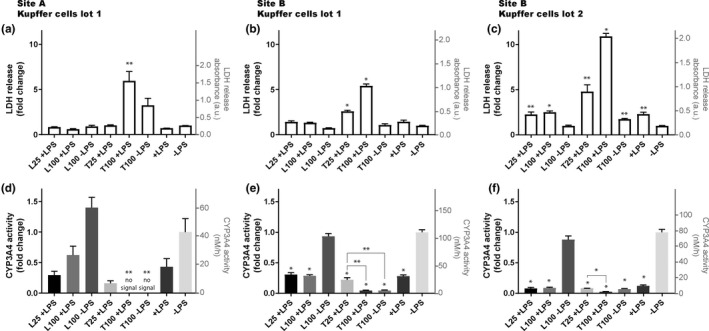
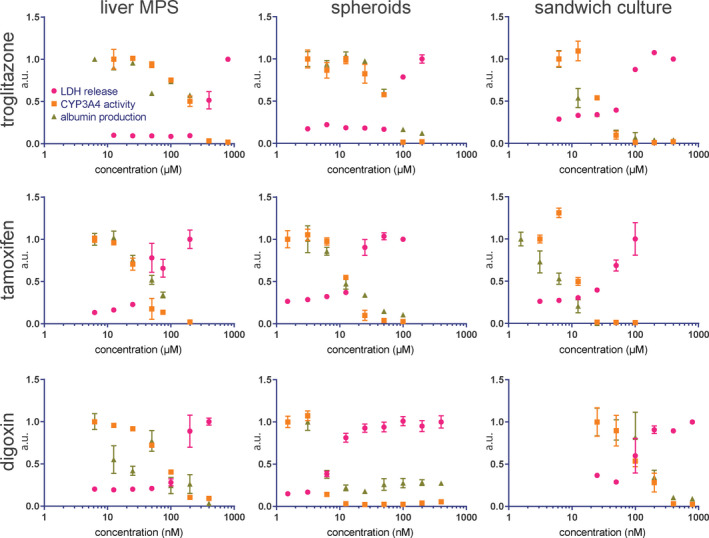
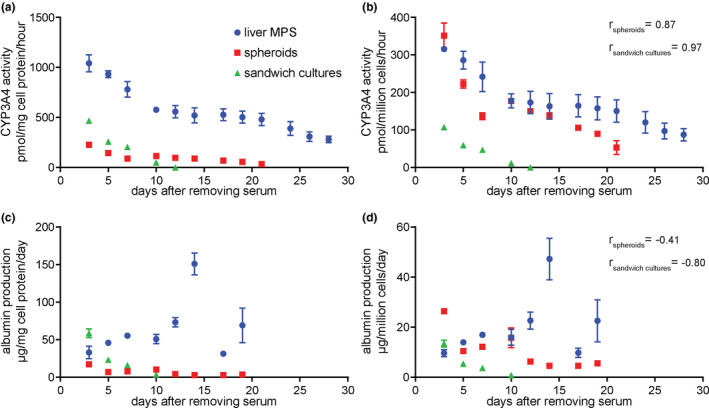
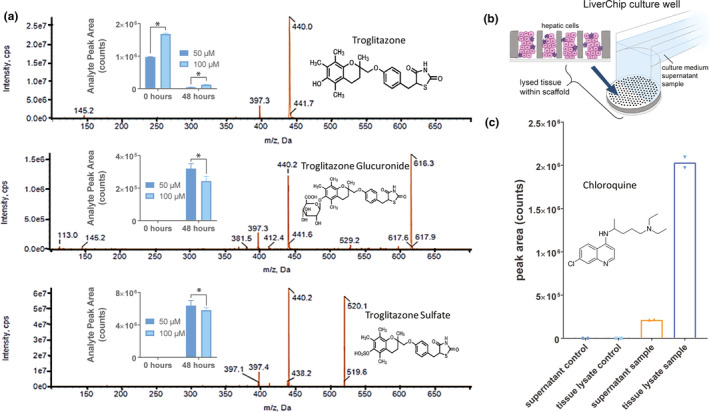
Liver microphysiological systems (MPSs) are promising models for predicting hepatic drug effects. Yet, after a decade since their introduction, MPSs are not routinely used in drug development due to lack of criteria for ensuring reproducibility of results. We characterized the feasibility of a liver MPS to yield reproducible outcomes of experiments assaying drug toxicity, metabolism, and intracellular accumulation. The ability of the liver MPS to reproduce hepatotoxic effects was assessed using trovafloxacin, which increased lactate dehydrogenase (LDH) release and reduced cytochrome P450 3A4 (CYP3A4) activity. These observations were made in two test sites and with different batches of Kupffer cells. Upon culturing equivalent hepatocytes in the MPS, spheroids, and sandwich cultures, differences between culture formats were detected in CYP3A4 activity and albumin production. Cells in all culture formats exhibited different sensitivities to hepatotoxicant exposure. Hepatocytes in the MPS were more functionally stable than those of other culture platforms, as CYP3A4 activity and albumin secretion remained prominent for greater than 18 days in culture, whereas functional decline occurred earlier in spheroids (12 days) and sandwich cultures (7 days). The MPS was also demonstrated to be suitable for metabolism studies, where CYP3A4 activity, troglitazone metabolites, diclofenac clearance, and intracellular accumulation of chloroquine were quantified. To ensure reproducibility between studies with the MPS, the combined use of LDH and CYP3A4 assays were implemented as quality control metrics. Overall results indicated that the liver MPS can be used reproducibly in general drug evaluation applications. Study outcomes led to general considerations and recommendations for using liver MPSs. Study Highlights WHAT IS THE CURRENT KNOWLEDGE ON THE TOPIC? Microphysiological systems (MPSs) have been designed to recreate organ- or tissue-specific characteristics of extracellular microenvironments that enhance the physiological relevance of cells in culture. Liver MPSs enable long-lasting and stable culture of hepatic cells by culturing them in three-dimensions and exposing them to fluid flow. WHAT QUESTION DID THIS STUDY ADDRESS? What is the functional performance relative to other cell culture platforms and the reproducibility of a liver MPS for assessing drug development and evaluation questions, such as toxicity, metabolism, and pharmacokinetics? WHAT DOES THIS STUDY ADD TO OUR KNOWLEDGE? The liver MPS systematically detected the toxicity of trovafloxacin. When compared with spheroids and sandwich cultures, this system had a more stable function and different sensitivity to troglitazone, tamoxifen, and digoxin. Quantifying phase II metabolism of troglitazone and intracellular accumulation of chloroquine demonstrated the potential use of the liver MPS for studying drug metabolism and pharmacokinetics. Quality control criteria for assessing chip function were key for reliably using the liver MPS. HOW MIGHT THIS CHANGE CLINICAL PHARMACOLOGY OR TRANSLATIONAL SCIENCE? Due to its functional robustness and physiological relevance (3D culture, cells expose to fluid flow and co-culture of different cell types), the liver MPS can, in a reproducible manner: (i) detect inflammatory-induced drug toxicity, as demonstrated with trovafloxacin, (ii) detect the toxicity of other drugs, such as troglitazone, tamoxifen, and digoxin, with different effects than those detected in spheroids and sandwich cultures, (iii) enable studies of hepatic function that rely on prolonged cellular activity, and (iv) detect phase II metabolites and drug accumulation to potentially support the interpretation of clinical data. The integration of MPSs in drug development will be facilitated by careful evaluation of performance and reproducibility as performed in this study.


Conflict of interest statement

Dr. Hughes owns stock in and is employed by CN Bio Innovations. Dr. Kostrzewski is employed by CN Bio Innovations. Ms. Miedzik was employed by CN Bio Innovations. All other authors declared no competing interests for this work.

Figures

Figure 1
Figure 1
Toxic effects of trovafloxacin detected with PHHs co‐cultured with PHKCs in the liver MPS in two different experimental sites and using two validated lots of PHKCs. Site A was CN Bio Innovations in Cambridge, UK, and site B was FDA laboratories in Silver Spring, MD, USA. Trovafloxacin (T) and levofloxacin (L) were added to the cell culture medium of the liver MPS at a concentration of 25 or 100 µM in the presence (+) or absence (−) of lipopolysaccharide (LPS) at a concentration of 1 µg/ml to activate PHKCs. After 2 days of exposure, cell death was estimated by measuring LDH (a–c) and CYP3A4 activity (d–f) in the cell culture medium. Boxes represent average values and error bars represent the SEM. Identical lots of PHHs and PHKCs were used between site A (a, d) and site B (b, e). A separate lot of PHKCs was also used in site B (c, f). For each panel, *p < 0.005 and **p < 0.05 by unpaired t‐test with Welch’s correction. * and ** above column indicate statistical significance of difference relative to the control ‐LPS. Unless indicated otherwise, differences between values for presented conditions are not statistically different from the control ‐LPS. For (e) and (f), the statistical significance of differences between values of T25 +LPS condition and other conditions are also presented, such as T100 +LPS (e, f) and T100 ‐LPS (e). Three different wells were used per condition, except for experiments performed in site A, where 4 wells were used for condition L100 +LPS and T100 +LPS. LDH, lactate dehydrogenase; MPS, microphysiological system; PHHs, primary human hepatocytes; PHKCs, primary human Kupffer cells
Figure 2
Figure 2
LDH release (pink circles), CYP34A activity (orange squares), and albumin production (green triangles) responses to 48 h of exposure to a range of concentrations of troglitazone, tamoxifen, and digoxin, in all 3 platforms: liver MPS, spheroid, and sandwich culture. All concentration ranges cover approximately three orders of magnitude, and upper and lower concentration limits were selected to encompass the half‐maximal inhibitory concentration for all three responses in each platform‐drug condition. Responses were normalized to the recorded value for the lowest drug concentration (highest, for LDH) and presented as a decimal value in arbitrary units. Each data point represents the average of three biological replicates, and error bars indicate the SEM, not presented if shorter than the size of the symbol. Results of three technical replicates from one MPS well are presented for 800 µM troglitazone. Results of three technical replicates of albumin measurements from one MPS well are presented for 6.25 nM digoxin. LDH, lactate dehydrogenase; MPS, microphysiological system
Figure 3
Figure 3
Hepatic function lasts longer and is more stable when cells are cultured in the liver MPS than when cultured as spheroids or sandwich cultures. PHHs were cultured in the liver MPS, within spheroids and as sandwich cultures and the function of these platforms was analyzed. (a, b) Average CYP3A4 activity was measured for each culture platform at discrete times and (a) normalized to the total protein of cellular material or (b) normalized to the number of cells used for each platform. (c, d) Albumin production at different times and (c) divided by the total cellular protein lysed from platforms and the number of days between media changes or (d) divided by the used number of cells and the number of days between media changes. Three wells of the liver MPS, three spheroids, and six wells with sandwich cultures were analyzed. Error bars correspond to SEM and are not presented if shorter than the size of the symbol. One‐way ANOVA was performed to evaluate the variance between means up to 10 days of culture. For CYP3A4 activity (b), ANOVA pvalue was 0.022 for liver MPS, < 0.0001 for spheroids and < 0.0001 for sandwich cultures. For albumin production (d), p value was 0.1 for the liver MPS, 0.002 for spheroids, and < 0.0001 for sandwich cultures. Correlation parameter r calculated from nonparametric Spearman correlation test relative to functional variations in the liver MPS is presented in (b) and (d) for functional variations of spheroids (r spheroids) and sandwich cultures (r sandwich cultures). ANOVA, analysis of variance; MPS, microphysiological system; PHHs, primary human hepatocytes
Figure 4
Figure 4
Application of liver MPS to drug metabolism and pharmacokinetics studies. (a) Detection of phase II metabolites of troglitazone: troglitazone glucuronide and troglitazone sulfate. Culture medium containing 50 or 100 µM of troglitazone was added to 3 wells per concentration of the liver MPS and maintained for 2 days to be metabolized. Troglitazone and metabolites in the medium were detected with liquid chromatography–mass spectrometry before and after being added to the liver MPS. *p < 0.03 by the unpaired Mann‐Whitney nonparametric test. Error bars correspond to SD. (b) In addition to analyzing the supernatant culture medium in the liver MPS, cells within scaffolds were lysed to evaluate intra‐tissue accumulation of drugs. (c) Culture medium containing 31.5 µM of chloroquine was added to 2 wells of a liver MPS and incubated for 2 days to measure its intra‐tissue accumulation with liquid chromatography–mass spectrometry after digesting the cell‐containing scaffolds. For both samples, a 10‐fold higher concentration of chloroquine was observed in the tissue lysate relative to the supernatant sample. MPS, microphysiological system
Figure 5
Figure 5
Assessing LDH production and CYP3A4 activity as quality control measures for individual wells. Before changing the cell culture medium on day 4 of operation after seeding cells, LDH was assayed in medium collected from each well (a) and CYP3A4 activity (b) was measured to evaluate the quality of cellular function in the wells of a liver MPS plate. Error bars represent the SD of three measured technical replicates. *0.05 < p < 0.02 and **0.02 < p < 0.002 and ***p < 0.002 by unpaired t‐test with Welch’s correction. *, **, and *** above the presented data sets indicate statistical significance of difference in LDH or CYP3A4 production relative to the mean of values from well B1. Unless indicated otherwise, presented mean values were not statistically different from the mean values obtained from well B1. (c) Each scaffold corresponding to a liver MPS well was imaged with brightfield microscopy after being removed from the plate. Scale bar represents a length of 1 mm. For gene expression analysis (d, e), Qiagen’s RT2 Profiler PCR Array for Human Drug Metabolism was used to assess a panel of 84 genes involved in drug metabolism. Sample B6 was excluded from the gene expression analysis for having a lower yield than required by the assay. The mean of the five least variant targets on the panel array was used as the endogenous control value for the denominator of the normalized Ct values (ΔCt) calculation. (d) Hierarchical clustering plot of gene expression. Heat map represents ΔCt of expression of a panel of genes (rows) for each isolated scaffold (columns). Euclidean distance and average linkage were used as parameters for the clustering. (e) Principal component plot from software CLC Genomics Workbench (Qiagen) depicting the projection of the samples onto a two‐dimensional space spanned by the first and second principal component of the covariance matrix. Box plot inside of main plot presents the distribution of ΔCt values. LDH, lactate dehydrogenase; MPS, microphysiological system; n.s. indicates not significant

Similar articles

Cited by

References

    1. Ribeiro AJS, Yang X, Patel V, Madabushi R, Strauss DG. Liver microphysiological systems for predicting and evaluating drug effects. Clin Pharmacol Ther. 2019;106:139‐147. - PMC - PubMed
    1. Baudy AR, Otieno MA, Hewitt P, et al. Liver microphysiological systems development guidelines for safety risk assessment in the pharmaceutical industry. Lab Chip. 2020;20:215‐225. - PubMed
    1. Fowler S, Chen WLK, Duignan DB, et al. Microphysiological systems for ADME‐related applications: current status and recommendations for system development and characterization. Lab Chip. 2020;20:446‐467. - PubMed
    1. Beckwitt CH, Clark AM, Wheeler S, et al. Liver ‘organ on a chip'. Exp Cell Res. 2018;363:15‐25. - PMC - PubMed
    1. Isoherranen N, Madabushi R, Huang SM. Emerging role of organ‐on‐a‐chip technologies in quantitative clinical pharmacology evaluation. Clin Transl Sci. 2019;12:113‐121. - PMC - PubMed

Publication types

Substances

LinkOut - more resources