

A target-mediated drug disposition population pharmacokinetic model of GC1118, a novel anti-EGFR antibody, in patients with solid tumors
- PMID: 33382918
- PMCID: PMC8212746
- DOI: 10.1111/cts.12963
A target-mediated drug disposition population pharmacokinetic model of GC1118, a novel anti-EGFR antibody, in patients with solid tumors
Abstract
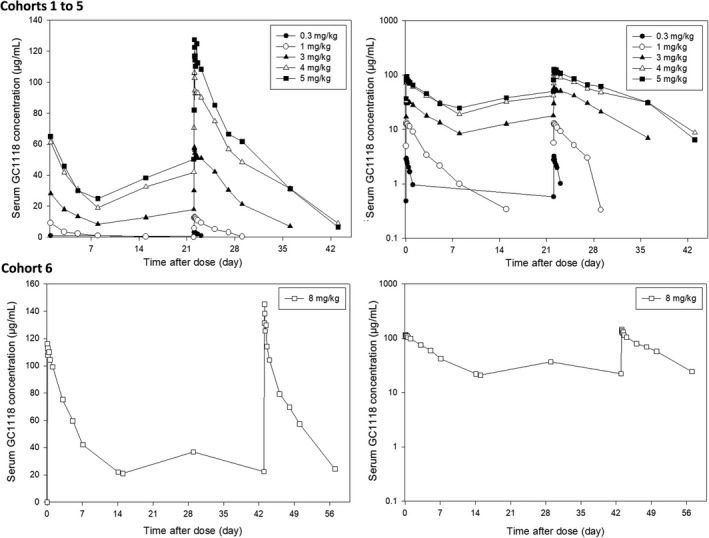
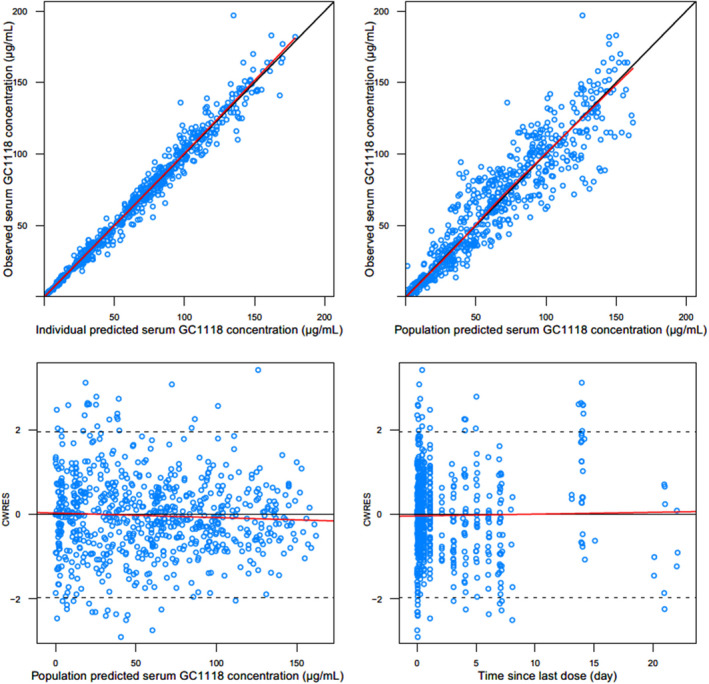
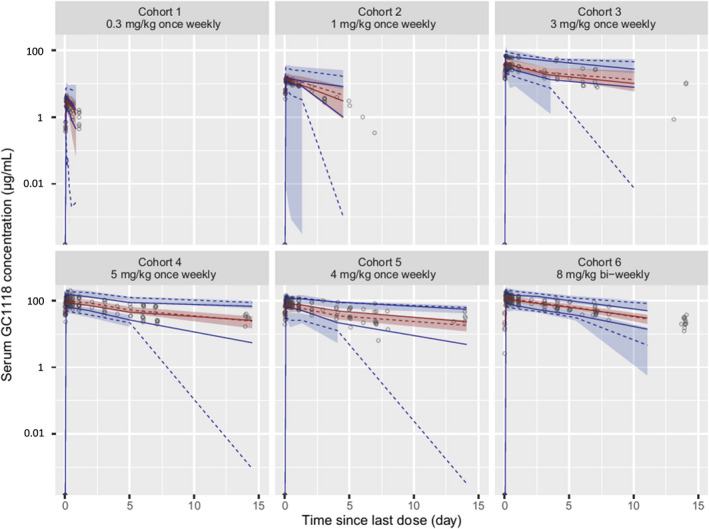
GC1118 is a monoclonal antibody for epidermal growth factor receptor (EGFR) that is currently under clinical development to treat patients with solid tumors. In this study, the pharmacokinetics (PKs) of GC1118 were modeled in solid tumor patients who received a 2-h intravenous infusion of GC1118 at 0.3, 1, 3, 5, or 4 mg/kg once-weekly (Q1W) on days 1, 8, 15, and 22 or 8 mg/kg every other week on days 1 and 15. A target-mediated drug disposition population PK model adequately described the concentration-time profiles of GC1118. Monte-Carlo simulation experiments of the PK profiles and EGFR occupancies (ROs) by GC1118 based on the final model showed that Q1W at 4 or 5 mg/kg will produce a better antitumor effect than Q2W at 8 mg/kg. Because GC1118 was safer at 4 mg/kg than 5 mg/kg in the phase I study, we suggest to test the 4 mg/kg Q1W regimen in further clinical trials with GC1118. Study Highlights WHAT IS THE CURRENT KNOWLEDGE ON THE TOPIC? GC1118, a fully human IgG1 monoclonal antibody (mAb) for epidermal growth factor receptor (EGFR), showed a nonlinear pharmacokinetic (PK) profile in monkeys and humans. The total clearance of GC1118 decreased as the dose was increased up to 3-4 mg/kg in humans, beyond which it remained stable. The recommended phase II dose for GC1118 was 4 mg/kg intravenously infused over 2 h once weekly. WHAT QUESTION DID THIS STUDY ADDRESS? We developed a target-mediated drug disposition (TMDD) population PK model that described the nonlinear PK profile of GC1118 in patients with solid tumors. We also simulated the PK profiles and receptor occupancies for different dosage regimens. WHAT DOES THIS STUDY ADD TO OUR KNOWLEDGE? The TMDD population PK model adequately described the nonlinear and multiphasic PK profiles of GC1118 in humans. The simulation experiment showed that once-weekly GC1118 at 4-5 mg/kg could be more efficacious than the biweekly regimen at 8 mg/kg. HOW MIGHT THIS CHANGE CLINICAL PHARMACOLOGY OR TRANSLATIONAL SCIENCE? The pharmacometrics analysis could support better informed drug development decisions for GC1118, particularly for determining an optimal dosage regimen.
© 2020 The Authors. Clinical and Translational Science published by Wiley Periodicals LLC on behalf of the American Society for Clinical Pharmacology and Therapeutics.
Conflict of interest statement
Ahmi Woo and Su Jin Lee are employees of GC Pharma, Yongin, Korea. All other authors declared no competing interests for this work.
Figures


References
-
- Yewale C, Baradia D, Vhora I, Patil S, Misra A. Epidermal growth factor receptor targeting in cancer: a review of trends and strategies. Biomaterials. 2013;34(34):8690‐8707. - PubMed
-
- Voldborg BR, Damstrup L, Spang‐Thomsen M, Poulsen HS. Epidermal growth factor receptor (EGFR) and EGFR mutations, function and possible role in clinical trials. Ann Oncol. 1997;8(12):1197‐1206. - PubMed
-
- Dassonville O, Bozec A, Fischel JL, Milano G. EGFR targeting therapies: monoclonal antibodies versus tyrosine kinase inhibitors. Similarities and differences. Crit Rev Oncol Hematol. 2007;62(1):53‐61. - PubMed
Publication types
MeSH terms
Substances
LinkOut - more resources
Full Text Sources
Other Literature Sources
Medical
Research Materials
Miscellaneous
