. 2021 Jan-Dec;13(1):1-16.
doi: 10.1080/19490976.2020.1849997.

Enteral broad-spectrum antibiotics antagonize the effect of fecal microbiota transplantation in preterm pigs

Affiliations

Enteral broad-spectrum antibiotics antagonize the effect of fecal microbiota transplantation in preterm pigs

Anders Brunse et al. Gut Microbes. 2021 Jan-Dec.

Abstract

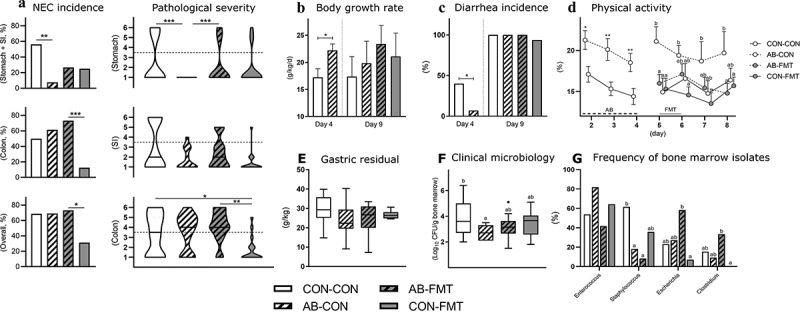
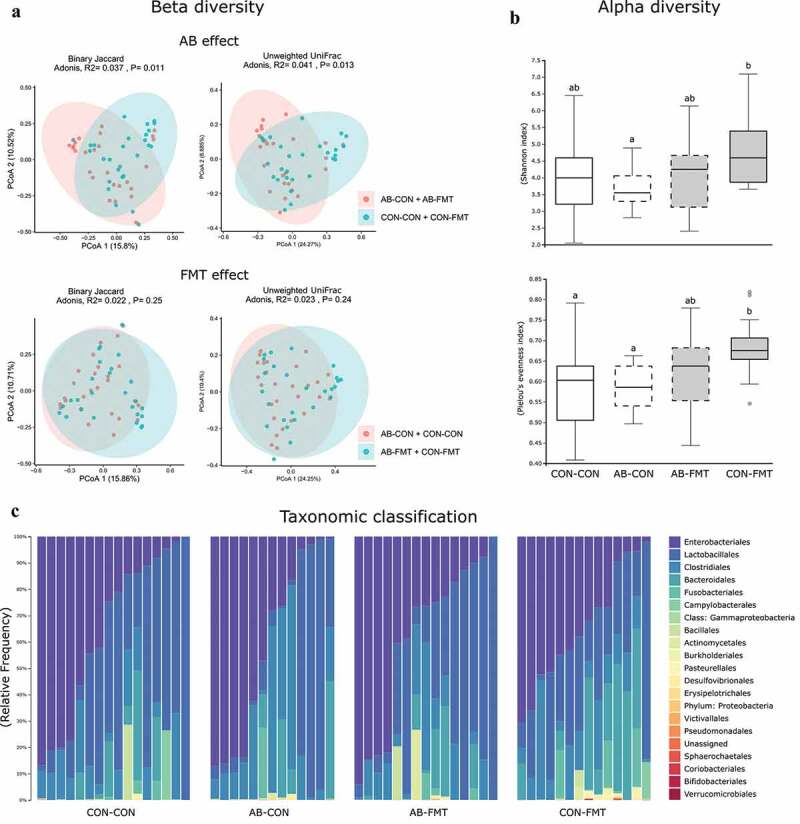
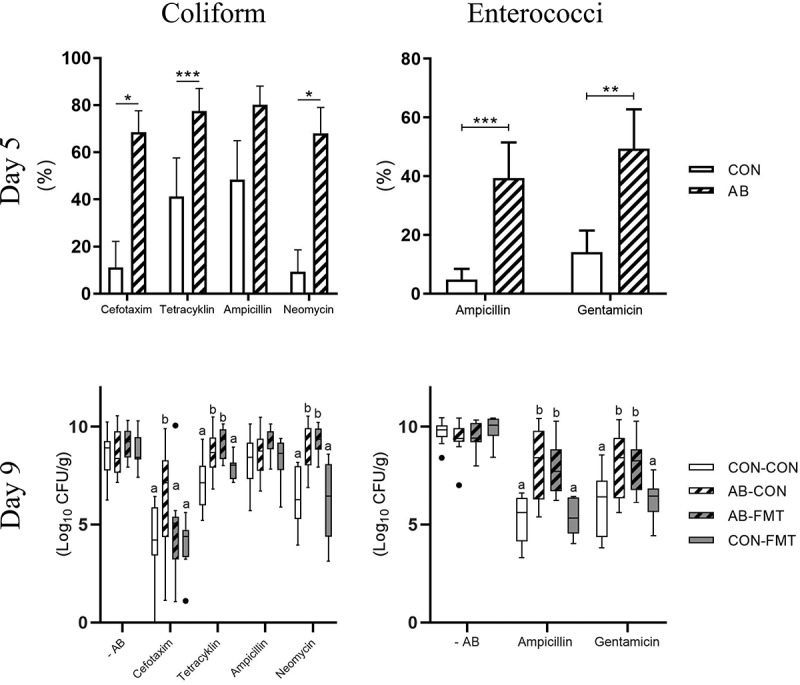
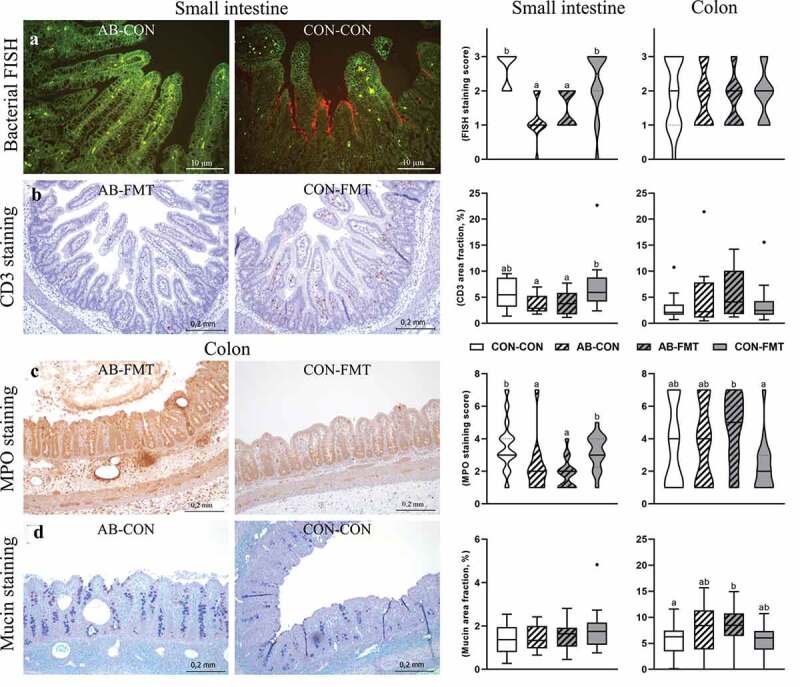
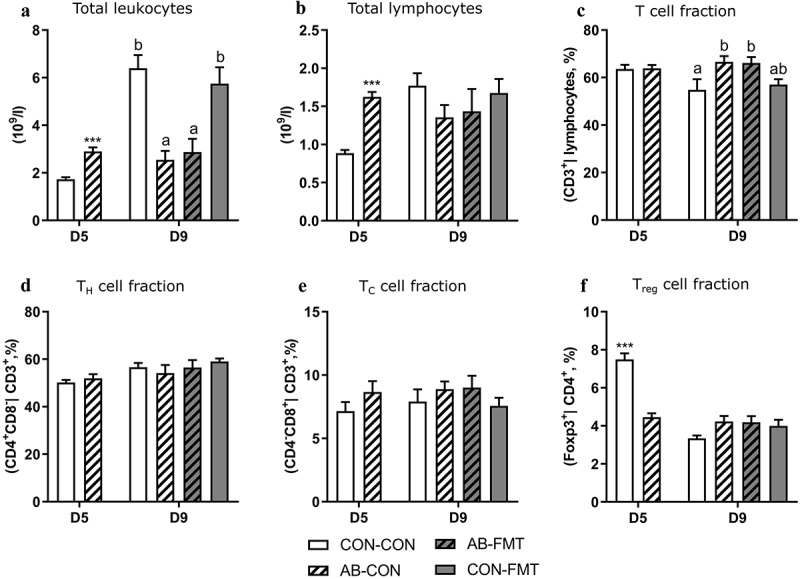
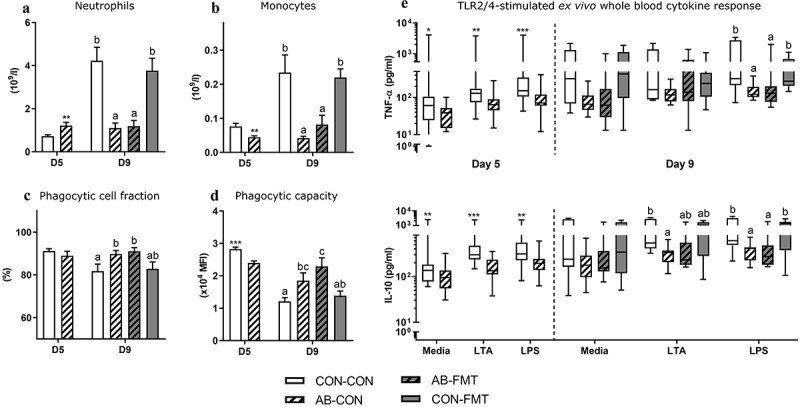
Preterm infants are at risk of multiple morbidities including necrotizing enterocolitis (NEC). Suspected NEC patients receive intravenous antibiotics (AB) to prevent sepsis, although enteral AB is arguably more effective at reducing NEC but is rarely used due to the risk of AB resistance. Fecal microbiota transplantation (FMT) has shown protective effects against NEC in animal experiments, but the interaction between AB and FMT has not been investigated in neonates. We hypothesized that administration of enteral AB followed by rectal FMT would effectively prevent NEC with negligible changes in AB resistance and systemic immunity. Using preterm piglets, we examined host and gut microbiota responses to AB, FMT, or a sequential combination thereof, with emphasis on NEC development. In a saline-controlled experiment, preterm piglets (n = 67) received oro-gastric neomycin (50 mg/kg/d) and amoxicillin-clavulanate (50/12.5 mg/kg/d) (hereafter AB) for four days after cesarean delivery, and were subsequently given rectal FMT from healthy suckling piglet donors. Whereas AB protected the stomach and small intestine, and FMT primarily protected the colon, the sequential combination treatment surprisingly provided no NEC protection. Furthermore, minor changes in the gut microbiota composition were observed in response to either treatment, although AB treatment decreased species diversity and increased AB resistance among coliform bacteria and Enterococci, which were both partly reversed by FMT. Besides, enteral AB treatment suppressed cellular and functional systemic immune development, which was not prevented by subsequent FMT. We discovered an antagonistic relationship between enteral AB and FMT in terms of NEC development. The outcome may depend on choice of AB compounds, FMT composition, doses, treatment duration, and administration routes, but these results challenge the applicability of enteral AB and FMT in preterm infants.

Keywords: Gut microbiota; antibiotics; antibiotics resistance; fecal microbiota transplantation; immunity; necrotizing enterocolitis; prematurity.


Figures

Figure 1.
Figure 1.
Enteral broad-spectrum antibiotics abolish the clinical effect of fecal microbiota transplantation. (a). NEC incidences (left panels) and lesion severities (right panels) in stomach, small intestine (SI) and colon by macroscopic pathological evaluation. Dotted horizontal lines specify the criteria for NEC diagnosis (score > 3). (b-d). Growth rate, diarrhea and in-cage physical activity. (e). Stomach emptying rate expressed as gastric residual volume after a timed standardized feeding bolus. (f-g). Bone marrow total bacterial density and frequencies of dominant isolates summarized at genus level. Ordinal data (NEC scores) is presented as violin plots with the solid horizontal line denoting the median value. Continuous data is presented as bar plots using means and standard error if normally distributed or otherwise using box plots with median and Tukey whiskers. n = 13–16 per group for all analyses. For two-group comparisons before day 5, *, ** and *** denote probability values of 0.05, 0.01 and 0.001. For four-group comparisons on day 9, data not sharing the same superscript letter are significantly different at p < .05
Figure 2.
Figure 2.
Minor effects of enteral broad-spectrum antibiotics and fecal microbiota transplantation on gut microbiota composition. (a). Dissimilarity plots based on 16S rRNA gene amplicon sequencing data, visualizing differences in beta diversity of the colonic microbiota after AB (upper) and FMT (lower) treatment using Jaccard (left) and Unweighted UniFrac distances (right). (b). Shannon and Pielou’s evenness indices as measures of alpha diversity (data not sharing the same superscript letter are significantly different at p < .05). (c). Relative colonic bacterial abundance presented as stacked bar graphs summarized at order level of taxonomic classification. n = 13–16 per group for all analyses
Figure 3.
Figure 3.
Fecal microbiota transplantation reduces antibiotics-induced cefotaxime resistance. Antibiotics resistant coliform bacteria (left, MacConkey agar) and enterococci (right, Slanetz-Bartley agar) on day 5, shortly after AB discontinuation (upper, presented as frequency of antibiotics resistant colony-forming units) and day 9, after subsequent FMT treatment (lower, presented as total number of antibiotics resistant colony-forming units). n = 9–16 per group. Continuous data are presented as bar plots using means and standard error if normally distributed or otherwise using box plots with median and Tukey whiskers. For two-group comparisons on day 5, *, ** and *** denote probability values of 0.05, 0.01 and 0.001. For four-group comparisons on day 9, data not sharing the same superscript letter are significantly different at p < .05
Figure 4.
Figure 4.
Enteral broad-spectrum antibiotics reduce small intestinal bacterial adhesion and mucosal immune cell densities. (a). Representative micrographs of AB-CON (left) and CON-CON (right) bacterial FISH stained small intestines. FISH stained tissue (small intestine and colon) was evaluated using an ordinal density grading system (score 0–3). (b). Representative micrographs of CD3 stained small intestines from AB-FMT (left) and CON-FMT (right) animals. The relative area of CD3 chromogenic signal in small intestines and colon was quantified by image analysis. (c). Representative micrographs of MPO stained colon from the AB-FMT group (left) and CON-FMT (right). Most AB-FMT tissue sections presented with MPO positive immune cell aggregates, pneumatosis intestinalis and submucosal thickening, whereas the majority of CON-FMT tissue sections had normal appearance. MPO stained tissue was evaluated using a composite ordinal grading system (0–7) consisting of MPO cell density (score 1–3) and severity/extent of MPO-associated mucosa inflammation (score 0–4). D. Representative micrographs of mucin stained colonic tissue using AB-PAS histochemistry showing AB-CON (left) and CON-CON (right) groups. The relative mucin stained area was quantified using image analysis. Ordinal data is presented as violin plots with median (solid line) and interquartile range (dotted line). Continuous data is presented as box plots showing medians and Tukey whiskers. n = 12–16 per group. Data not sharing the same letter are significantly different at p < .05. AB-PAS, Alcian Blue-Periodic acid-Schiff; MPO, myeloperoxidase; FISH, fluorescent in situ hybridization
Figure 5.
Figure 5.
Enteral broad-spectrum antibiotics attenuate blood lymphocyte dynamics. (a-b). Total blood leukocyte and lymphocyte counts. (c-f). Frequency of T cells (CD3+ lymphocytes), TH cells (CD3+CD4+CD8 lymphocytes), TC cells (CD3+CD4CD8+ lymphocytes) and Treg cells (CD3+CD4+Foxp3+ lymphocytes). Data are presented as means with standard errors. n = 6–16 per group. For two-group comparisons on day 5, *** denotes a probability value of 0.001. For four-group comparisons on day 9, data not sharing the same superscript letter are significantly different at p < .05
Figure 6.
Figure 6.
Enteral broad-spectrum antibiotics perturb blood myeloid cell composition and suppress immune function. (a-b). Total blood neutrophil and monocyte counts. (c-d). Neutrophil ex vivo phagocytic cell frequency and capacity. (e). TLR2 (LTA) and TLR4 (LPS) agonist stimulated cytokine secretion in ex vivo whole blood. Normally distributed data are presented as bar plots showing means with standard errors, whereas non-normally distributed data is presented as box plots with Tukey whiskers. n = 8–16 per group. For two-group comparisons on day 5, *, ** and *** denote probability values of 0.05, 0.01 and 0.001. For four-group comparisons on day 9, data not sharing the same superscript letter are significantly different at p < .05

References

    1. La Rosa PS, Warner BB, Zhou Y, Weinstock GM, Sodergren E, Hall-Moore CM, Stevens HJ, Bennett WE, Shaikh N, Linneman LA, et al. Patterned progression of bacterial populations in the premature infant gut. Proc Natl Acad Sci. 2014;111:12522–16. doi:10.1073/pnas.1409497111. - DOI - PMC - PubMed
    1. Grier A, Qiu X, Bandyopadhyay S, Holden-Wiltse J, Kessler HA, Gill AL, Hamilton B, Huyck H, Misra S, Mariani TJ, et al. Impact of prematurity and nutrition on the developing gut microbiome and preterm infant growth. Microbiome. 2017;5:158. doi:10.1186/s40168-017-0377-0. - DOI - PMC - PubMed
    1. Korpela K, Blakstad EW, Moltu SJ, Strømmen K, Nakstad B, Rønnestad AE, Brække K, Iversen PO, Drevon CA, de Vos W.. Intestinal microbiota development and gestational age in preterm neonates. Sci Rep. 2018;8:2453. doi:10.1038/s41598-018-20827-x. - DOI - PMC - PubMed
    1. Neu J, Walker WA. Necrotizing enterocolitis. N Engl J Med. 2011;364:255–264. doi:10.1056/NEJMra1005408. - DOI - PMC - PubMed
    1. Pammi M, Cope J, Tarr PI, Warner BB, Morrow AL, Mai V, Gregory KE, Kroll JS, McMurtry V, Ferris MJ, et al. Intestinal dysbiosis in preterm infants preceding necrotizing enterocolitis: a systematic review and meta-analysis. Microbiome. 2017;5:31. doi:10.1186/s40168-017-0248-8. - DOI - PMC - PubMed

Publication types

MeSH terms

Substances