. 2021 Nov;18(11):1716-1726.
doi: 10.1080/15476286.2020.1868139. Epub 2020 Dec 31.

Bulges control pri-miRNA processing in a position and strand-dependent manner

Affiliations

Bulges control pri-miRNA processing in a position and strand-dependent manner

Shaohua Li et al. RNA Biol. 2021 Nov.

Abstract

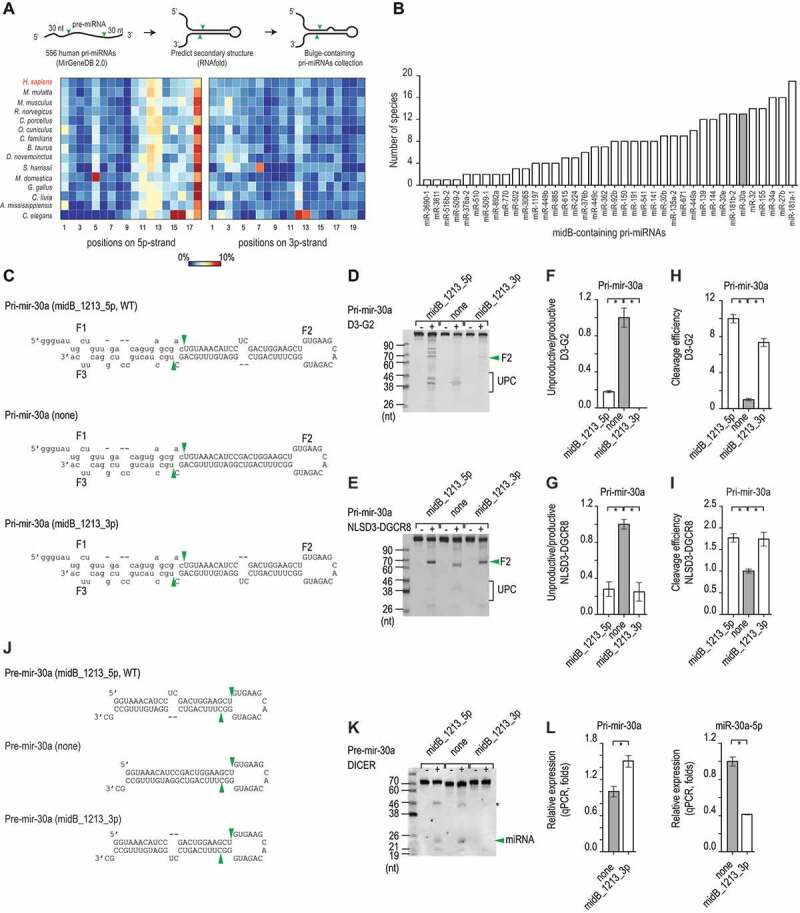
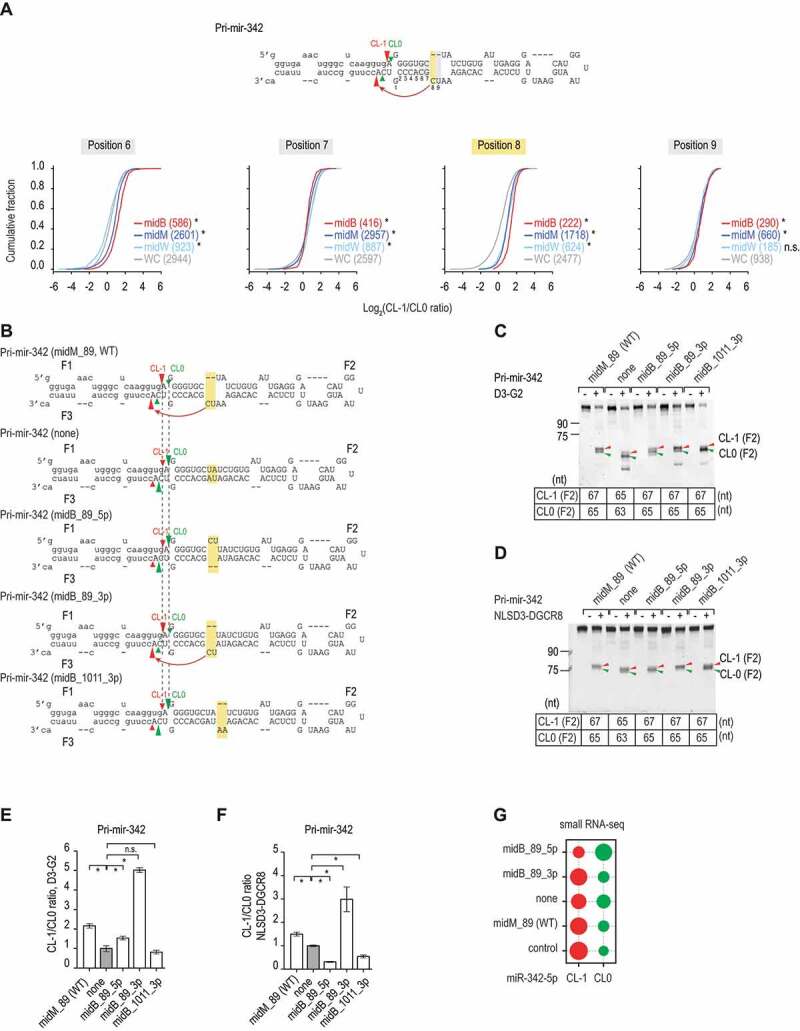
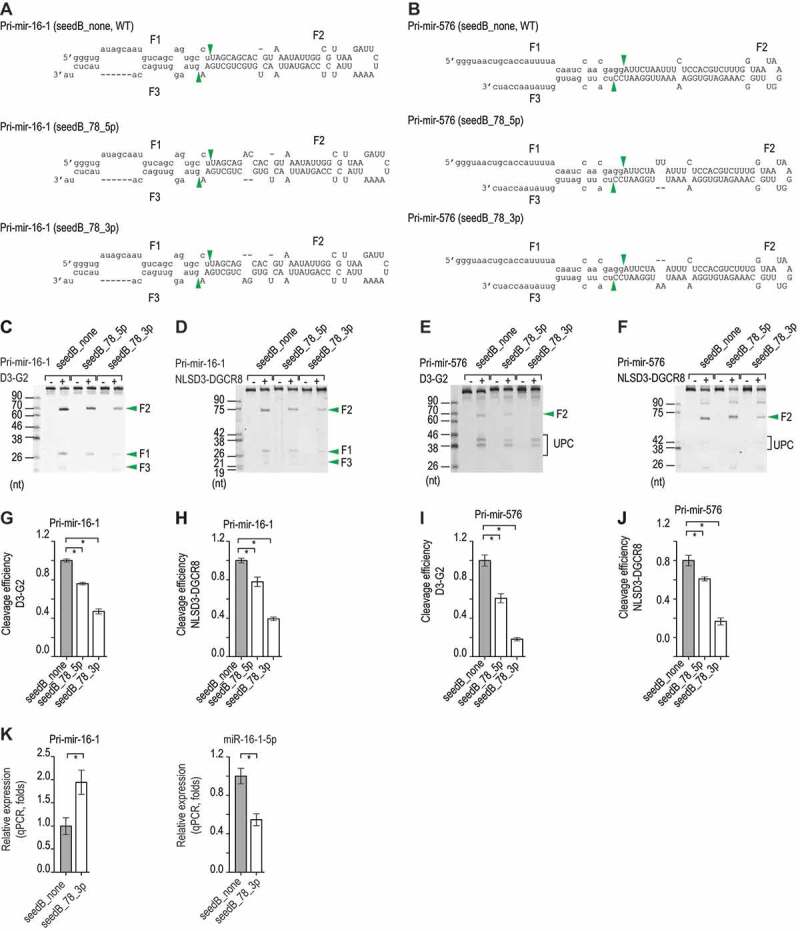
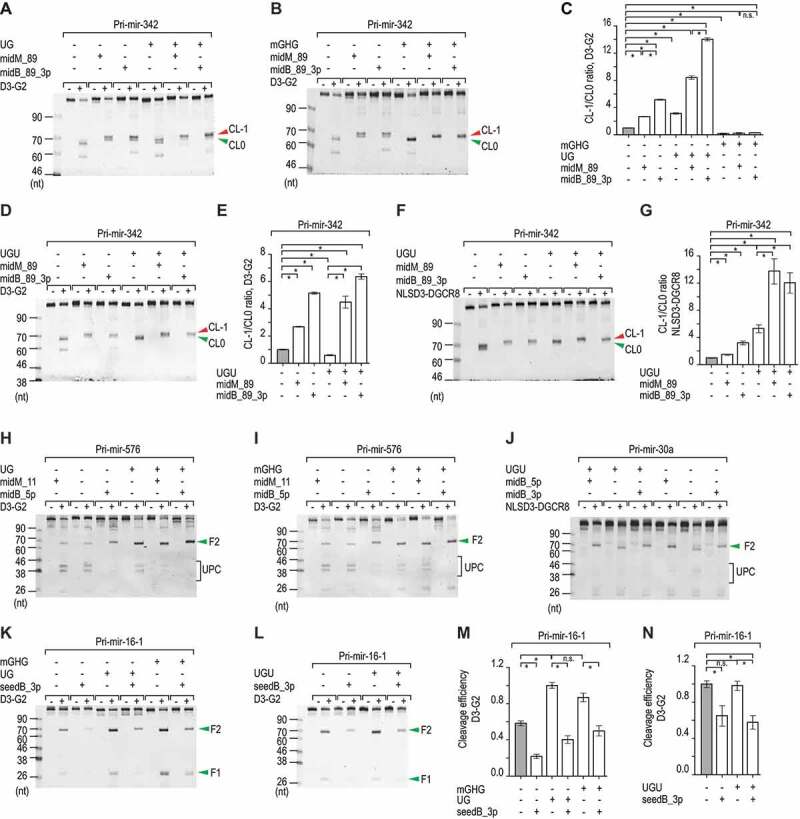
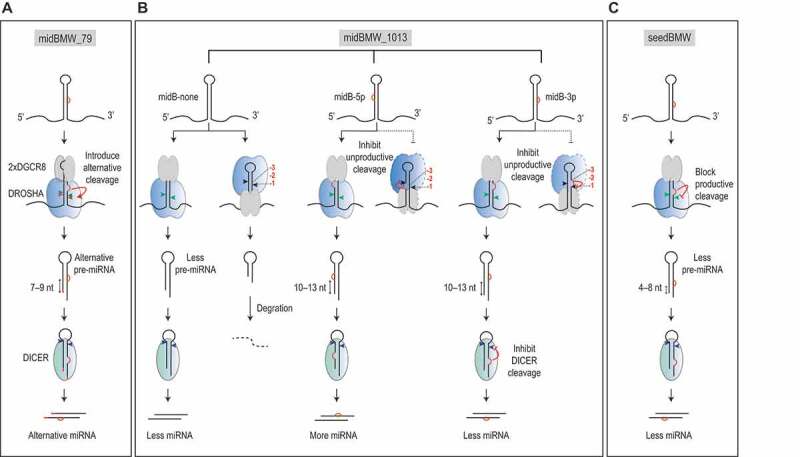
MicroRNAs (miRNAs) play critical roles in gene expression and numerous human diseases. The success of miRNA biogenesis is largely determined by the primary miRNA (pri-miRNA) processing by the DROSHA-DGCR8 complex, called Microprocessor. Here, we analysed the high-throughput pri-miRNA processing assays and secondary structures of pri-miRNAs to investigate the roles of bulges in the pri-miRNA processing. We found that bulges in multiple places control both the cleavage efficiency and accuracy of pri-miRNA processing. These bulges were shown to act on Microprocessor via its catalytic subunit, DROSHA, and function in a position and strand-dependent manner. Interestingly, we discovered that the enriched and conserved bulges, called midB, can correct DROSHA orientation on pri-miRNAs, thereby enhancing production of miRNAs. The revealed functions of the bulges help improve our understanding of pri-miRNA processing and suggest their potential roles in miRNA biogenesis regulation.

Keywords: Bulges; DGCR8; DROSHA; Microprocessor; miRNA biogenesis.


Conflict of interest statement

No potential conflict of interest was reported by the authors.

Figures

Figure 1.
Figure 1.
The 5p-strand bulges block the unproductive cleavage. (A) The percentage of pri-miRNAs that contain bulges in different positions in humans and various other organisms was estimated. The numbers indicate the positions of the nucleotides in the upper stem from the Microprocessor cleavage site, and the colour bar indicates the percentage ranging from 0% (blue) to 10% (red). (B) The number of species that share each midB_containing pri-miRNAs. (C) The sequences and secondary structures of the three pri-mir-30a variants. The productive cleavage sites of Microprocessor are indicated by the green arrowheads. The pre-mir-30a sequence is shown as capital letters. (D and E) Gel images showing the in vitro processing of the pri-mir-30a variants by D3-G2 (D) or NLSD3-DGCR8 (E). A 4 pmol aliquot of each pri-mir-30a variant was incubated with 16 pmol D3-G2 or 8 pmol NLSD3-DGCR8 at 37°C for 120 min. UPC: unproductive cleavage products. (F − I) Bar charts to show the unproductive/productive ratios or cleavage efficiency (i.e. the productive/original substrate ratio) estimated from three repeated processing assays. The ratios for each midB variant were normalized to that of the ‘none’ variant. The data are presented as mean +/− SEM values and the asterisks (*) indicate statistically significant results (p < 0.05) when compared with the two-sided t-test. The unproductive/productive ratios obtained for D3-G2 cleavage of pri-mir-30a, indicated that midB_1213_5p versus none: p = 0.002, and midB_1213_3p versus none: p = 0.001. The cleavage efficiency of this assay showed that midB_1213_5p versus none: p = 5.6e-5, and midB_1213_3p versus none: p = 1.6e-4. The unproductive/productive ratios obtained for NLSD3-DGCR8 cleavage of pri-mir-30a indicated that midB_1213_5p versus none: p = 0.002, and midB_1213_3p versus none: p = 0.003. The cleavage efficiency of this assay showed that midB_1213_5p versus none : p = 0.002, and midB_1213_3p versus none: p = 0.01. (J) The sequences and secondary structures of the pre-mir-30a variants. The DICER cleavage sites are indicated by the green arrowheads. (K) A representative gel image to show the in vitro cleavage of the pre-mir-30a variants by DICER. A 5 pmol aliquot of pre-mir-30a was incubated with 1.75 pmol DICER at 37°C for 120 min. The green arrowhead indicates the miRNA, and the asterisk (*) indicates the unidentified RNA fragments. (L) The relative level of pri-mir-30a (left) and miR-30a (right) expression in HCT116 cells transfected with the pri-mir-30a pcDNA3.0 plasmids followed by qPCR. The expression levels of pri-mir-30a and miR-30a were normalized to those of pri-mir-1226 and miR-1226, respectively. These normalized expression levels were then normalized again to the level of expression of pri-mir-30a or miR-30a (indicated by ‘none’ on both graphs). The data are presented as the mean +/− SEM, and the asterisks (*) indicate statistically significant (p < 0.05) results when compared with the two-sided t-test. For pri-mir-30a, midB_1213_3p versus none: p = 0.046, and for miR-30a, midB_1213_3p versus none: p = 0.007
Figure 2.
Figure 2.
The 3p-strand bulges affect the cleavage sites. (A) The ratios of the CL-1/CL0 cleavage were estimated for the pri-mir-342 variants, which contained bulges (midB), mismatches (midM), wobble base pairs (midW), or Watson-Cricks base pairs (WC) on the 3p-strand in positions 6–9 from the 5p-strand cleavage site. The pri-mir-342 variants were generated and cleaved by DROSHA, as described in our previous study [19] and Fig. S2A and S2B. The red, dark blue, light blue, and grey curves indicate the midB, midM, midW, and WC variants, respectively. The p-values were calculated by a two-sided Wilcoxon rank-sum test, for position 8, midM versus WC: p = 5.3e-117, midW versus WC: p = 1.8e-56, midB versus WC: p = 1.1e-57. (B) Diagrams showing the RNA sequences and secondary structures of the pri-mir-342 variants. The CL-1 and CL0 cleavage sites of Microprocessor are indicated by the red and green arrowheads, respectively. The mutated regions are highlighted in yellow. The pre-mir-342 sequence is shown in capital letters. (C and D) Gel images showing the size of bands after the pri-mir-342 variants were processed by D3-G2 or NLSD3-DGCR8. A 5 pmol aliquot of each pri-mir-342 variant was incubated with 10 pmol D3-G2 (C) or 6 pmol NLSD3-DGCR8 (D) at 37°C for 120 min. The sizes of the F2 bands resulting from the CL-1 and CL0 cleavages for each variant are shown in the tables below the gel images. (E and F) Bar charts showing the mean +/− SEM CL-1/CL0 ratios from the three repeated cleavage assays shown in C and D, respectively, for each pri-mir-342 variant. The band densities of each F2 fragment were quantified by Image Lab v.6.0.1. The CL-1/CL0 ratio of each variant was normalized to that of pri-mir-342 (none). The asterisk (*) and (n.s.) indicate statistically significant (p < 0.05) and no significant differences, respectively, when data were compared with the two-sided t-test. For the D3-G2 cleavage (E), midM_89 versus none: p = 0.003, midB_89_5p versus none: p = 0.039, midB_89_3p versus none: p = 3.2e-5, and midB_1011_3p versus none: p = 0.356. For the NLSD3-DGCR8 cleavage, midM_89 versus none: p = 0.006, midB_89_5p versus none: p = 1.0e-4, midB_89_3p versus none: p = 0.020, and midB_1011_3p versus none: p = 0.004. (G) The relative abundance of CL-1 or CL0 miR-342 in HCT116 cells transfected with pcDNA3.0 plasmids expressing each of the pri-mir-342 variants. HCT116 cells transfected with the pcDNA3.0 alone were used as a control. The relative abundance of each miRNA is indicated by the size of the circle
Figure 3.
Figure 3.
The 3p-strand bulges inhibit the productive cleavage. (A and B) The sequences and secondary structures of the pri-mir-16-1 and pri-mir-576 variants. The pre-mir-16-1 and pre-mir-576 sequences are presented as capital letters, and the productive cleavage sites of Microprocessor are indicated by the green arrowheads. (C–F) Representative images of gels showing the in vitro processing of the pri-mir-16-1 (C, D) and pri-mir-576 (E, F) variants by D3-G2 (C, E) or NLSD3-DGCR8 (D, F). A 5 pmol aliquot of the pri-miRNA substrate was incubated with 5 pmol D3-G2 or 4 pmol NLSD3-DGCR8 at 37°C for 120 min. UPC: unproductive cleavage products. (G–J) The cleavage efficiency of Microprocessor for pri-mir-16-1 and pri-mir-576 was estimated for the three repeated experiments shown in (C–F). The band densities of the F2 fragments or the original substrates were measured by Image Lab v.6.0.1. The cleavage efficiency was estimated as a ratio of F2/original substrate. These ratios (estimated for each pri-miRNA variant) were normalized to that of its ‘none’ variant. Data are presented as mean +/− SEM and the asterisks (*) indicate statistically significant differences (p < 0.05) when comparing the data with the two-sided t-test. For (G), seedB_78_5p versus seedB_none: p = 2.9e-4, and seedB_78_3p versus seedB_none: p = 6.9e-5. For (H), seedB_78_5p versus seedB_none: p = 0.016, and seedB_78_3p versus seedB_none: p = 3.9e-5. For (I), seedB_78_5p versus seedB_none: p = 0.004, and seedB_78_3p versus seedB_none: p = 6.2e-5, and for (J), seedB_78_5p versus seedB_none: p = 0.031, and seedB_78_3p versus seedB_none: p = 6.4e-4. (K) The relative level of expression of pri-mir-16-1 (left) and miR-16-1 (right) in HCT116 cells transfected with the pri-mir -16-1 pcDNA3.0 plasmid followed by qPCR. The expression levels of pri-mir-16-1 and miR-16-1 were normalized to those of pri-mir-1226 and miR-1226, respectively. These normalized expression levels were normalized to those of pri-mir-16-1 (left) or miR-16-1 (right; both labelled as seedB_none). The data are presented as mean +/− SEM, and the asterisks (*) and (n.s.) indicate statistically significant (p < 0.05) and no significant differences, respectively when data were compared with the two-sided t-test. For the left graph, seedB_78_3p versus seedB_none: p = 0.007, whereas for the right graph, seedB_78_3p versus seedB_none: p = 0.002
Figure 4.
Figure 4.
Coordination of bulges and known motifs. (A, B, D, F, H–L) Representative gel images showing the in vitro processing of the pri-mir-342, pri-mir-576, pri-mir-30a, and pri-mir-16-1 variants by D3-G2 or NLSD3-DGCR8. A 5 pmol aliquot of each pri-miRNA variant was incubated with 4–20 pmol D3-G2 or 4–8 pmol NLSD3-DGCR8 at 37°C for 120 min. UPC: unproductive cleavage products. (C, E and G) Bar charts showing the mean +/− SEM CL-1/CL0 ratios estimated from three repeated experiments for the pri-mir-342 variants. The band densities of the F2 fragments resulting from the CL-1 or CL0 cleavages for each variant were quantified by Image Lab v.6.0.1, and the CL-1/CL0 ratio of each variant was normalized to that of pri-mir-342 (midM_89). The asterisks (*) and (n.s.) indicate statistically significant (p < 0.05) and no significant differences, respectively, when the data were compared using the two-sided t-test. For (C), none versus midB_89: p = 9.6e-7, none versus UG+none: p = 6.4e-5, midB_89_3p versus UG+midB_89: p = 2.8e-6, none versus mGHG+none: p = 4.9e-4, midB_89_3p versus mGHG+midB_89_3p: p = 5.0e-7. For (E), none versus UGU+none: p = 0.002, midB_89_3p versus UGU+midB_89_3p: p = 0.004. For (G), none versus UGU+none: p = 0.002, midB_89_3p versus UGU+midB_89_3p: p = 0.005. (M and N) Bar charts to show the cleavage efficiency of Microprocessor, which was estimated from the three repeated processing experiments conducted for the pri-mir-16-1 variants. The band densities of the F2 fragments or the original substrates were quantified by Image Lab v.6.0.1. The cleavage efficiency was estimated as the ratio of the F2/original substrate. The ratio was normalized to that of the ‘UG’ variant (M) or to the ‘none’ variant (N). Data are presented as mean +/− SEM, and the asterisk (*) and (n.s.) indicate statistically significant (p < 0.05) and no significant differences, respectively when the data were compared using the two-sided t-test. For (M), none versus seedB_3p: p = 4.7e-4, UG+none versus UG+seedB_3p: p = 3.5e-4, and mGHG+none versus mGHG+seedB_3p: p = 0.007. For (N), none versus seedB_3p: p = 0.04, and UGU+none versus UGU+seedB_3p: p = 0.012
Figure 5.
Figure 5.
Models for controlling pri-miRNA processing by bulges, mismatches, and wobble base pairs. (A) Bulges on the 3p-strand, and both mismatches and wobble base pairs in positions 7–9 from the cleavage sites, facilitate the occurrence of alternative cleavages. These RNA elements appear in some pri-miRNAs such as pri-mir-342 (this study) and pri-mir-200b.[19], determining the cleavage sites of Microprocessor on these RNAs. These are called midBMW_79. (B) Bulges, mismatches, and wobble base pairs in the positions 10–13 from the cleavage sites, block unproductive cleavages, and thus enhance productive cleavages by Microprocessor. Although bulges on both the 5p-strand and 3p-strand reduce the unproductive cleavage of Microprocessor, and thus enhance the pre-miRNA production, the bulges on the 3p-strand reduce the cleavage of pre-miRNA by DICER. On the 5p-strand, bulges, mismatches, and wobble base pairs in the 10–13 region are enriched and conserved in many pri-miRNAs, and they are called midBMW_1013. (C) Bulges, mismatches, and wobble base pairs in the positions 4–8 from the cleavage sites, repress the number of productive cleavages by Microprocessor. Bulges on the 3p-strand have more substantial inhibitory effect than those on the 5p-strand. These RNA elements are called seedBMW. SeedBMW might occur in pri-miRNAs due to RNA-editing or SNPs[19]

Similar articles

Cited by

References

    1. Iwasaki S, Tomari Y.. Argonaute-mediated translational repression (and activation). Fly (Austin). 2009;3:205–208. - PubMed
    1. Jonas S, Izaurralde E. Towards a molecular understanding of microRNA-mediated gene silencing. Nat Rev Genet. 2015;16:421–433. - PubMed
    1. Bartel DP. Metazoan MicroRNAs. Cell. 2018;173:20–51. - PMC - PubMed
    1. Gebert LFR, MacRae IJ. Regulation of microRNA function in animals. Nat Rev Mol Cell Biol. 2019;20:21–37. - PMC - PubMed
    1. Kawamata T, Making TY. RISC. Trends Biochem Sci. 2010;35:368–376. - PubMed

Publication types