. 2021 Jan 21;184(2):507-520.e16.
doi: 10.1016/j.cell.2020.11.048. Epub 2020 Dec 30.

A circuit logic for sexually shared and dimorphic aggressive behaviors in Drosophila

Affiliations

A circuit logic for sexually shared and dimorphic aggressive behaviors in Drosophila

Hui Chiu et al. Cell. .

Erratum in

Abstract

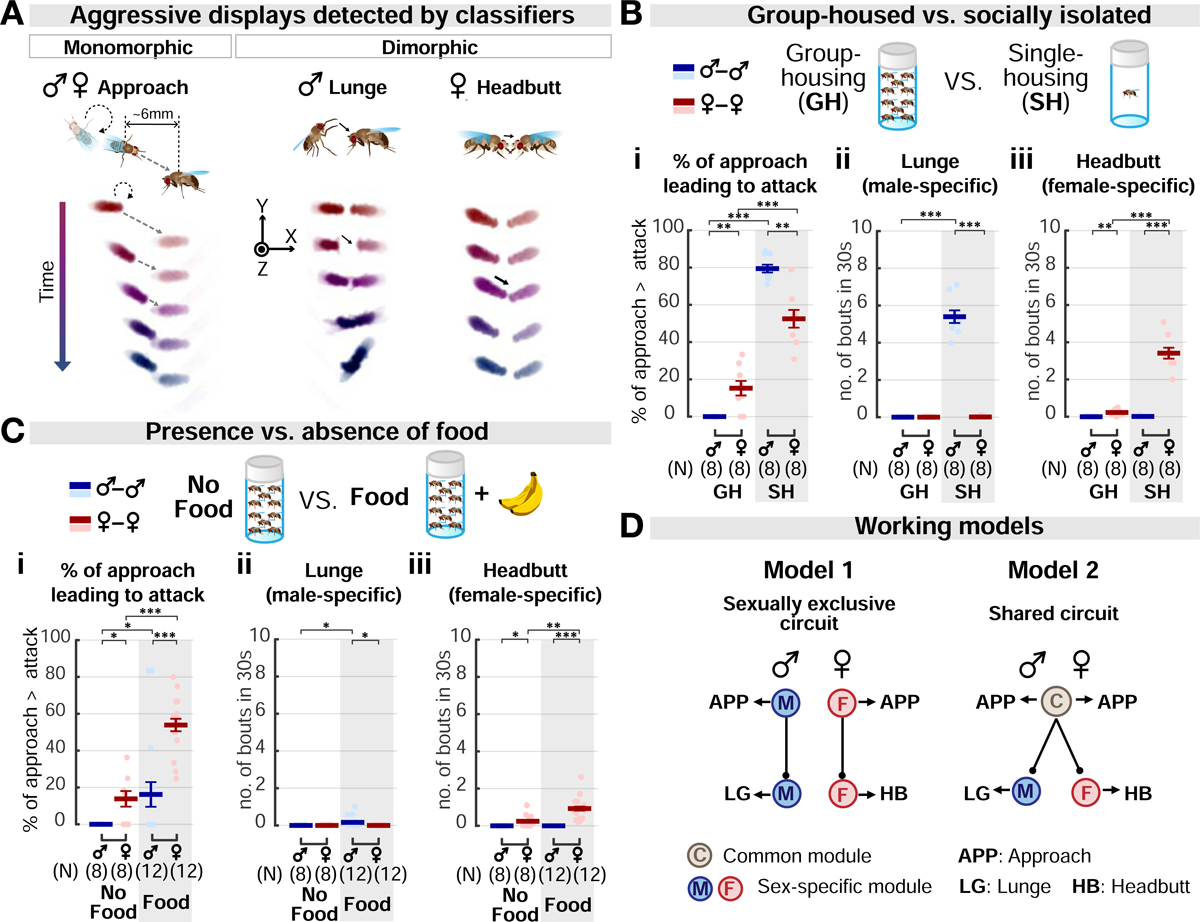
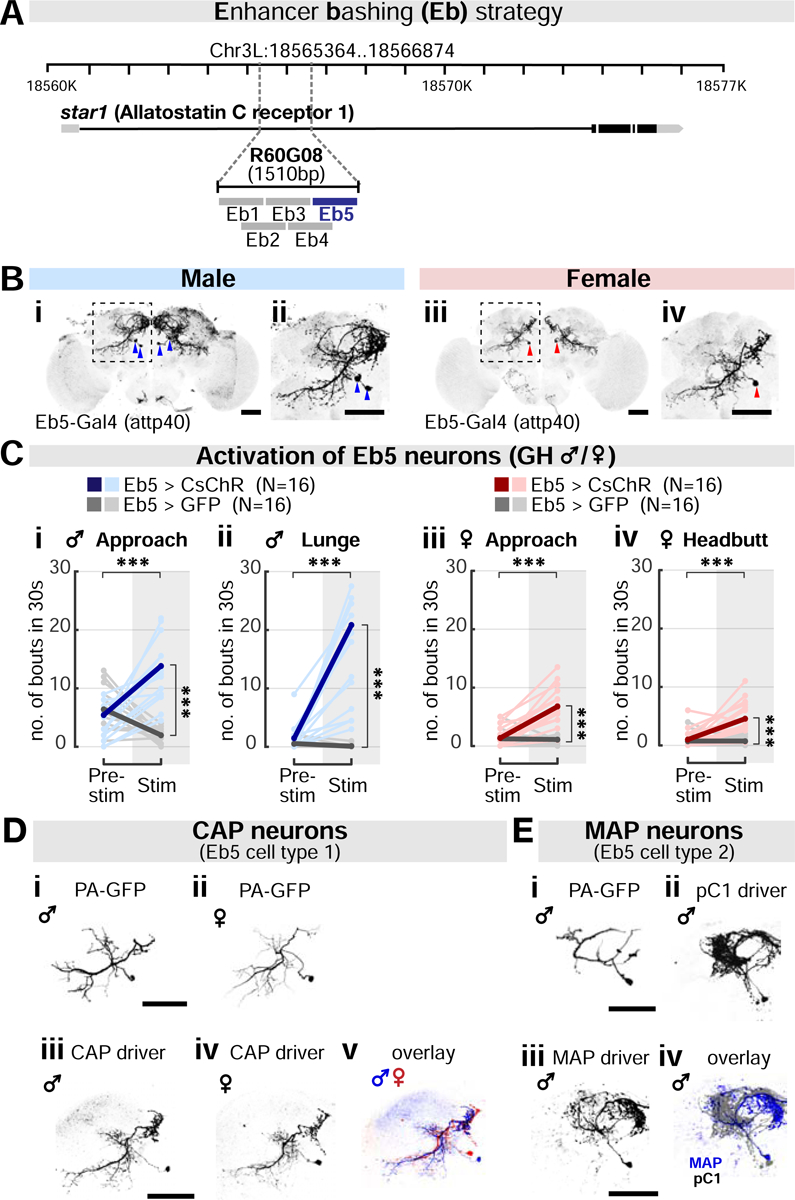
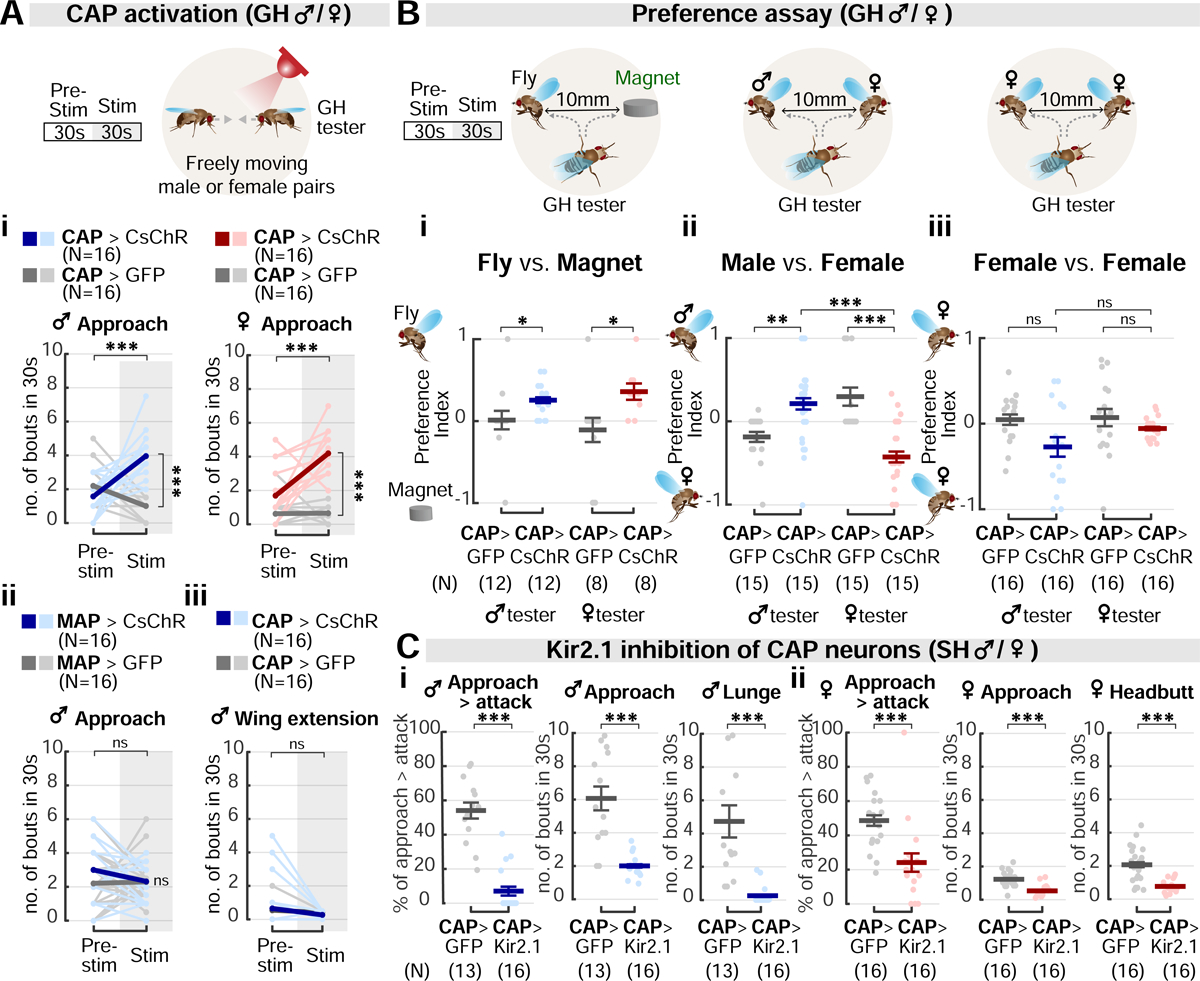
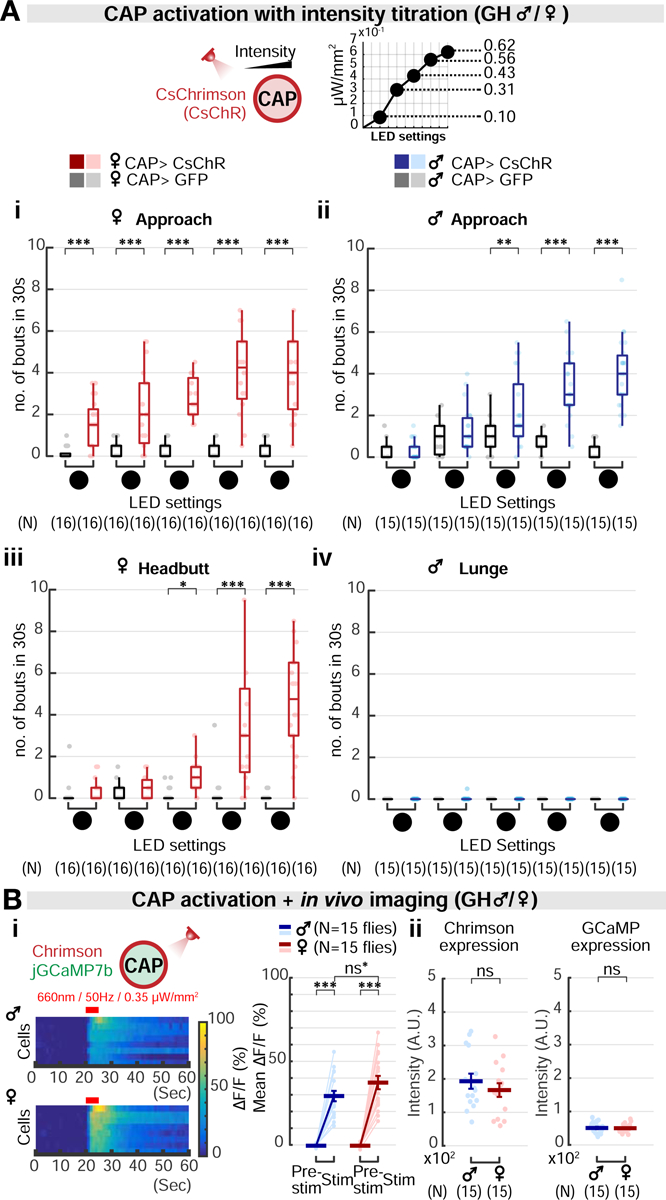
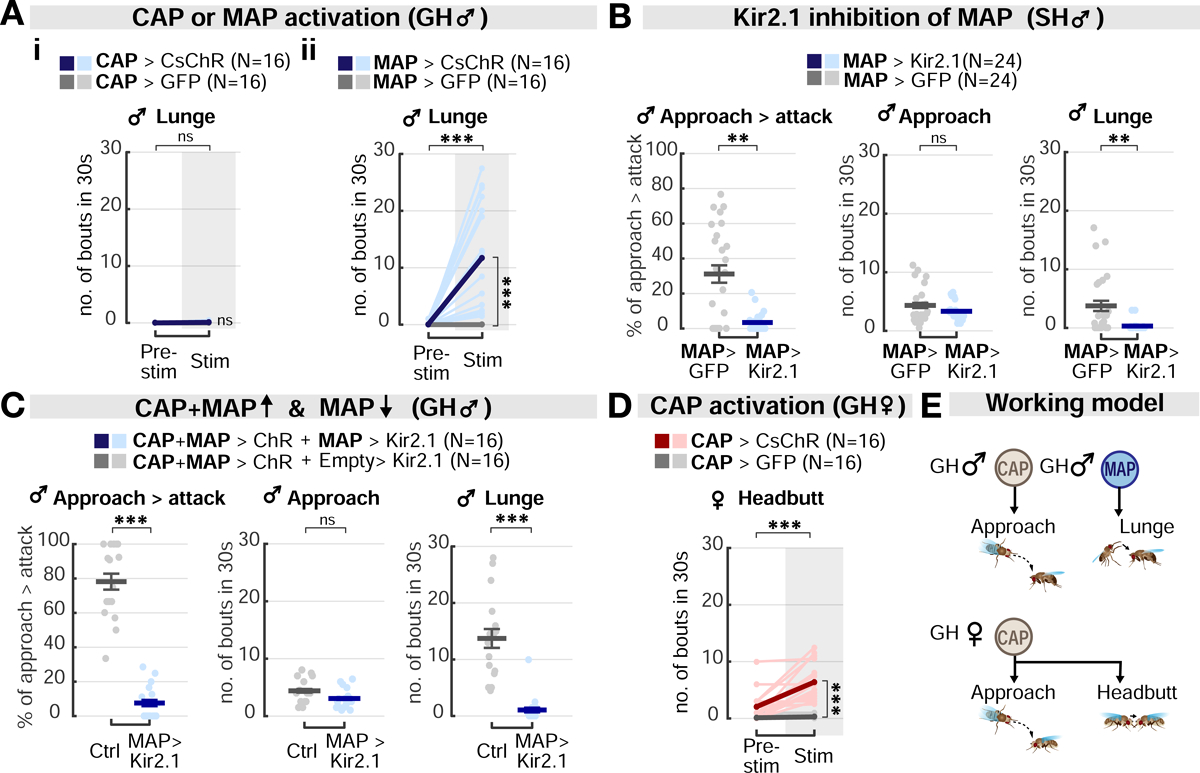
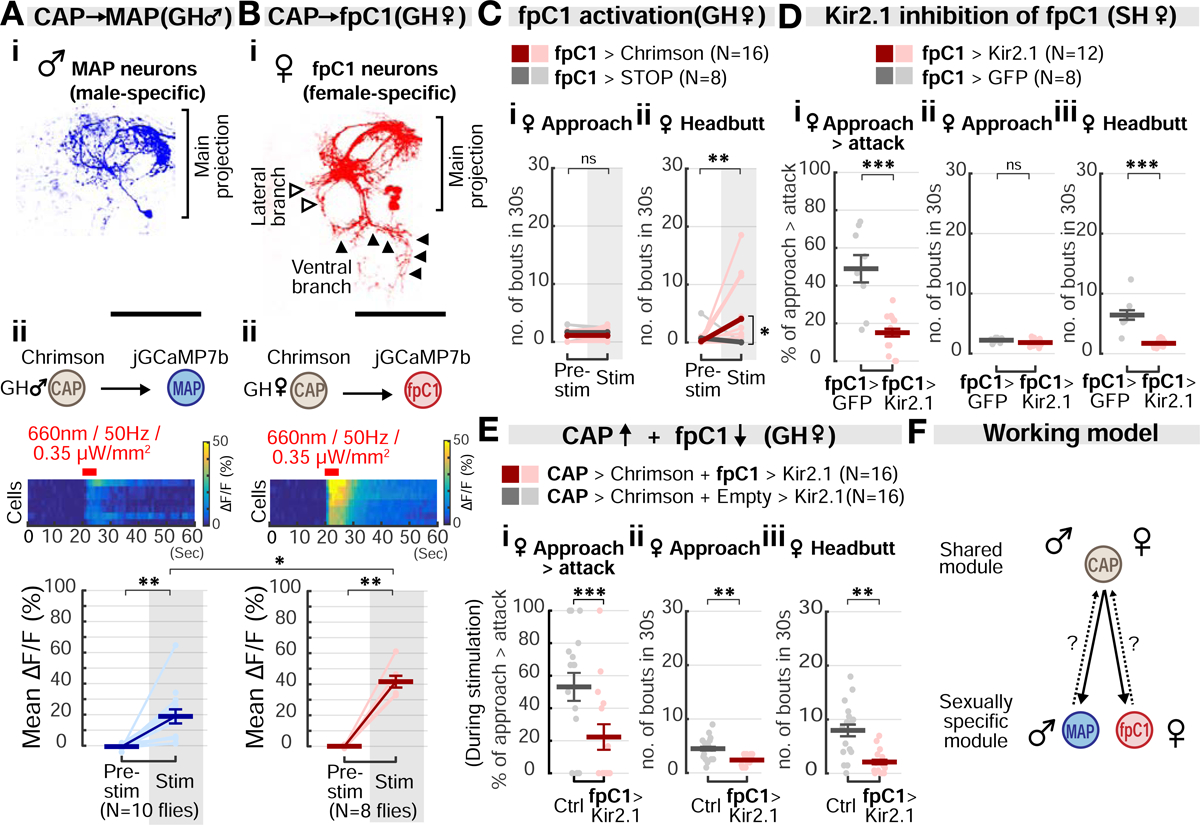
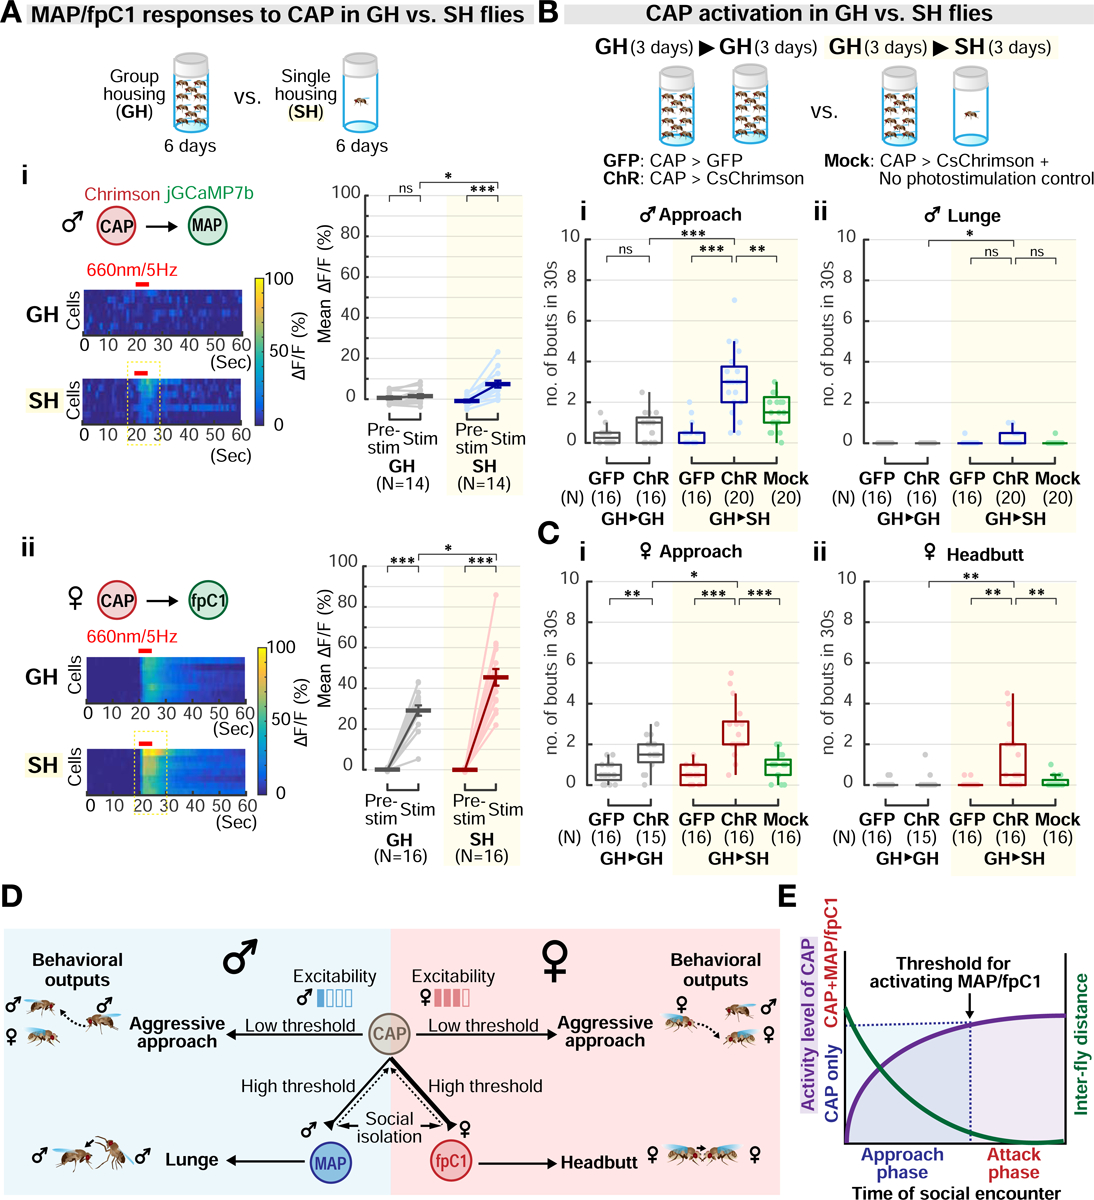
Aggression involves both sexually monomorphic and dimorphic actions. How the brain implements these two types of actions is poorly understood. We have identified three cell types that regulate aggression in Drosophila: one type is sexually shared, and the other two are sex specific. Shared common aggression-promoting (CAP) neurons mediate aggressive approach in both sexes, whereas functionally downstream dimorphic but homologous cell types, called male-specific aggression-promoting (MAP) neurons in males and fpC1 in females, control dimorphic attack. These symmetric circuits underlie the divergence of male and female aggressive behaviors, from their monomorphic appetitive/motivational to their dimorphic consummatory phases. The strength of the monomorphic → dimorphic functional connection is increased by social isolation in both sexes, suggesting that it may be a locus for isolation-dependent enhancement of aggression. Together, these findings reveal a circuit logic for the neural control of behaviors that include both sexually monomorphic and dimorphic actions, which may generalize to other organisms.

Keywords: Drosophila; appetitive behavior; consummatory behavior; sexual dimorphism.


Conflict of interest statement

Declaration of interests The authors declare no competing interests.

Figures

Figure 1.
Figure 1.. Contextual influences on sexually monomorphic and dimorphic aggressive actions in males and females
(A) Example bouts detected by automated behavioral classifiers. Approach: fly orients and moves towards target. Lunge: fly raises its upper body and slams down onto target. Headbutt: fly thrusts its body towards the target and strikes it with its head. See also Figure S1. (B-C) Effects of social isolation (B) and food presence (C) on male vs. female aggression. (B) Testers were reared either in groups (GH; 20 flies/vial) or in isolation (SH; 1 fly/vial) for 6 days prior to test. In (C), a banana chunk (“Food”) was provided during testing of GH flies. Dark lines: mean±SEM. Light circles: individual data. Here and throughout, ns, not significant; *p<0.05; **p<0.01; and ***p<0.001. Full genotypes of experimental flies for this and subsequent figures are listed in Table S1. Statistical data are listed in Table S3. (D) Proposed models for aggression circuitry in males and females. Model 1, the aggression circuit in each sex is composed exclusively of sex-specific components. Model 2, some aggression circuit components, controlling similar behaviors, are shared by both sexes.
Figure 2.
Figure 2.. Identification of sexually monomorphic and dimorphic aggression-promoting cell types
(A) “Enhancer-bashing” strategy to identify GAL4 drivers for R60G08 subpopulations. (B) Neurons labeled by Eb5-Gal4 (attp40) in males (i-ii) and females (iii-iv). Areas outlined by dashed boxes in (i) and (iii) are enlarged in (ii) and (iv), respectively. Arrowheads: cell body locations. Scale bar: 50μm. See also Figures S3A and S4B. (C) Activation of Eb5 neurons strongly promotes male (i-ii) and female aggression (iii-iv). Shown are bouts of approach (i and iii), lunging (ii) and headbutting (iv). Light and dark color lines: individual data and the mean, respectively. See also Figure S3B. (D) Morphology of the sexually shared CAP neurons in males and females. Neuronal traces labelled by activated photo-activatable (PA) GFP (i-ii), CsChrimson expression driven by CAP driver (iii-iv; Eb5-Gal4 (attp40); R22F05-Gal80(attp2)), and overlay between sexes (v). Scale bar: 50μm. See also Figure S3C–E. (E) Morphology of the male-specific MAP neurons in males. Neuronal traces labelled by activated PA-GFP (i), CsChrimson expression driven by pC1 driver (ii; NP2631/dsx-Flp), or by MAP driver (iii; Eb5-AD(vk27), R22F05-DBD(attp2)) and overlay between pC1 and MAP (iv). Scale bar: 50μm. See also Figure S4A–D.
Figure 3.
Figure 3.. CAP stimulation evokes aggressive approach in males and females
(A) CAP activation in GH males and females (i), but not MAP activation in males (ii), promotes approach. Courtship, measured by bouts of wing extension, is not affected by CAP stimulation (iii). Light and dark color lines: individual data and the mean, respectively. (B) Analysis of approach preference in CAP-stimulated testers towards: (i) flies vs. an inanimate object (magnet); (ii) same- vs. opposite-sex fly targets; and (iii) two female fly targets. The preference index (PI): (i) PI = (ntoward the fly target − ntoward the magnet) / ntotal; (ii), PI = (ntoward the male target − ntoward the female target) / ntotal; (iii), PI = (ntoward the left female target − ntoward the right female target) / ntotal. See also Methods. Dark lines: mean±SEM. Light circles: individual data. (C) Silencing of CAP neurons using Kir2.1 reduces naturally-occurring aggression in SH males (i) and females (ii). Dark lines: mean±SEM. Light circles: individual data.
Figure 4.
Figure 4.. Aggression-promoting thresholds for CAP activation differ in males and females
(A) Optogenetic activation of CAP neurons at five increasing intensities of photostimulation in females (i, iii) and males (ii, iv), with dependent variables of approach (i, ii) headbutt (iii) or lunge (iv). The intensities of the stimulation (❶-❺) correspond to 0.1, 0.31, 0.43, 0.56, 0.62 μW/mm2. Light circles: individual data. (B) (i) GCaMP fluorescence changes (ΔF/F) in CAP neurons in response to photo-simulation of the same cells, in males versus females. Red bar: 5 seconds of 660nm photostimulation. Light circles: individual data. Dark lines: mean±SEM. ns*: non-significant after the Bonferroni correction. (ii) Expression level of Chrimson::tdTomato or GCaMP7b in male and female CAP neurons, measured by fluorescence intensity.
Figure 5.
Figure 5.. MAP and CAP stimulation elicits dimorphic attacks in males and females, respectively
(A) Optogenetic stimulation of MAP neurons alone, but not of CAP neurons, is sufficient to evoke lunging in GH males. Light and dark colored lines: individual data and the mean, respectively. (B) Kir2.1 inhibition of MAP neurons in SH males reduces spontaneous lunges but does not affect approaches towards a male target. Dark lines: mean±SEM. Light circles: individual data. (C) MAP silencing suppresses lunging promoted by co-activation of CAP and MAP cells, but does not reduce approach, in GH males. Dark lines: mean±SEM. Light circles: individual data. (D) CAP stimulation is sufficient to evoke headbutting in GH females. Light and dark color lines: individual data and the mean, respectively. (E) Summary of the behavioral phenotypes produced by CAP or MAP stimulation in GH flies. In males (upper), CAP stimulation promotes approach, whereas MAP stimulation triggers lunging. In females (lower), CAP stimulation promotes approach and headbutting.
Figure 6.
Figure 6.. Functional connectivity between monomorphic and dimorphic circuit modules
(A) Morphology of MAP neurons (i) and jGCaMP7b fluorescence changes (ii) in response to CAP stimulation in GH male flies. Light circles: individual data. Dark lines: mean±SEM. Fig. 6Ai is duplicated from Fig. 2Eiii for purposes of comparison between MAP and fpC1 neurons. Scale bar: 50μm. Mann-Whitney U test, corrected for multiple comparisons. (B) Morphology of fpC1 neurons (i) and jGCaMP7b fluorescence changes (ii) in response to CAP stimulation in GH females. Light circles: individual data. Dark lines: mean±SEM. Scale bar: 50μm. Mann-Whitney U test, corrected for multiple comparisons. (C) Optogenetic activation of fpC1 neurons promotes headbutting, but not approach, in GH females. Light and dark color lines: individual data and the means, respectively. See also Figures S4E and S5D. (D) Inactivation of fpC1 neurons with Kir2.1 expression. Dark lines: mean±SEM. Light circles: individual data. (E) Behavioral epistasis between the upstream CAP neurons and the downstream fpC1 neurons. Dark lines: mean±SEM. Light circles: individual data. (F) Summary of circuit connectivity in males and females. Sexually monomorphic CAP neurons functionally connect with dimorphic MAP and fpC1 neurons in males and females, respectively. Dashed arrow: potential feedback from MAP/fpC1 onto CAP.
Figure 7.
Figure 7.. Social isolation enhances aggressiveness by strengthening circuit functional connectivity
(A) jGCaMP7b fluorescence changes in MAP (i) or fpC1 neurons (ii) in response to CAP stimulation in group-housed (GH) or single-housed (SH) flies. Mann-Whitney U test, corrected for multiple comparisons. Light circles: individual data. Dark lines: mean±SEM. (B-C) Optogenetic activation of CAP neurons in flies reared in groups for 6 days (GH>GH) or in groups for 3 days followed by isolation for 3 days (GH>SH). “GFP,” CAP>GFP control; “ChR,” CAP>CsChrimson with photostimulation; “Mock,” CAP>CsChrimson without photostimulation. Light circles: individual data. (D) Diagram illustrating circuit control of sexually monomorphic and dimorphic phases of aggression. Sexually shared CAP neurons control appetitive (approach) and trigger consummatory (lunge vs. headbutt) aggressive behavior via MAP or fpC1 neurons in males vs. females, respectively. Low vs. High threshold: the relative light intensities used for CAP stimulation to elicit appetitive vs. consummatory behavior, respectively. MAP or fpC1 stimulation promotes attack independently of approach. The CAP→MAP/fpC1 connectivity is a locus for experience-dependent enhancement of aggression. The synaptic connectivity underlying the functional connection between CAP and MAP/fpC1 may be direct or indirect. Dashed arrows: potential feedback from MAP/fpC1 onto CAP. (E) Model showing how progression from the approach to attack phases of aggression might be controlled by a ramp-up in CAP activity, from below to above threshold for MAP/fpC1 activation (arrow). CAP activity is predicted to vary inversely with distance between flies, for example due to an increase in the intensity of sensory cues.

Comment in

  • Fly fighters.
    Bray N. Bray N. Nat Rev Neurosci. 2021 Mar;22(3):134-135. doi: 10.1038/s41583-021-00430-2. Nat Rev Neurosci. 2021. PMID: 33473202 No abstract available.

References

    1. Adams MD, Celniker SE, Holt RA, Evans CA, Gocayne JD, Amanatides PG, Scherer SE, Li PW, Hoskins RA, Galle RF, et al. (2000). The genome sequence of Drosophila melanogaster. Science 287, 2185–2195. - PubMed
    1. Anderson DJ (2016). Circuit modules linking internal states and social behaviour in flies and mice. Nat. Rev. Neurosci 17, 692–704. - PubMed
    1. Anderson DJ, and Adolphs R (2015). A framework for studying emotions across phylogeny. Cell 157, 187–200. - PMC - PubMed
    1. Asahina K, Watanabe K, Duistermars BJ, Hoopfer E, Gonzalez CR, Eyjolfsdottir EA, Perona P, and Anderson DJ (2014). Tachykinin-expressing neurons control male-specific aggressive arousal in Drosophila. Cell 156, 221–235. - PMC - PubMed
    1. Asahina K (2018). Sex differences in Drosophila behavior: qualitative and quantitative dimorphism. Curr. Opin. Physiol 6, 35–45. - PMC - PubMed

Publication types

LinkOut - more resources