. 2021 Feb 10;29(2):281-298.e5.
doi: 10.1016/j.chom.2020.12.001. Epub 2021 Jan 6.

The cancer microbiome atlas: a pan-cancer comparative analysis to distinguish tissue-resident microbiota from contaminants

Affiliations

The cancer microbiome atlas: a pan-cancer comparative analysis to distinguish tissue-resident microbiota from contaminants

Anders B Dohlman et al. Cell Host Microbe. .

Abstract

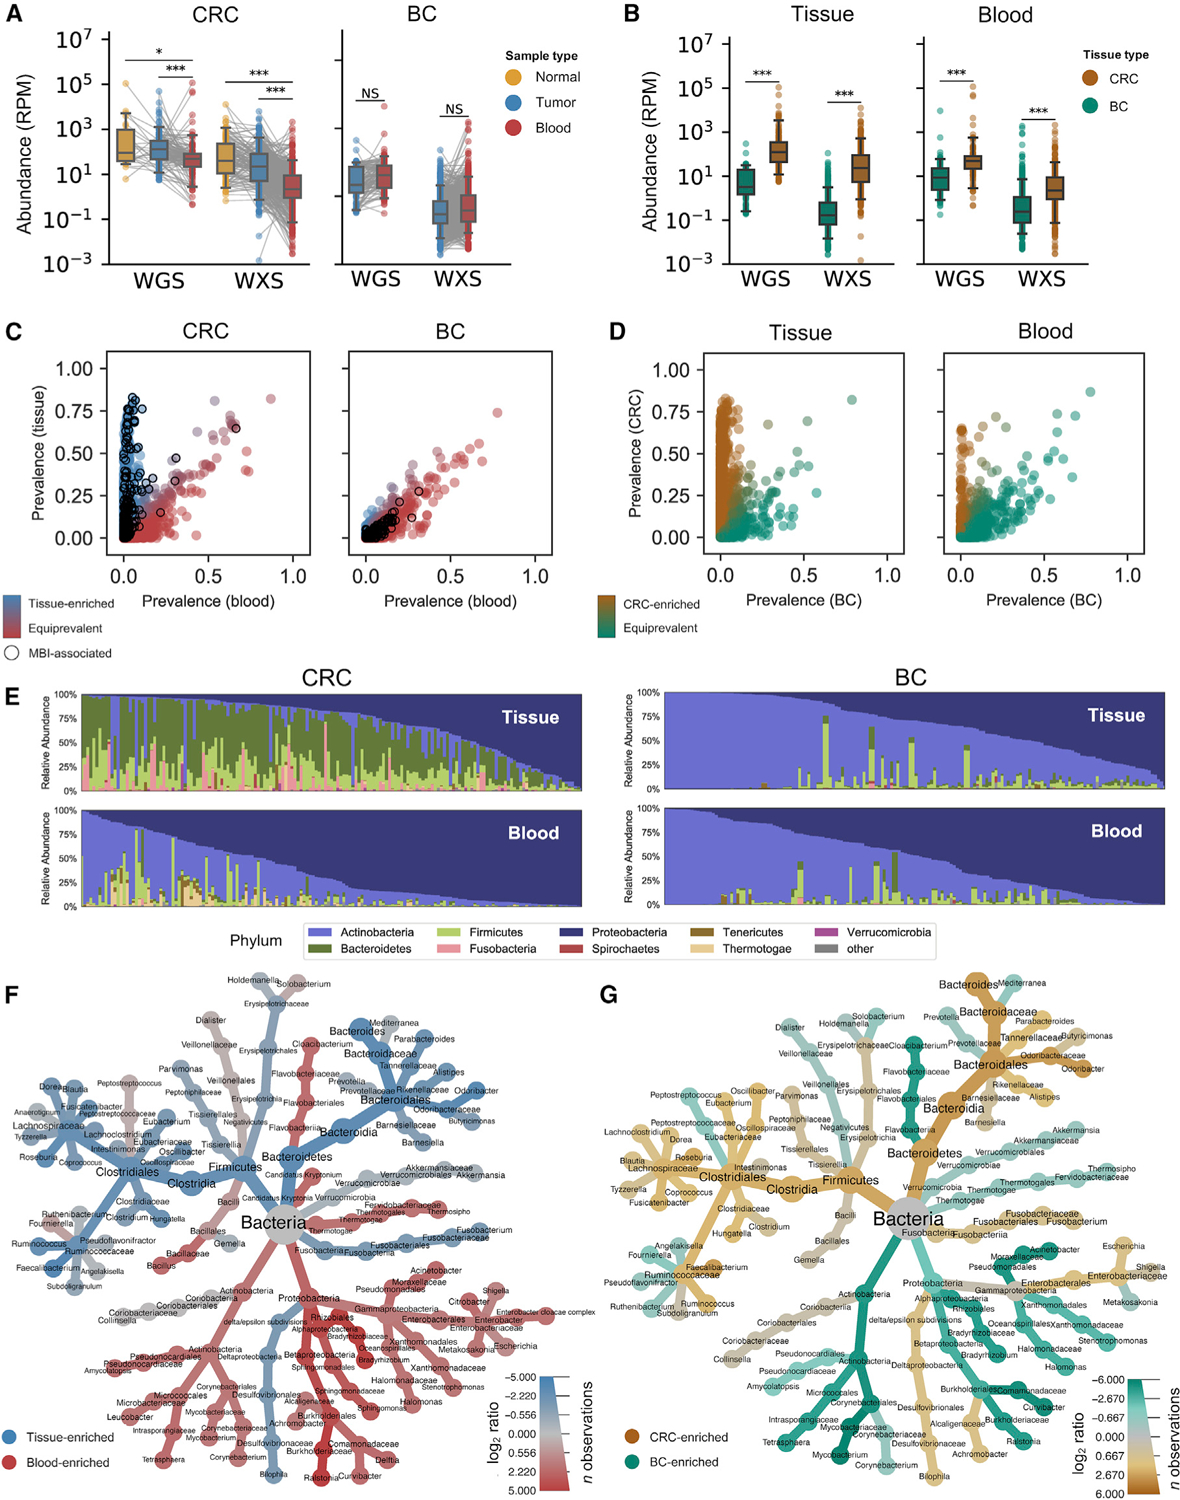
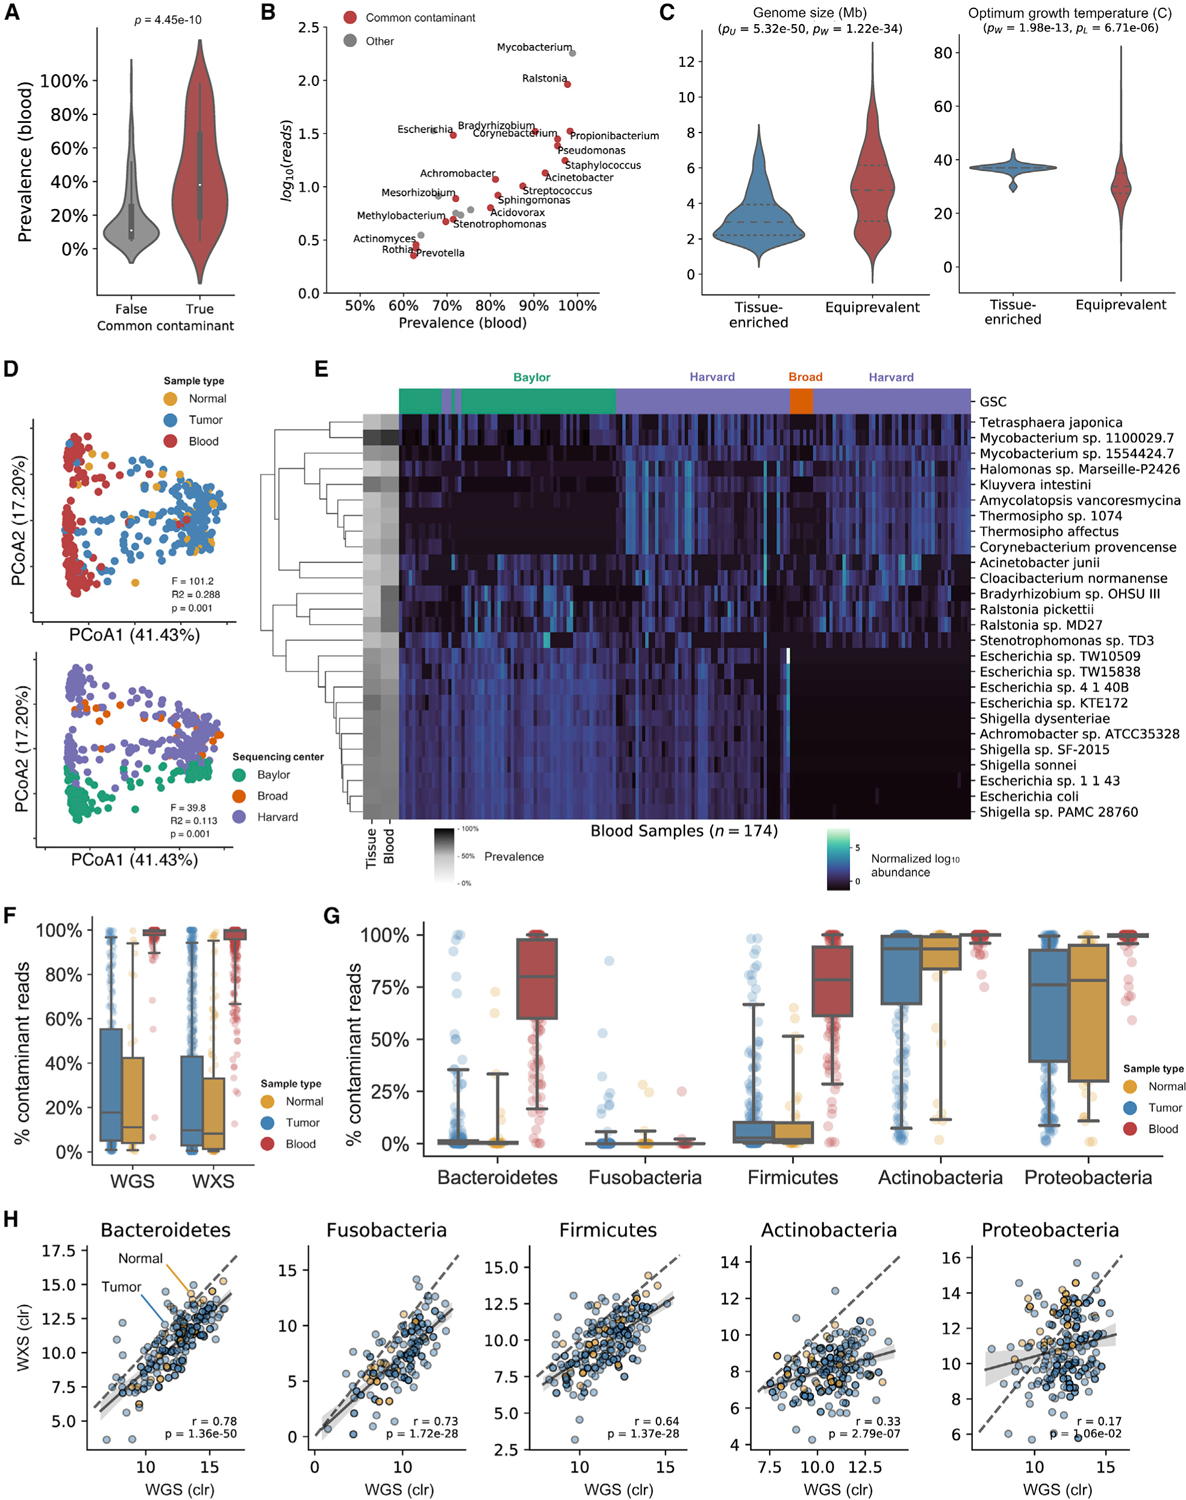
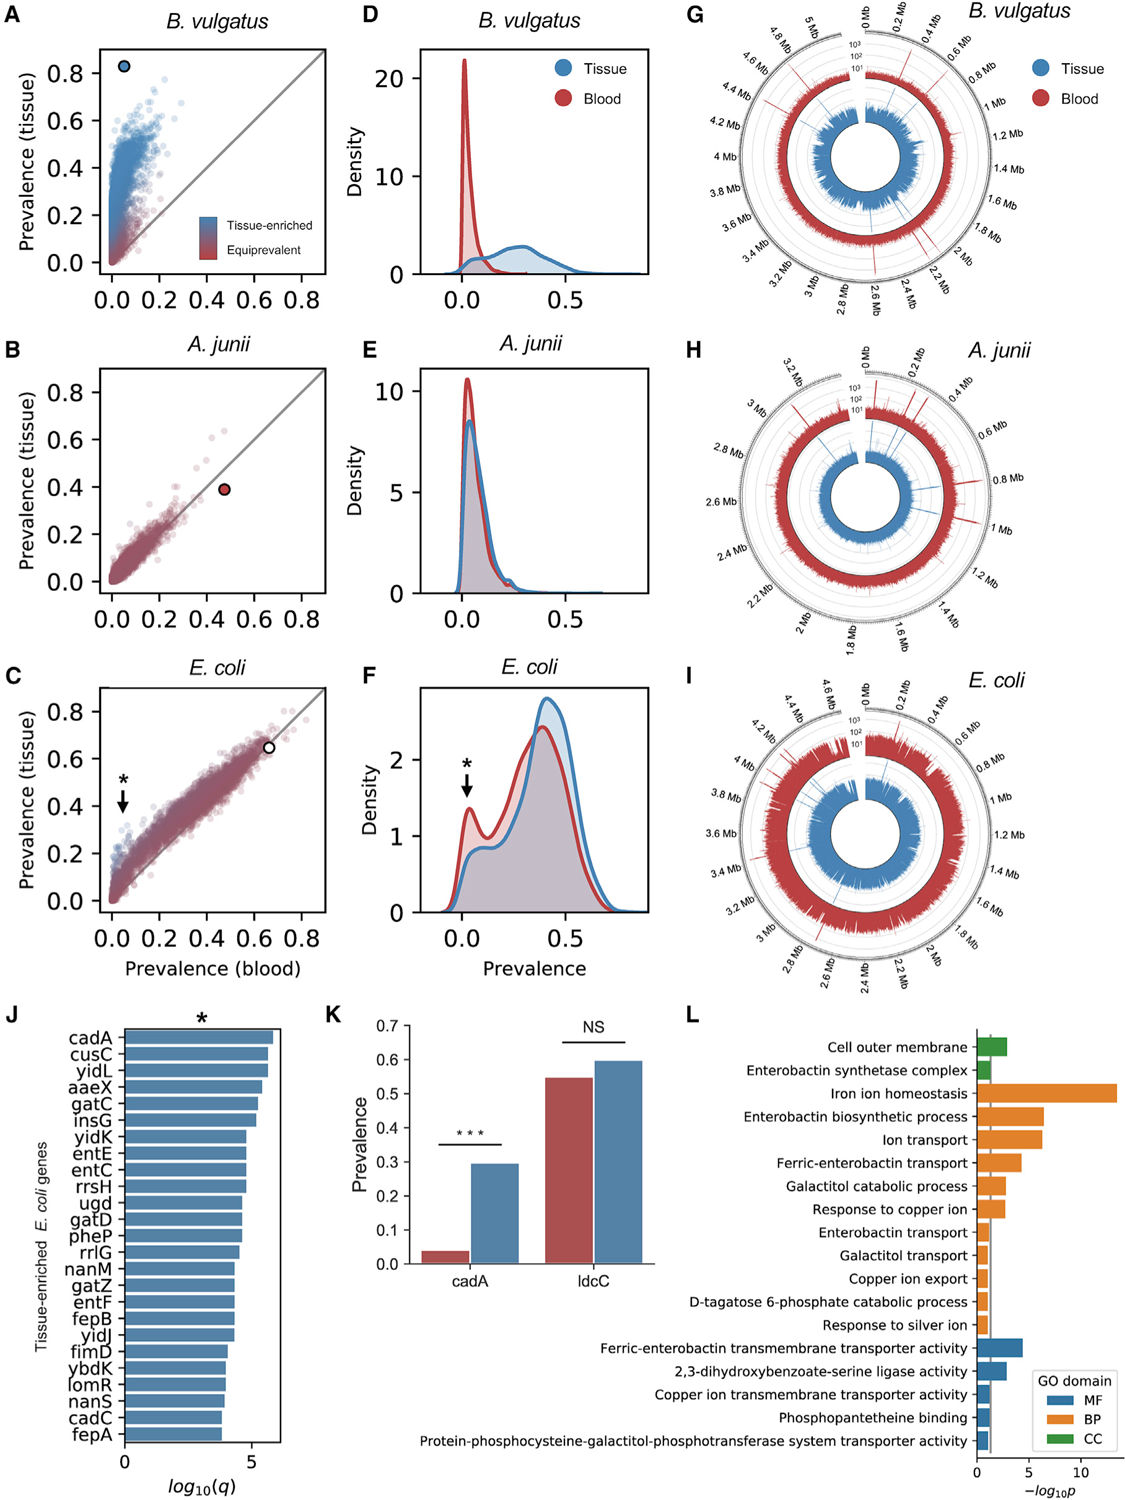
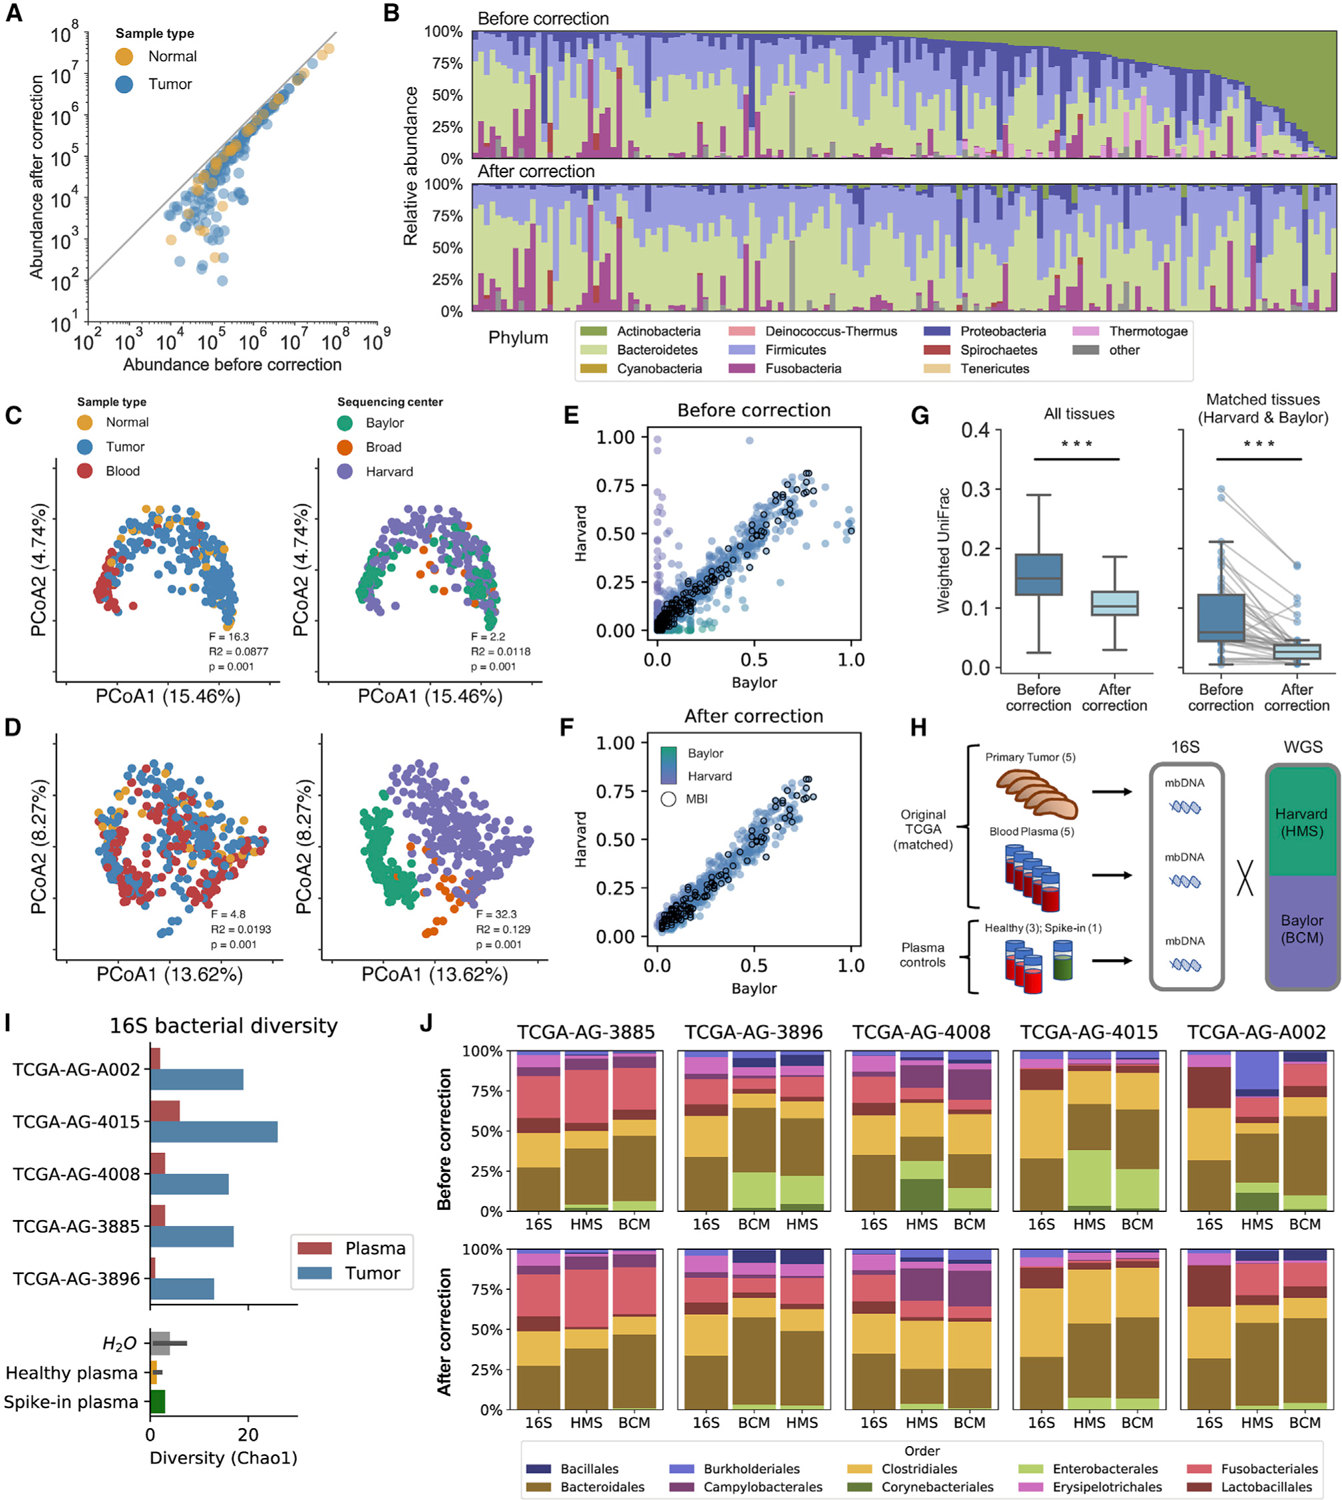
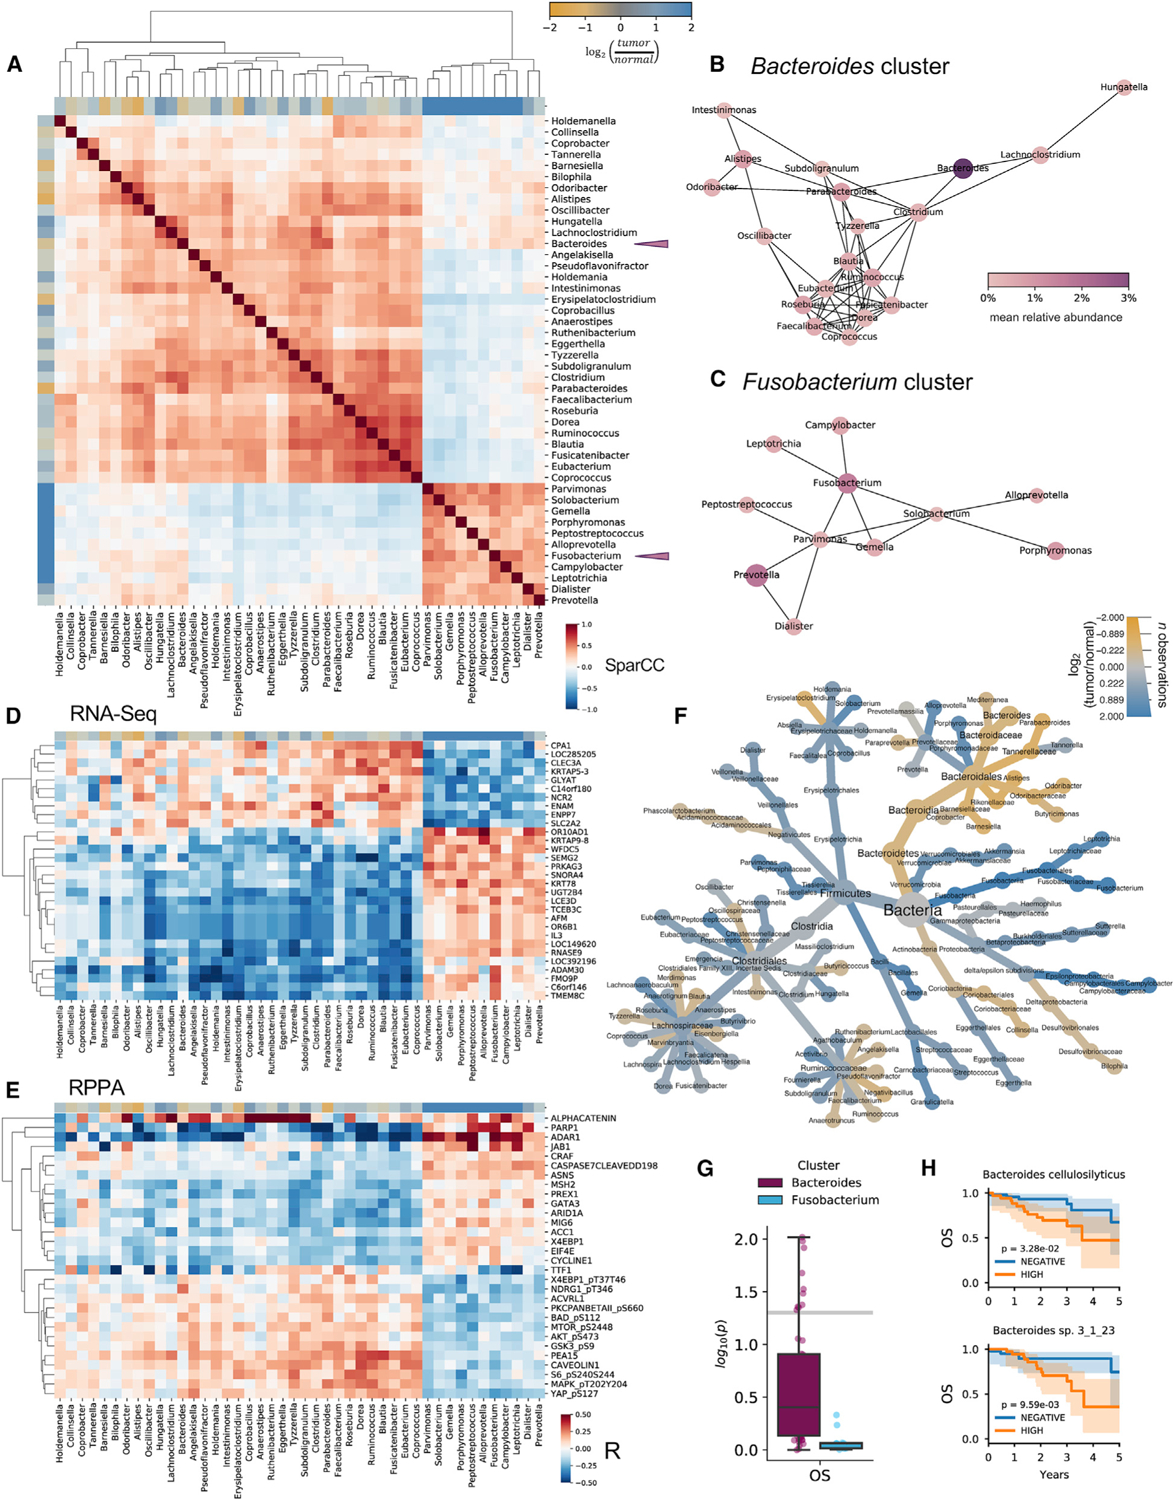
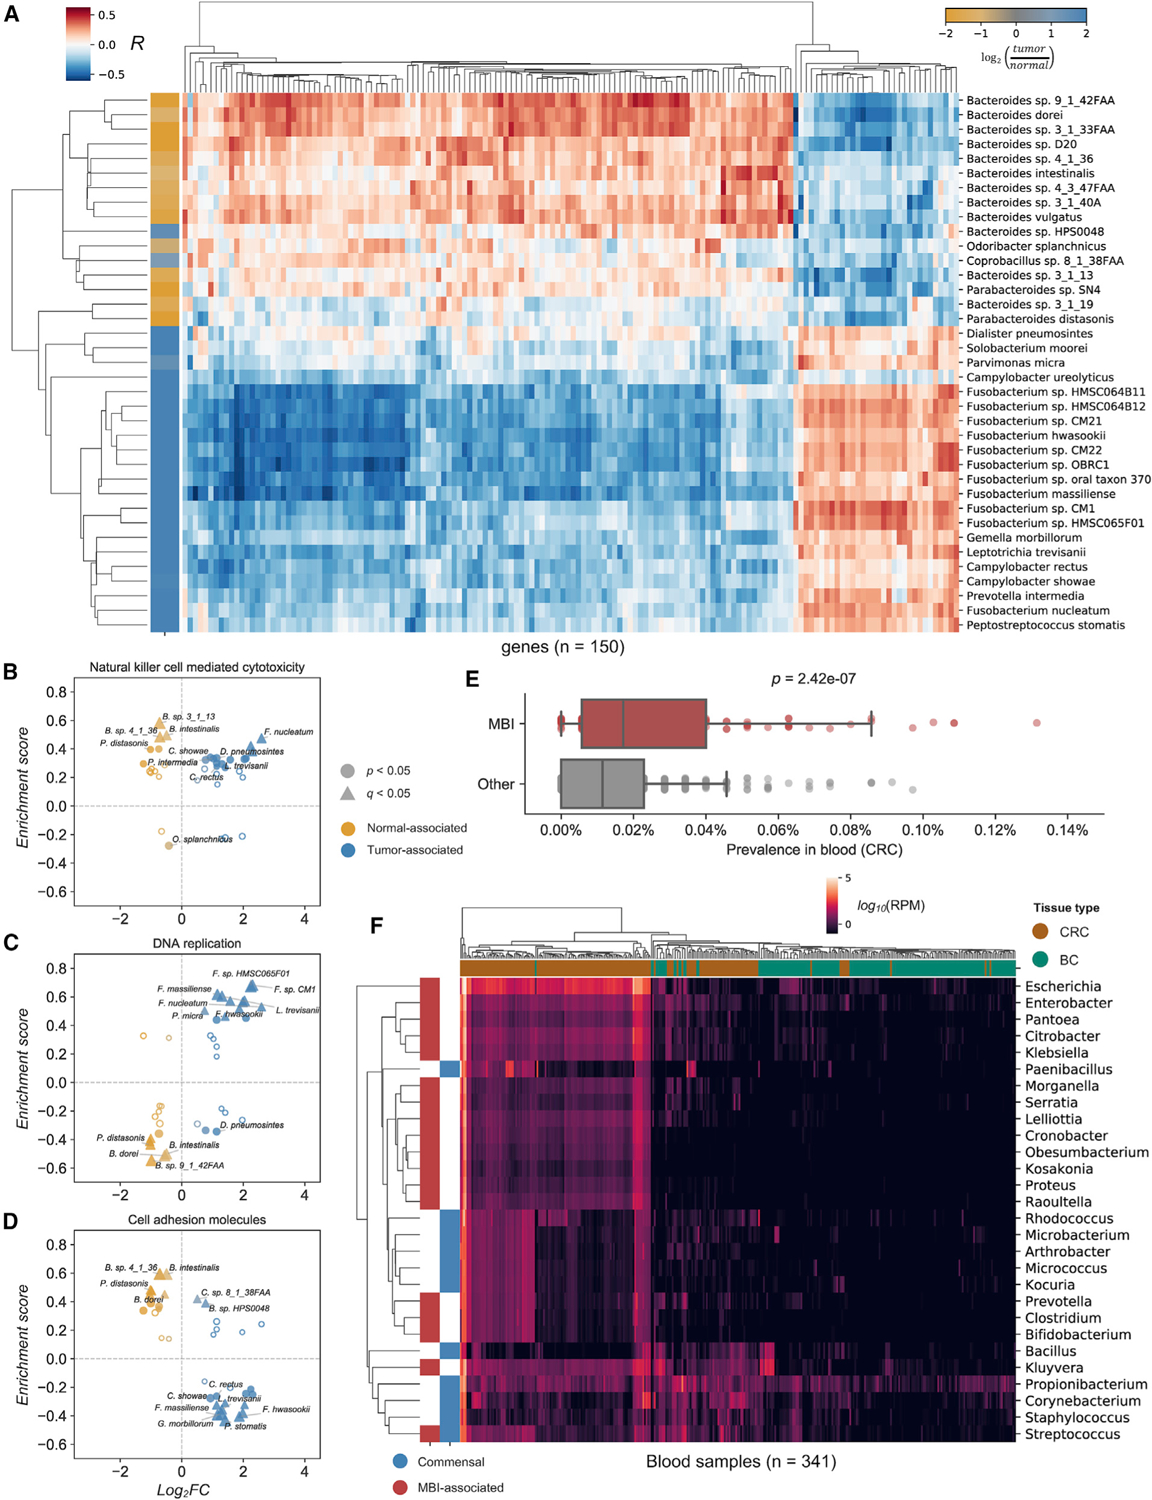
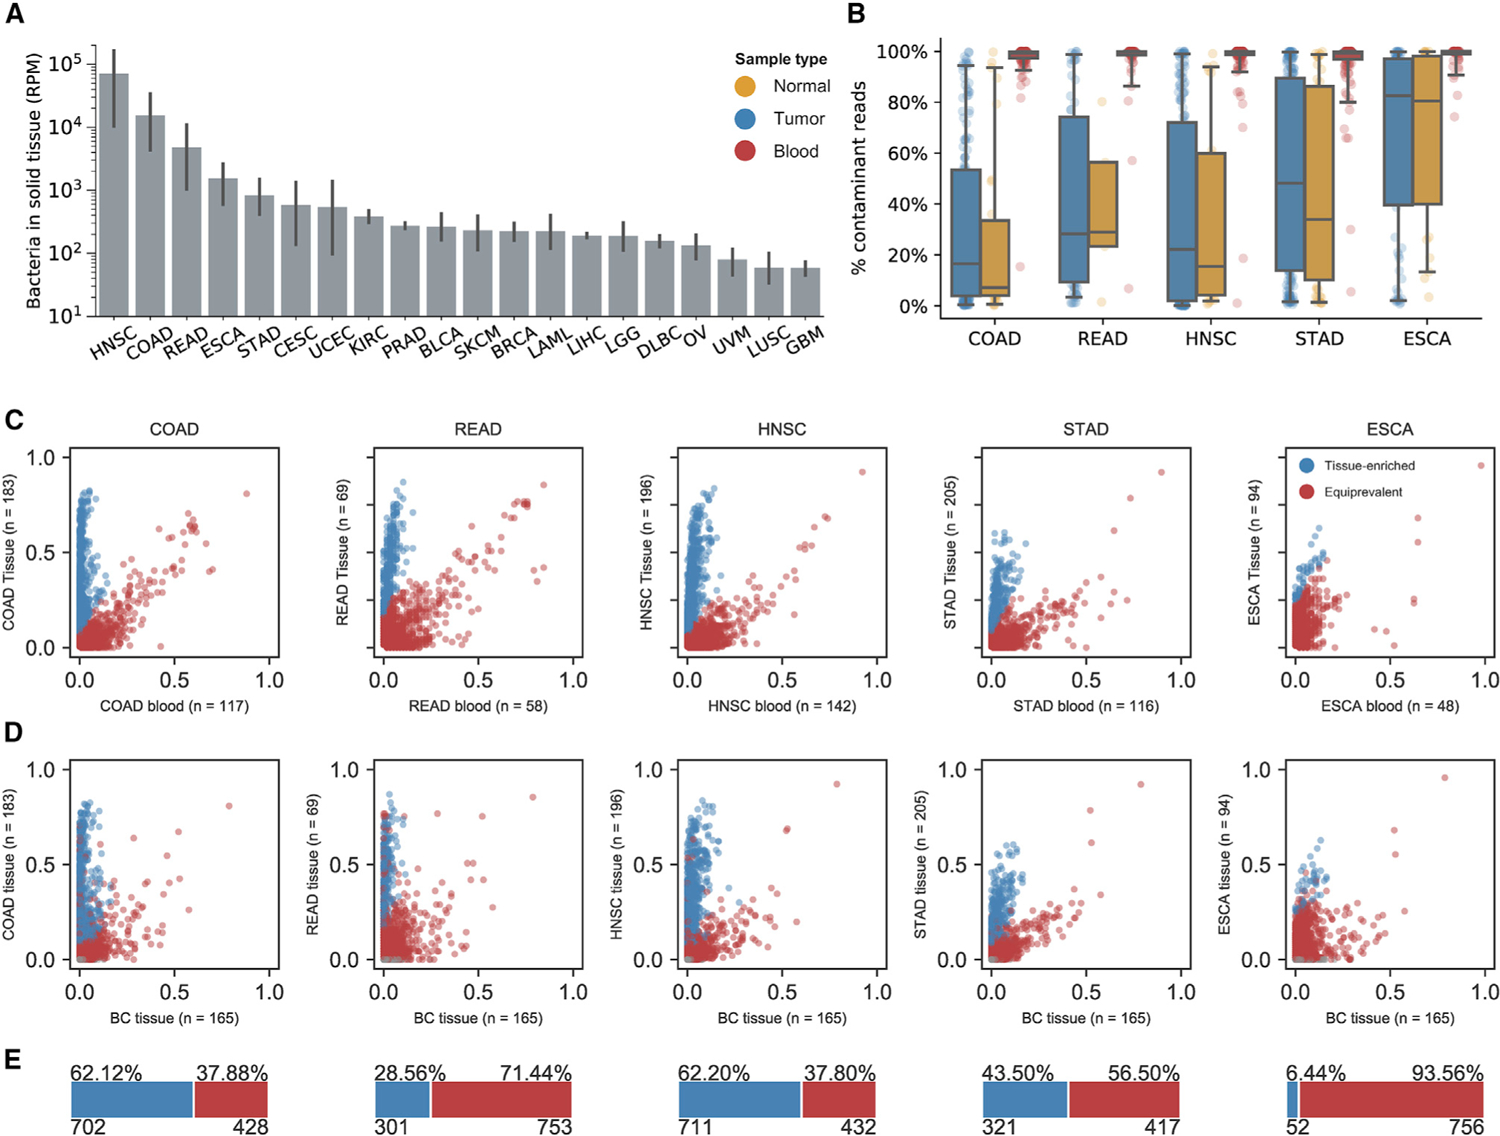
Studying the microbial composition of internal organs and their associations with disease remains challenging due to the difficulty of acquiring clinical biopsies. We designed a statistical model to analyze the prevalence of species across sample types from The Cancer Genome Atlas (TCGA), revealing that species equiprevalent across sample types are predominantly contaminants, bearing unique signatures from each TCGA-designated sequencing center. Removing such species mitigated batch effects and isolated the tissue-resident microbiome, which was validated by original matched TCGA samples. Gene copies and nucleotide variants can further distinguish mixed-evidence species. We, thus, present The Cancer Microbiome Atlas (TCMA), a collection of curated, decontaminated microbial compositions of oropharyngeal, esophageal, gastrointestinal, and colorectal tissues. This led to the discovery of prognostic species and blood signatures of mucosal barrier injuries and enabled systematic matched microbe-host multi-omic analyses, which will help guide future studies of the microbiome's role in human health and disease.

Keywords: colorectal cancer; contamination; host-microbe interactions; human microbiome; multi-omics; pan-cancer; the cancer genome atlas.


Conflict of interest statement

Declaration of interests The authors declare no competing interests.

Figures

Figure 1.
Figure 1.. WGS and WXS harbor colorectal bacterial reads distinct from blood and brain
See also Figure S1 (A) Matched analysis of bacterial sequencing reads per million (RPM) in normal tissue (yellow), tumor tissue (blue), and blood (red) from CRC and BC patients in TCGA. Significance is given by paired, one-sided t tests. (B) Abundance data from (A) but comparing solid tissue (pooled tumor and normal) with blood samples from BC (green) and CRC (brown) patients. Significance is given by one-sided t tests. (C) Comparison of bacterial species prevalence in WGS data for CRC blood and CRC tissue samples reveals populations of tissue-enriched species (blue) and species that are equiprevalent in blood and tissue (red). Black circles denote species associated with MBI. (D) Comparison of bacterial species prevalence in WGS data for CRC and BC samples reveals populations of CRC-enriched species (brown) and species that are equiprevalent in CRC and BC (green). (E) Relative abundance of bacterial phyla in WGS data for tissue (top) and blood (bottom) samples from CRC (left) and BC (right) patients. (F and G) Heat tree comparing relative abundance of bacteria in WGS data for (F) matched blood samples (red) versus tissue samples (blue) and (G) CRC tissue (brown) versus BC tissue (green).
Figure 2.
Figure 2.. Most equiprevalent taxa are common contaminants and associated with particular sequencing centers
See also Figure S2 (A) Genera commonly found in negative controls of metagenomic sequencing experiments (Eisenhofer et al., 2019) are highly prevalent in blood samples. (B) Prevalence of common contaminants in blood correlates with absolute abundance. (C) Genome size and temperature tolerance of equiprevalent species are differential (pW, Wilcoxon’s test) and more variable (pL, Levine’s test) than tissue-enriched species. (D) PCoA of WGS data for CRC samples reveals considerable variation between blood samples and tissue samples along the first axis of variation and batch effects along the second axis. (E) Heatmap clustering of bacterial species’ abundance in blood samples demonstrates the presence of center-specific contamination. The left vertical axis shows each species’ prevalence (gray). (F) The fraction of all bacterial reads that is contamination in normal (yellow), tumor (blue), and blood (red) samples from CRC patients. (G) The fraction of bacterial reads that is contamination in WGS data of normal (yellow), tumor (blue), and blood (red) from CRC patients, broken down by the five most prevalent phyla. (H) Correlations between centered log ratio (CLR)-transformed relative abundances of WGS and WXS data for the five most prevalent phyla in tissue samples. Phyla contributing the most contaminant reads have the lowest correlation between assays.
Figure 3.
Figure 3.. Detecting tissue-resident and contaminant species with gene-level resolution
See also Figure S3 (A–C) Prevalence of genes belonging to B. vulgatus (A; tissue-resident), A. junii (B; contaminant), and E. coli (C; mixed-evidence) in blood versus tissue. The large dot indicates species-level prevalence. (D–F) Kernel-density estimate of gene prevalence in blood (red) and tissue (blue) for B. vulgatus (A), A. junii (B), and E. coli (F). (G–I) Coverage of WGS reads aligning to genomes of B. vulgatus (G), A. junii (H), and E. coli (I) in blood (red) and tissue (blue). (J) Top 25 E. coli genes most significantly enriched in tissue. (K) Comparison of the prevalence of E. coli genes, cadA and ldcC, in blood (red) and tissue (blue). (L) Results of GO pathway analysis of tissue-enriched E. coli genes. *Indicates tissue-enriched E. coli genes
Figure 4.
Figure 4.. Decontamination removes sequencing center artifacts and original TCGA tissue and blood samples validate tissue-resident microbial compositions and equiprevalent species as contaminants, see also Figure S4; Table S1
(A) Abundance of WGS bacteria before and after decontamination. Samples with no reduction in bacterial reads lie along the gray line. Experiments with low microbial biomass a priori are disproportionally affected by decontamination. (B) Relative abundance of bacterial phyla in tissue samples before and after decontamination, sorted by their a priori abundance of Actinobacteria. (C) PCoA of the decontaminated, tissue-resident microbial component reveals retention of variation related to sample type but not sequencing center. (D) PCoA of the contaminant microbial component reveals retention of variation related to sequencing center but not sample type. (E and F) Prevalence of bacterial species in tissue samples sequenced at Baylor versus Harvard (E) before and (F) after removing contamination. (G) Comparison of weighted UniFrac distances before and after removing contamination among all tissues (left) and specifically matched tissues sequenced at both Baylor and Harvard (right). (H) Design of the validation experiment. Data are represented as mean ± 95% CI. (I) Bacterial diversity of 16S rRNA-seq results from tissue (blue), plasma (red), and controls (bottom panel). (J) Relative abundances in 16S results for tissue compared with tissue samples sequenced using WGS at Harvard and Baylor, before and after contamination.
Figure 5.
Figure 5.. Colorectal tissue microbiomes cluster into Fusobacterium and Bacteroides co-abundance groups predictive of host tissue molecular environment
See also Figure S5; Table S2 (A) Heatmap clustering of correlations between bacterial genera reveals anticorrelated clusters of genera, characterized by Bacteroides and Fusobacterium (purple triangles). Axes are colored according to species’ association with tumor (blue) or matched adjacent normal tissue (yellow). (B and C) (B) Bacteroides- and (C) Fusobacterium-associated co-abundance networks. Node size is proportional to the prevalence of the genera in tissue samples, and node hue is proportional to abundance. (D and E) Co-abundance groups are predictive of gene expression (D; RNA-seq) and protein expression (E; RPPA). (F) Heat tree comparing bacterial taxa abundance in tumor samples (blue) or matched normal tissue (yellow). (G) Survival analysis p values of species in the Bacteroides and Fusobacterium co-abundance groups. (H) OS curves for Bacteroides spp.
Figure 6.
Figure 6.. Microbial presence in CRC tissue is predictive of host gene expression pathways and MBI See also Figure S6
(A) Correlation between host gene expression (columns) and CLR-transformed species abundances (rows). Rows are colored according to each species’ association with tumor (blue) or normal tissue (yellow). (B–D) Comparison of differentially abundant species and their association with tissue type (x axis) versus enrichment score (y axis) for KEGG terms (A) “natural killer cell-mediated cytotoxicity” (B), “DNA replication” (C), and “cell adhesion molecules” (D). (E) Bacterial species implicated in MBI are more prevalent in decontaminated blood samples than other species. (F) Bacterial genera implicated in MBI (red) are more abundant in CRC blood (brown) than BC blood (green), in contrast to some commensal species (blue).
Figure 7.
Figure 7.. Contamination-adjusted tissue microbiome profiles for all gastrointestinal cancers in TCGA
See also Figure S7 (A) Pan-cancer abundance of bacteria in solid tissue samples from TCGA projects prior to decontamination. Data are represented as mean ± 95% CI. (B) Estimated fraction of contaminant reads for sequencing experiments on tumor (blue), normal (yellow), and blood (red) samples for each sequencing project in TCMA. (C) Classification of tissue-resident (blue) and contaminant (red) species across TCGA gastrointestinal tissues by comparison of prevalence in blood and tissue. (D) Labeling of tissue-resident (blue) and contaminant (red) species across gastrointestinal tissues by comparison of prevalence in brain tissue and disease-specific tissue, using classification from (C). (E) Estimated proportions of tissue-resident (blue) and contaminant (red) species for each TCGA project.

References

    1. Abdulamir AS, Hafidh RR, and Abu Bakar F (2011). The association of Streptococcus bovis/gallolyticus with colorectal tumors: the nature and the underlying mechanisms of its etiological role. J. Exp. Clin. Cancer Res 30, 11. - PMC - PubMed
    1. Arthur JC, Perez-Chanona E, Mühlbauer M, Tomkovich S, Uronis JM, Fan TJ, Campbell BJ, Abujamel T, Dogan B, Rogers AB, et al. (2012). Intestinal inflammation targets cancer-inducing activity of the microbiota. Science 338, 120–123. - PMC - PubMed
    1. Bolyen E, Rideout JR, Dillon MR, Bokulich NA, Abnet CC, Al-Ghalith GA, Alexander H, Alm EJ, Arumugam M, Asnicar F, et al. (2019). Reproducible, interactive, scalable and extensible microbiome data science using QIIME 2. Nat. Biotechnol 37, 852–857. - PMC - PubMed
    1. Brighenti E, Calabrese C, Liguori G, Giannone FA, Treré D, Montanaro L, and Derenzini M (2014). Interleukin 6 downregulates p53 expression and activity by stimulating ribosome biogenesis: a new pathway connecting inflammation to cancer. Oncogene 33, 4396–4406. - PMC - PubMed
    1. Bullman S, Lucid A, Corcoran D, Sleator RD, and Lucey B (2013). Genomic investigation into strain heterogeneity and pathogenic potential of the emerging gastrointestinal pathogen Campylobacter ureolyticus. PLoS One 8, e71515. - PMC - PubMed

Publication types

MeSH terms

Substances