. 2021 Feb 18;81(4):691-707.e6.
doi: 10.1016/j.molcel.2020.12.012. Epub 2020 Dec 30.

Increased demand for NAD+ relative to ATP drives aerobic glycolysis

Affiliations

Increased demand for NAD+ relative to ATP drives aerobic glycolysis

Alba Luengo et al. Mol Cell. .

Abstract

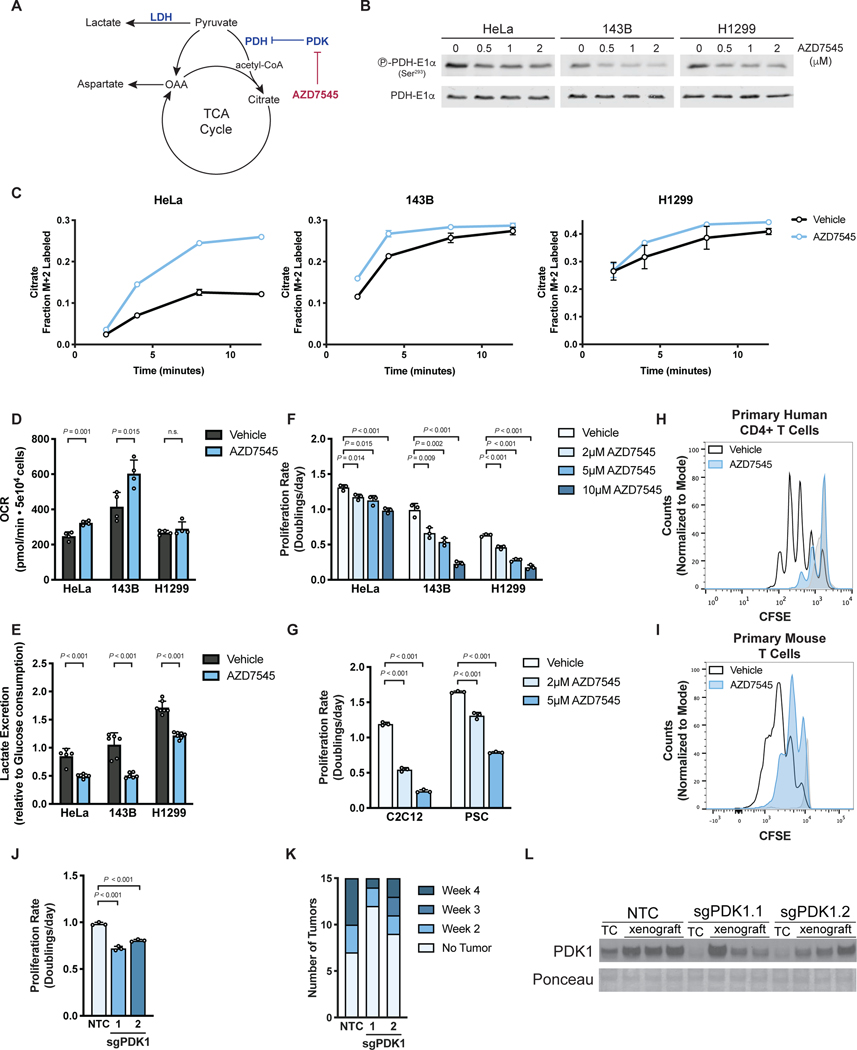
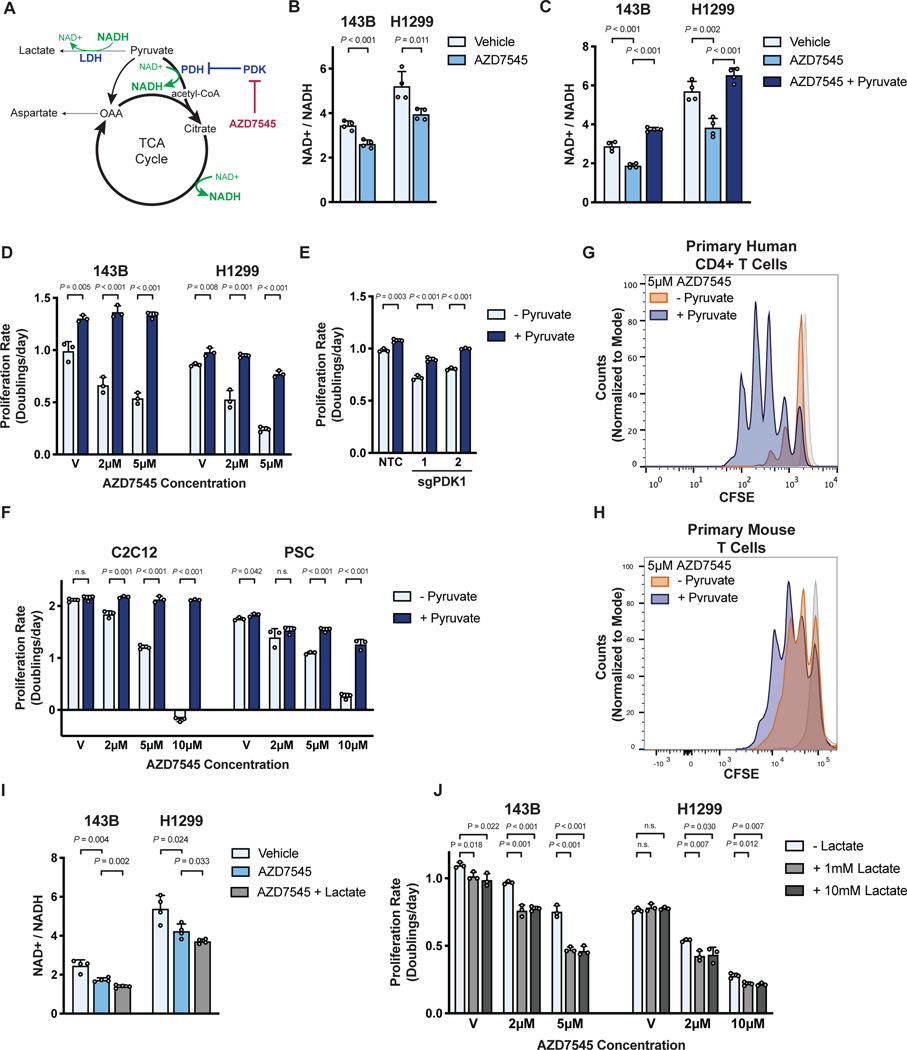
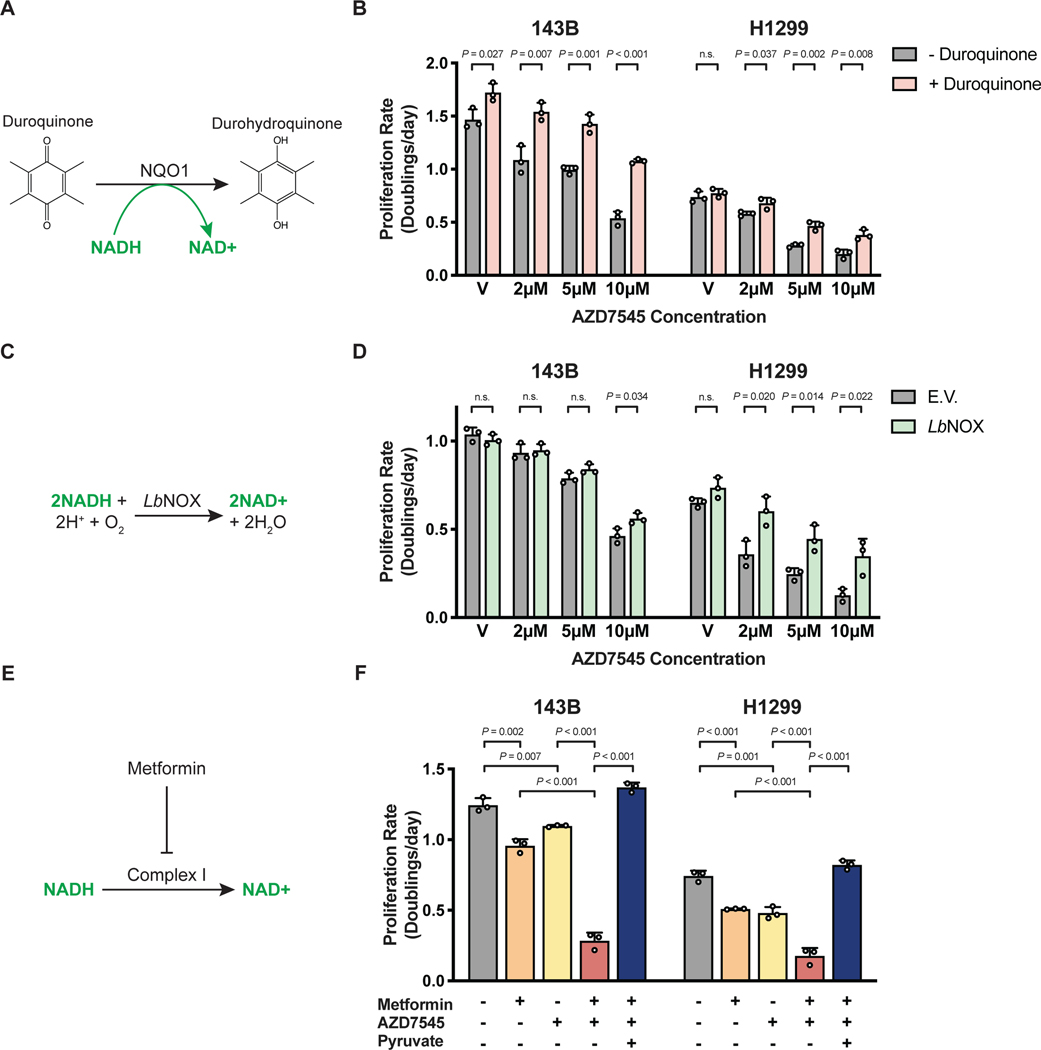
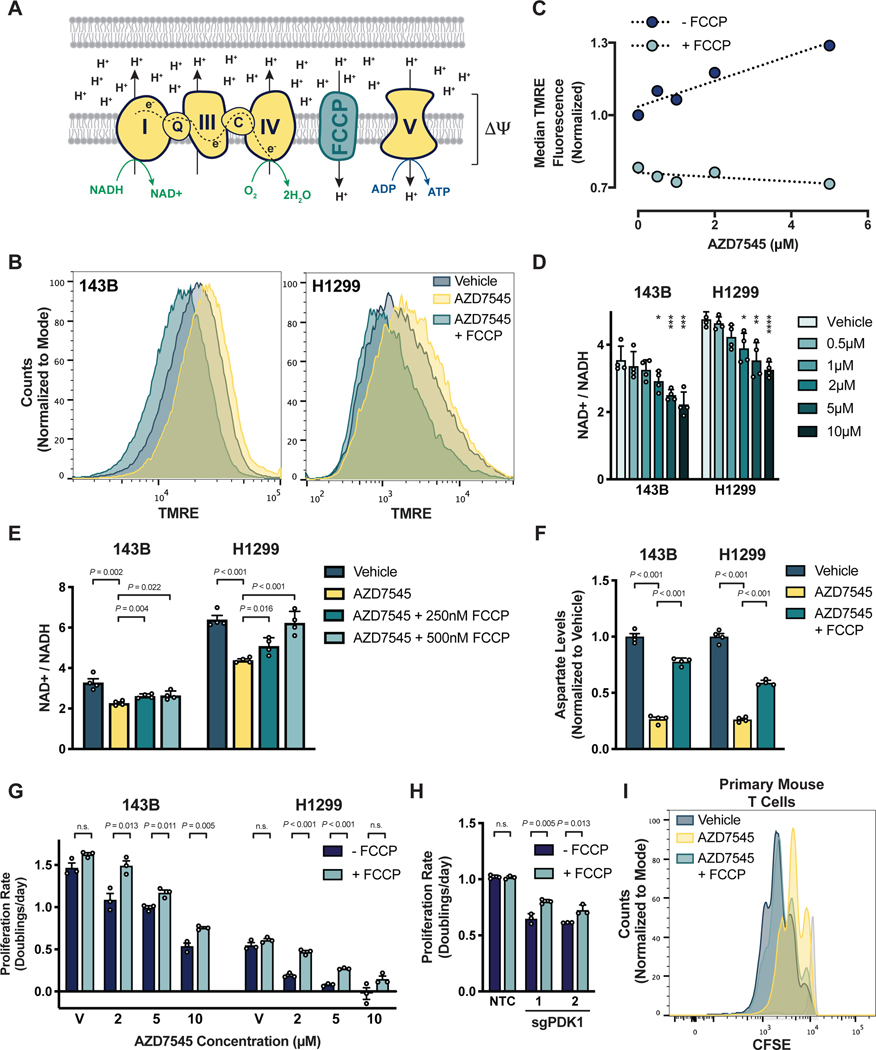
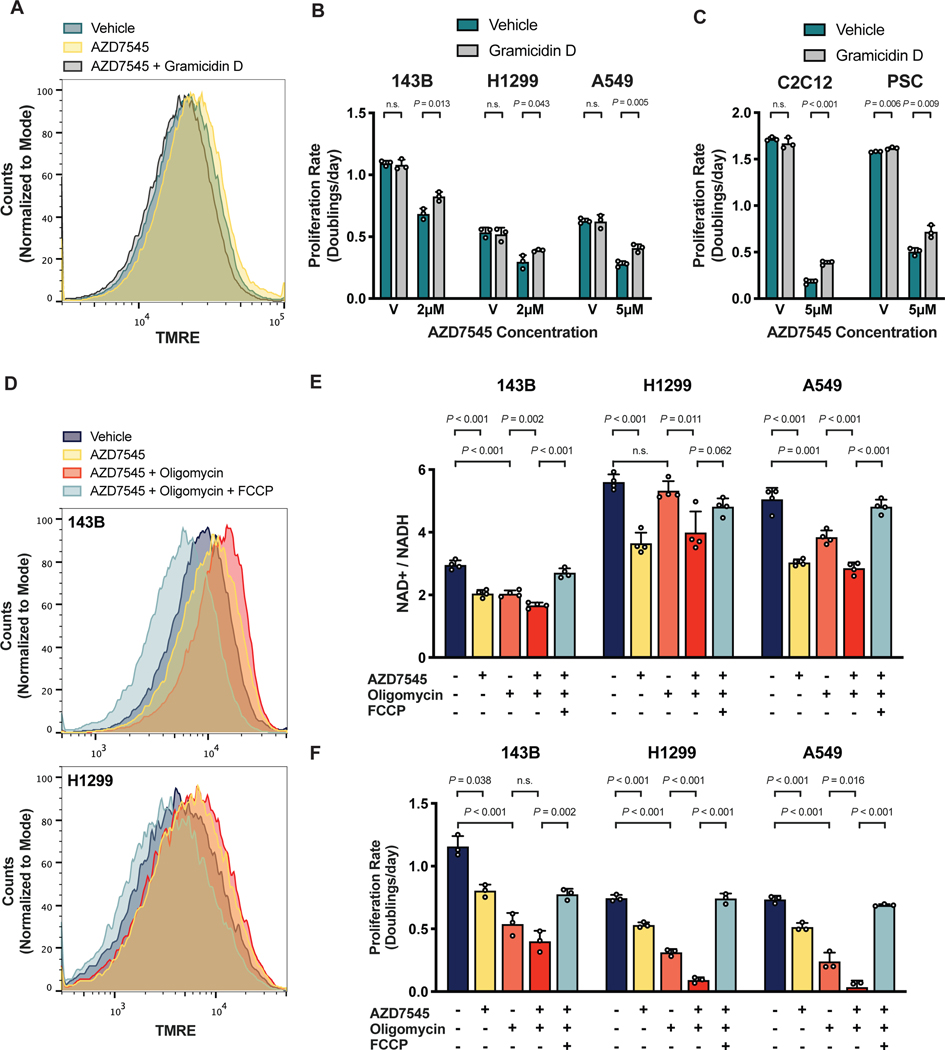
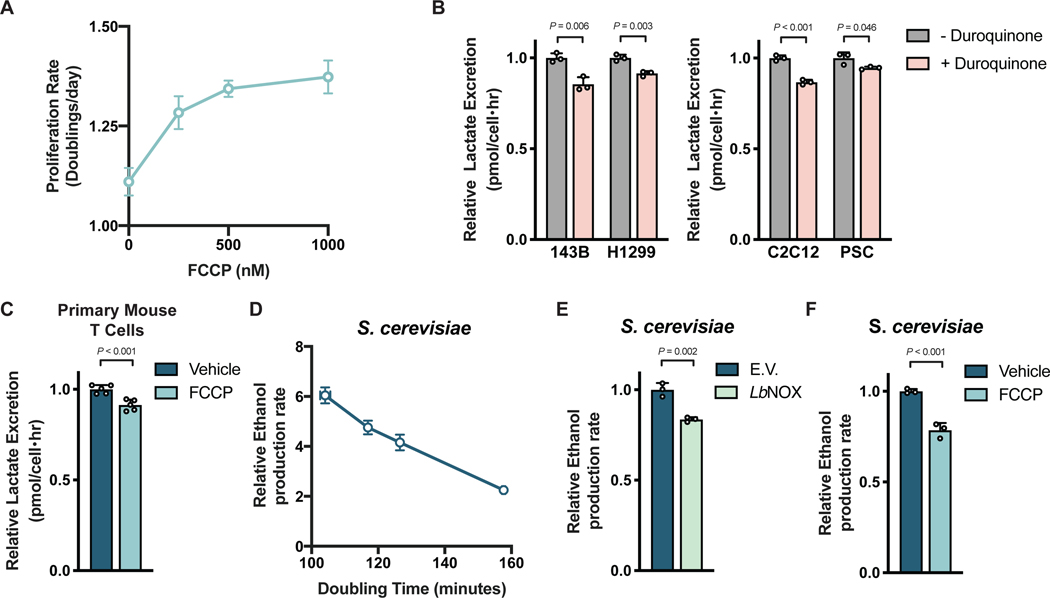
Aerobic glycolysis, or preferential fermentation of glucose-derived pyruvate to lactate despite available oxygen, is associated with proliferation across many organisms and conditions. To better understand that association, we examined the metabolic consequence of activating the pyruvate dehydrogenase complex (PDH) to increase pyruvate oxidation at the expense of fermentation. We find that increasing PDH activity impairs cell proliferation by reducing the NAD+/NADH ratio. This change in NAD+/NADH is caused by increased mitochondrial membrane potential that impairs mitochondrial electron transport and NAD+ regeneration. Uncoupling respiration from ATP synthesis or increasing ATP hydrolysis restores NAD+/NADH homeostasis and proliferation even when glucose oxidation is increased. These data suggest that when demand for NAD+ to support oxidation reactions exceeds the rate of ATP turnover in cells, NAD+ regeneration by mitochondrial respiration becomes constrained, promoting fermentation, despite available oxygen. This argues that cells engage in aerobic glycolysis when the demand for NAD+ is in excess of the demand for ATP.

Keywords: Aerobic Glycolysis; Cell Metabolism; Fermentation; NAD+; PDK; Warburg Effect.


Conflict of interest statement

Declaration of interests The authors declare no competing interests; however, M.G.V.H. discloses he is on the advisory board of Molecular Cell and is a scientific advisor for Agios Pharmaceuticals, Aeglea Biotherapeutics, Auron Therapeutics, Faeth Therapeutics, and iTeos Therapeutics. S.S. is member of the scientific advisory board of Arcus Biosciences, Venn Therapeutics, Tango Therapeutics, and Replimune and serves as a scientific advisor for Dragonfly Therapeutics, Merck, Ribon, Torque, and TAKEDA. A.L. is a current employee of a Flagship Pioneering biotechnology start-up company.

Figures

Figure 1.
Figure 1.. Activation of PDH suppresses aerobic glycolysis and proliferation
(A) Pyruvate has several fates in cells, including metabolism to lactate by lactate dehydrogenase (LDH) or oxidation by pyruvate dehydrogenase (PDH) to acetyl-CoA for entry into the tricarboxylic acid (TCA) cycle. PDH is negatively regulated by pyruvate dehydrogenase kinase (PDK) enzymes, which are inhibited by the compound AZD7545. (B) Western blot to assess S293 phosphorylation of the PDH-E1α enzyme subunit in HeLa, 143B, and H1299 cells treated with vehicle or AZD7545 for 2 hours. Total PDH-E1α expression was also assessed. (C) Kinetic labeling of citrate from 13C-labeled glucose to assess PDH flux with and without PDK inhibition by AZD7545. HeLa, 143B and H1299 cells were incubated for 5 hours in media containing 5 mM unlabeled glucose with vehicle or 0.5 μM AZD7545, after which 20 mM [U-13C6]glucose was added. The fraction of M+2 citrate was measured by LCMS after the addition of 13C-labeled glucose (n = 3). (D) Oxygen consumption rate (OCR) of cells treated with vehicle or 0.5 μM AZD7545 for 5 hours (n = 4). (E) Lactate excretion into culture media normalized to glucose consumption of cells treated with vehicle or 0.25 μM AZD7545 for 48 hours (n = 5). (F) Proliferation rate of 143B, H1299, and HeLa cells treated with vehicle or AZD7545 as indicated (n = 3). (G) Proliferation rate of C2C12 myoblasts or mouse pancreatic stellate cells (PSC) cultured in vehicle or AZD7545 as indicated (n = 3). (H) Proliferation of primary human CD4+ T cells cultured in vehicle or 5 μM AZD7545. Human CD4+ T cells were stained with CFSE prior to stimulation with anti-CD3/CD28 dynabeads, and CFSE fluorescence was assessed by flow cytometry after 4 days. Representative data are shown from 3 biological replicates of primary human CD4+ T cells collected from different donors and analyzed as independent experiments. Stained, unstimulated cells (light grey) that did not proliferate are also shown. (I) Proliferation of primary mouse T cells cultured in vehicle or 5 μM AZD7545. Mouse T cells were stained with CFSE prior to stimulation with anti-CD3/CD28 antibodies, and CFSE fluorescence was assessed by flow cytometry after 2 days. Stained, unstimulated cells (light grey) that did not proliferate are also shown. (J) Proliferation rate of 143B cells in which CRISPR interference (CRISPRi) was used to repress PDK1 expression. Cells were transduced with sgRNA targeting PDK1 (two independently targeted lines) or a non-targeting control (NTC) as indicated (n = 3). (K) Histogram indicating the number of weeks at which the cell lines described in (J) formed xenograft tumors larger than 50 mm3 in nude mice (n = 15). (L) Western blot analysis to assess PDK1 expression in the cells shown in panel (J) when cultured in vitro (TC) or after being isolated from the xenografts described in (K) after 34 days. Values in panels C, D, E, F, G, and J denote mean ± SD. P values were calculated by unpaired, two-tailed Student’s t-test (n.s. = not significant).
Figure 2.
Figure 2.. PDK inhibition slows cell proliferation by reducing the NAD+/NADH ratio
(A) PDK inhibition by AZD7545 decreases the NAD+/NADH ratio by promoting flux through NAD+ consuming pathways, including PDH and the TCA cycle, while limiting pyruvate conversion to lactate by LDH. (B) NAD+/NADH ratio of 143B and H1299 cells cultured in vehicle or 5 μM AZD7545 for 5 hours (n = 4). (C) NAD+/NADH ratio of 143B and H1299 cells treated with vehicle, 5 μM AZD7545, or 5 μM AZD7545 with 1 mM pyruvate (n = 4). (D) Proliferation rate of 143B and H1299 cells cultured in vehicle (V) or the indicated concentration of AZD7545 in the presence (dark blue) or absence (light blue) of 1 mM pyruvate (n = 3). (E) Proliferation rate of 143B cells in which CRISPRi was used to repress PDK1. Cells were transduced with sg PDK1 (two independently targeted lines) or sgNTC and grown in the presence or absence of 1 mM pyruvate (n = 3). (F) Proliferation rate of C2C12 myoblasts and pancreatic stellate cells (PSC) in media with vehicle (V) or AZD7545 supplemented with or without 1 mM pyruvate (n = 3). (G) Proliferation of primary human CD4+ T cells treated with 5 μM AZD7545 with or without 1 mM pyruvate. Human CD4+ T cells were stained with CFSE prior to stimulation with CD3/CD28 dynabeads, and CFSE fluorescence was assessed by flow cytometry after 4 days. Representative data are shown from 3 biological replicates of primary human CD4+ T cells collected from different donors and analyzed as independent experiments. Stained, unstimulated cells (light grey) that did not proliferate are shown. (H) Proliferation of primary mouse T cells treated with 5 μM AZD7545 with or without 1 mM pyruvate. Mouse T cells were stained with CFSE prior to stimulation with anti-CD3/CD28 antibodies. CFSE fluorescence was assessed by flow cytometry after 2 days. Stained, unstimulated cells (light grey) that did not proliferate are shown. (I) NAD+/NADH ratio of 143B and H1299 cells cultured in vehicle, 5 μM AZD7545, or 5 μM AZD7545 with 10 mM lactate (n = 4). (J) Proliferation rate of 143B and H1299 cells treated with vehicle (V) or AZD7545 with or without 1 mM or 10 mM lactate as indicated (n = 3). Values in panels B, C, D, E, F, I and J denote mean ± SD. P values were calculated by unpaired, two-tailed Student’s t-test (n.s. = not significant).
Figure 3.
Figure 3.. Interventions that alter NAD+ availability can modulate the antiproliferative effects of PDK inhibition
(A) Duroquinone increases NAD+ regeneration via the enzyme NAD(P)H dehydrogenase, quinone 1 (NQO1), which reduces duroquinone to durohydroquinone using NADH as a cofactor. (B) Proliferation rate of 143B and H1299 cells treated with vehicle (V) or AZD7545 in the absence or presence of duroquinone (20 μM for 143B and 100 μM for H1299 cells; n = 3). (C) Schematic illustrating the reaction catalyzed by the NADH oxidase from Lactobacillus brevis (LbNOX). (D) Proliferation rate of 143B and H1299 cells transduced with empty vector (E.V.) or an LbNOX expression vector and treated with vehicle (V) or AZD7545. Doxycycline (500 ng/mL) was included in all conditions (n = 3). (E) Schematic illustrating the redox consequences of metformin treatment. (F) Proliferation rate of 143B and H1299 cells treated with 500 μM metformin, AZD7545 (5 μM for 143B, 3 μM for H1299 cells), and 1 mM pyruvate as indicated (n = 3). Values in panels B, D, and F denote mean ± SD. P values were calculated by unpaired, two-tailed Student’s t-test (n.s. = not significant).
Figure 4.
Figure 4.. PDK inhibition induces mitochondria hyperpolarization and limits NAD+ regeneration by respiration
(A) Schematic illustrating the mitochondrial electron transport chain and how FCCP (trifluoromethoxy carbonylcyanide phenylhydrazone) uncouples electron transfer from NADH to O2 from ATP production by the FoF1-ATP synthase (Complex V). ΔΨ denotes the mitochondrial membrane potential. (B) Mitochondrial membrane potential, as reflected by TMRE (tetramethylrhodamine, ethyl ester) fluorescence, in 143B and H1299 cells treated with vehicle, 5 μM AZD7545, or 5 μM AZD7545 with 500 nM FCCP. (C) Mitochondrial membrane potential, as reflected by TMRE fluorescence, in H1299 cells that had been treated with the indicated concentration of AZD7545, with or without 500 nM FCCP. TMRE fluorescence of 50,000 cells was quantified by flow cytometry and normalized to the vehicle-treated condition without FCCP. (D) NAD+/NADH ratio of 143B and H1299 cells cultured in vehicle or AZD7545 for 5 hours (n = 4) (E) NAD+/NADH ratio of 5143B and H1299 cells treated with vehicle, 5 μM AZD7545, or 5 μM AZD7545 with the indicated concentration of FCCP for 5 hours (n = 4). (F) Aspartate levels in 143B and H1299 cells cultured in vehicle, 2 μM AZD7545, or 2 μM AZD7545 with 250 nM FCCP for 5 hours as measured by LCMS (n = 4). (G) Proliferation rate of 143B and H1299 cells treated with vehicle (V) or AZD7545 with or without 500 nM FCCP as indicated (n = 3). (H) Proliferation rate of 143B cells in which CRISPRi was used to repress PDK1 expression. Cells were transduced with sgPDK1 (two independently targeted lines) or sgNTC and cultured with or without 750 nM FCCP (n = 3). (I) Proliferation of primary mouse T cells cultured in vehicle, 5 μM AZD7545, or 5 μM AZD7545 with 500 nM FCCP was assessed by CFSE dye dilution. Mouse T cells were stained with CFSE prior to stimulation with anti-CD3/CD28 antibodies and CFSE fluorescence was assessed by flow cytometry after 2 days. Stained, unstimulated cells (light grey) that did not proliferate are shown. Values in panels D, E, F, G, and H denote mean ± SD. P values were calculated by unpaired, two-tailed Student’s t-test (*, **, ***, and **** denote P < 0.05, 0.01, 0.005, and 0.001; n.s. = not significant).
Figure 5.
Figure 5.. NAD+ regeneration by respiration is limited by the rate of mitochondrial ATP production
(A) Mitochondrial membrane potential, as reflected by TMRE fluorescence, of 143B cells cultured in vehicle, 2 μM AZD754, or 2 μM AZD754 with 5 nM gramicidin D for 5 hours. (B) Proliferation rate of 143B, H1299 and A549 cells treated with vehicle (V) or AZD7545 in the presence or absence of 0.5 nM gramicidin D (n = 3). (C) Proliferation rate C2C12 myoblasts or pancreatic stellate cells (PSC) cultured with vehicle (V) or AZD7545 with or without 1 nM gramicidin D (n = 3). (D) Mitochondrial membrane potential, as reflected by TMRE fluorescence, of 143B cells cultured for 5 hours with vehicle, 2 μM AZD7545, 1 nM oligomycin, and 1 μM FCCP as indicated. (E) NAD+/NADH ratio of 143B, H1299, and A549 cells in vehicle, 5 μM AZD7545, 0.5 nM oligomycin, and 1 μM FCCP as indicated (n = 4). (F) Proliferation rate of 143B, H1299, and A549 cells in vehicle, 5 μM AZD7545, 0.5 nM oligomycin and 1 μM FCCP as indicated (n = 3). Values in panels B, C, E, and F denote mean ± SD. P values were calculated by unpaired, two-tailed Student’s t-test (n.s. = not significant).
Figure 6.
Figure 6.. Aerobic glycolysis reflects cellular NAD+ availability
(A) The proliferation rate of 143B cells treated with FCCP as indicated (n = 3). (B) Relative lactate excretion of cells cultured with or without duroquinone (4μM, 16μM, 8μM and 64μM for 143B, H1299, C2C12, and PSC cells, respectively; n = 3). (C) Relative lactate excretion of primary mouse T cells stimulated with anti-CD3/CD28 antibodies in the presence or absence of 250 nM FCCP for 1 day (n = 5). (D) The relationship between ethanol production and proliferation rate in S. cerevisiae as determined by altering glucose concentration in culture medium. (E) Relative ethanol production rate by S. cerevisiae expressing empty vector (E.V.) or LbNOX in standard medium containing 3% glucose (n = 3). (F) Relative ethanol production rate by S. cerevisiae treated with vehicle or 2 μM FCCP in standard medium containing 3% glucose (n = 3). Values denote mean ± SD. P values were calculated by unpaired, two-tailed Student’s t-test (n.s. = not significant).

Comment in

References

    1. Baksh SC, Todorova PK, Gur-Cohen S, Hurwitz B, Ge Y, Novak JSS, Tierney MT, Dela Cruz-Racelis J, Fuchs E, and Finley LWS (2020). Extracellular serine controls epidermal stem cell fate and tumour initiation. Nat Cell Biol. - PMC - PubMed
    1. Bao XR, Ong SE, Goldberger O, Peng J, Sharma R, Thompson DA, Vafai SB, Cox AG, Marutani E, Ichinose F, et al. (2016). Mitochondrial dysfunction remodels one-carbon metabolism in human cells. Elife 5. - PMC - PubMed
    1. Basan M, Hui S, Okano H, Zhang Z, Shen Y, Williamson JR, and Hwa T. (2015). Overflow metabolism in Escherichia coli results from efficient proteome allocation. Nature 528, 99–104. - PMC - PubMed
    1. Bertholet AM, Chouchani ET, Kazak L, Angelin A, Fedorenko A, Long JZ, Vidoni S, Garrity R, Cho J, Terada N, et al. (2019). H(+) transport is an integral function of the mitochondrial ADP/ATP carrier. Nature 571, 515–520. - PMC - PubMed
    1. Birsoy K, Wang T, Chen WW, Freinkman E, Abu-Remaileh M, and Sabatini DM (2015). An Essential Role of the Mitochondrial Electron Transport Chain in Cell Proliferation Is to Enable Aspartate Synthesis. Cell 162, 540–551. - PMC - PubMed

Publication types

LinkOut - more resources