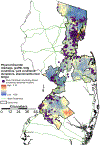
Visual cues of the built environment and perceived stress among a cohort of black breast cancer survivors
- PMID: 33383367
- PMCID: PMC8243540
- DOI: 10.1016/j.healthplace.2020.102498
Visual cues of the built environment and perceived stress among a cohort of black breast cancer survivors
Abstract
We investigated relationships between independently observed, visual cues of residential environments and subsequent participant-reported stress within a population-based cohort of Black breast cancer survivors (n = 476). Greater visual cues of engagement - presence of team sports, yard decorations, outdoor seating - (compared to less engagement) was marginally associated with lower perceived stress in univariate models, but attenuated towards null with adjustment for socio-demographic, behavioral, and health-related covariates. Similarly, physical disorder and perceived stress were not associated in adjusted models. Relationships between observed built environment characteristics and perceived stress might be influenced by socioeconomic and health behavior factors, which longitudinal studies should investigate.
Keywords: Black women; Breast cancer survivors; Built environment; Neighborhood audit; Perceived stress.
Copyright © 2020 The Authors. Published by Elsevier Ltd.. All rights reserved.
Conflict of interest statement
Declaration of competing interest
All authors report no conflicts of interest.
Figures


Similar articles
-
Neighborhood Disadvantage, African Genetic Ancestry, Cancer Subtype, and Mortality Among Breast Cancer Survivors.JAMA Netw Open. 2023 Aug 1;6(8):e2331295. doi: 10.1001/jamanetworkopen.2023.31295. JAMA Netw Open. 2023. PMID: 37647068 Free PMC article.
-
Prognostic factors for return to work in breast cancer survivors.Cochrane Database Syst Rev. 2025 May 7;5(5):CD015124. doi: 10.1002/14651858.CD015124.pub2. Cochrane Database Syst Rev. 2025. PMID: 40331515 Review.
-
Participation in environmental enhancement and conservation activities for health and well-being in adults: a review of quantitative and qualitative evidence.Cochrane Database Syst Rev. 2016 May 21;2016(5):CD010351. doi: 10.1002/14651858.CD010351.pub2. Cochrane Database Syst Rev. 2016. PMID: 27207731 Free PMC article.
-
The built environment and cancer survivorship: A scoping review.Health Place. 2024 Mar;86:103206. doi: 10.1016/j.healthplace.2024.103206. Epub 2024 Feb 21. Health Place. 2024. PMID: 38387361 Free PMC article.
-
Multilevel Stressors and Systemic and Tumor Immunity in Black and White Women With Breast Cancer.JAMA Netw Open. 2025 Feb 3;8(2):e2459754. doi: 10.1001/jamanetworkopen.2024.59754. JAMA Netw Open. 2025. PMID: 39951265 Free PMC article.
Cited by
-
Validating a spatio-temporal model of observed neighborhood physical disorder.Spat Spatiotemporal Epidemiol. 2022 Jun;41:100506. doi: 10.1016/j.sste.2022.100506. Epub 2022 Mar 24. Spat Spatiotemporal Epidemiol. 2022. PMID: 35691640 Free PMC article.
-
Pathways between objective and perceived neighborhood factors among Black breast cancer survivors.BMC Public Health. 2021 Nov 6;21(1):2031. doi: 10.1186/s12889-021-12057-0. BMC Public Health. 2021. PMID: 34742279 Free PMC article.
-
Impact of Structural Racism and Social Determinants of Health on Disparities in Breast Cancer Mortality.Cancer Res. 2024 Dec 2;84(23):3924-3935. doi: 10.1158/0008-5472.CAN-24-1359. Cancer Res. 2024. PMID: 39356624 Free PMC article. Review.
-
Associations between observed neighborhood physical disorder and health behaviors, New Jersey behavioral risk factor Surveillance System 2011-2016.Prev Med Rep. 2023 Feb 9;32:102131. doi: 10.1016/j.pmedr.2023.102131. eCollection 2023 Apr. Prev Med Rep. 2023. PMID: 36852306 Free PMC article.
-
Using street view imagery to examine the association between urban neighborhood disorder and the long-term recurrence risk of patients discharged with acute myocardial infarction in central Beijing, China.Cities. 2023 May 17;138:104366. doi: 10.1016/j.cities.2023.104366. Cities. 2023. PMID: 37250183 Free PMC article.
References
-
- Bailey ZD, et al., 2017. Structural racism and health inequities in the USA: evidence and interventions. Lancet 389 (10077), 1453–1463. - PubMed
Publication types
MeSH terms
Grants and funding
LinkOut - more resources
Full Text Sources
Other Literature Sources
Medical

