

Meta-analysis of brain metabolite differences in HIV infection
- PMID: 33383609
- PMCID: PMC7596344
- DOI: 10.1016/j.nicl.2020.102436
Meta-analysis of brain metabolite differences in HIV infection
Abstract
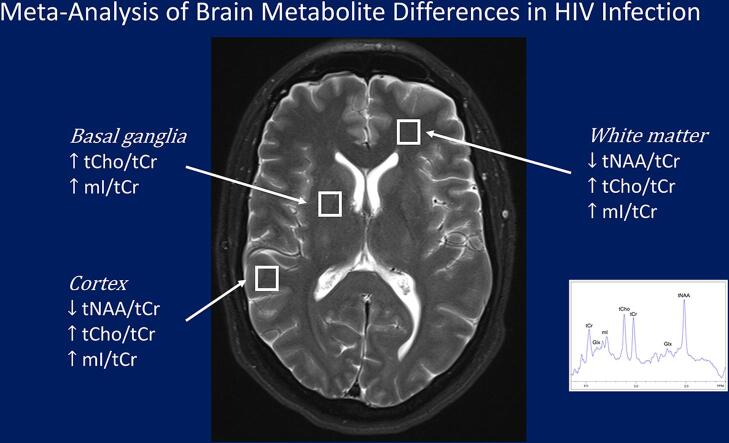
Background: Numerous studies have used magnetic resonance spectroscopy (MRS) neurometabolite measurements to study HIV infection effects. While many have reported differences in total N-Acetylaspartate (tNAA), myo-Inositol (mI), and total Choline (tCho), there have been no meta-analyses performed to evaluate concordance across studies.
Purpose: To evaluate the consistency of HIV serostatus effects on brain metabolites.
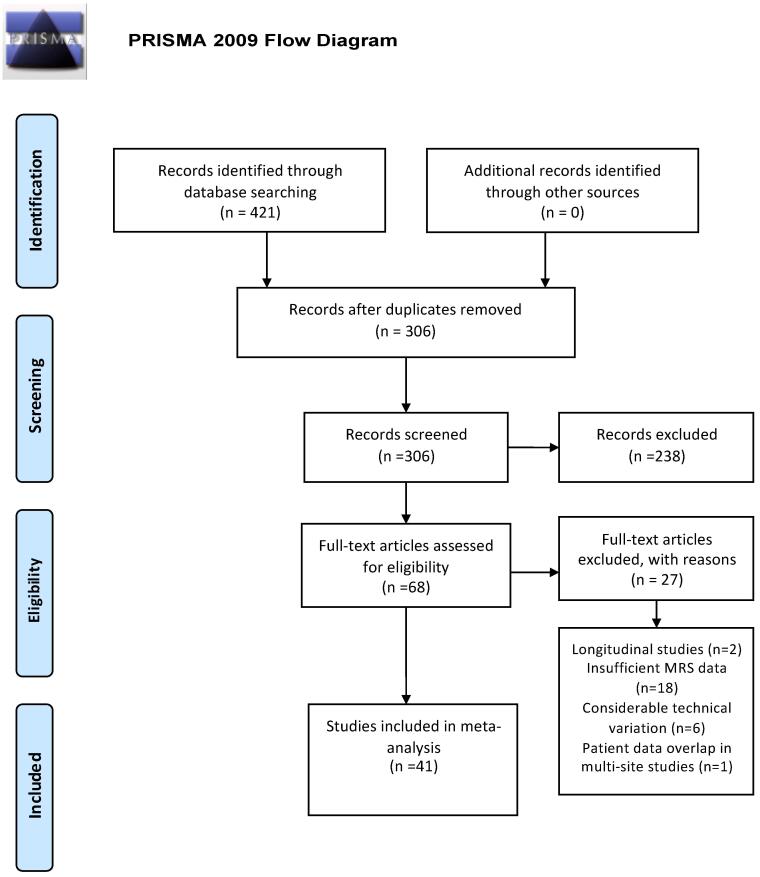
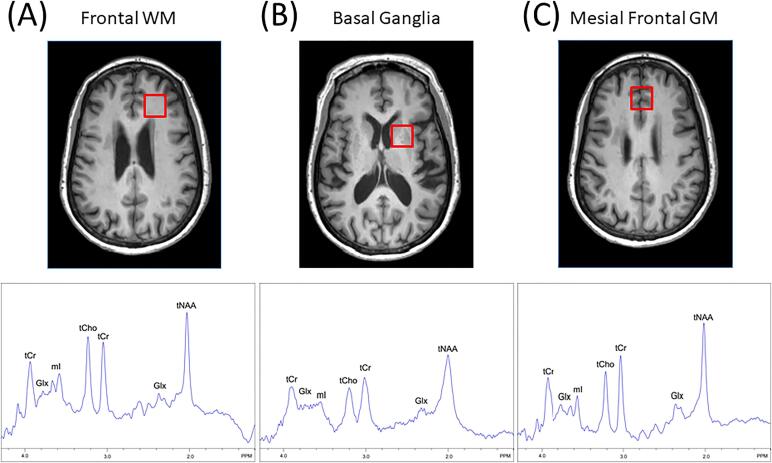
Study selection: The sample included studies conducted between 1993 and 2019 reporting HIV infection effects measured using proton MRS. tNAA/tCr ratios (21 papers), tCho/tCr ratios (21 papers), mI/tCr ratios (17 papers) and quantitative tCr (9 papers), sampling from basal ganglia (BG), gray matter (GM), and white matter (WM) were included.
Data analysis: Random effects meta-analysis using inverse variance weighting and bias corrected standardized mean differences (SMDs) was used. Meta-regression examined effects of publication year and data acquisition technique differences.
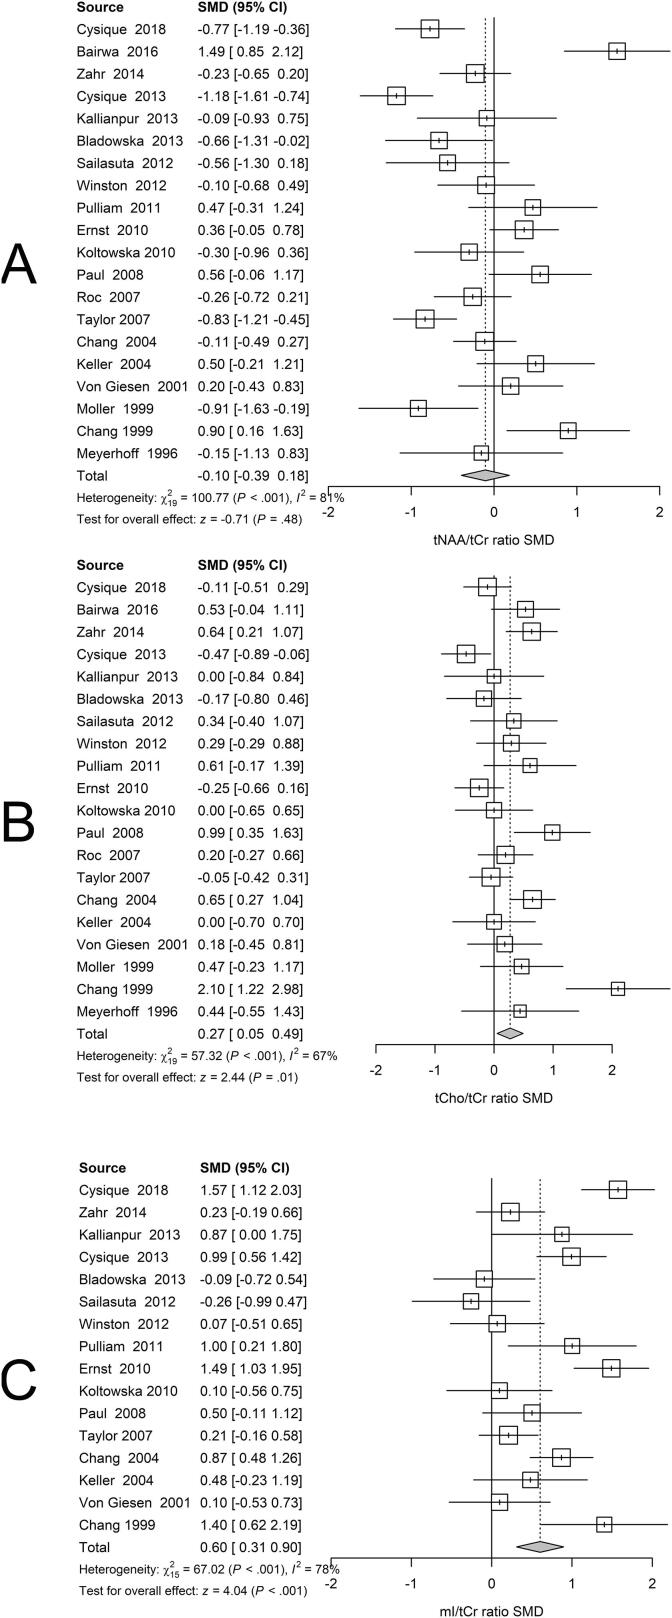
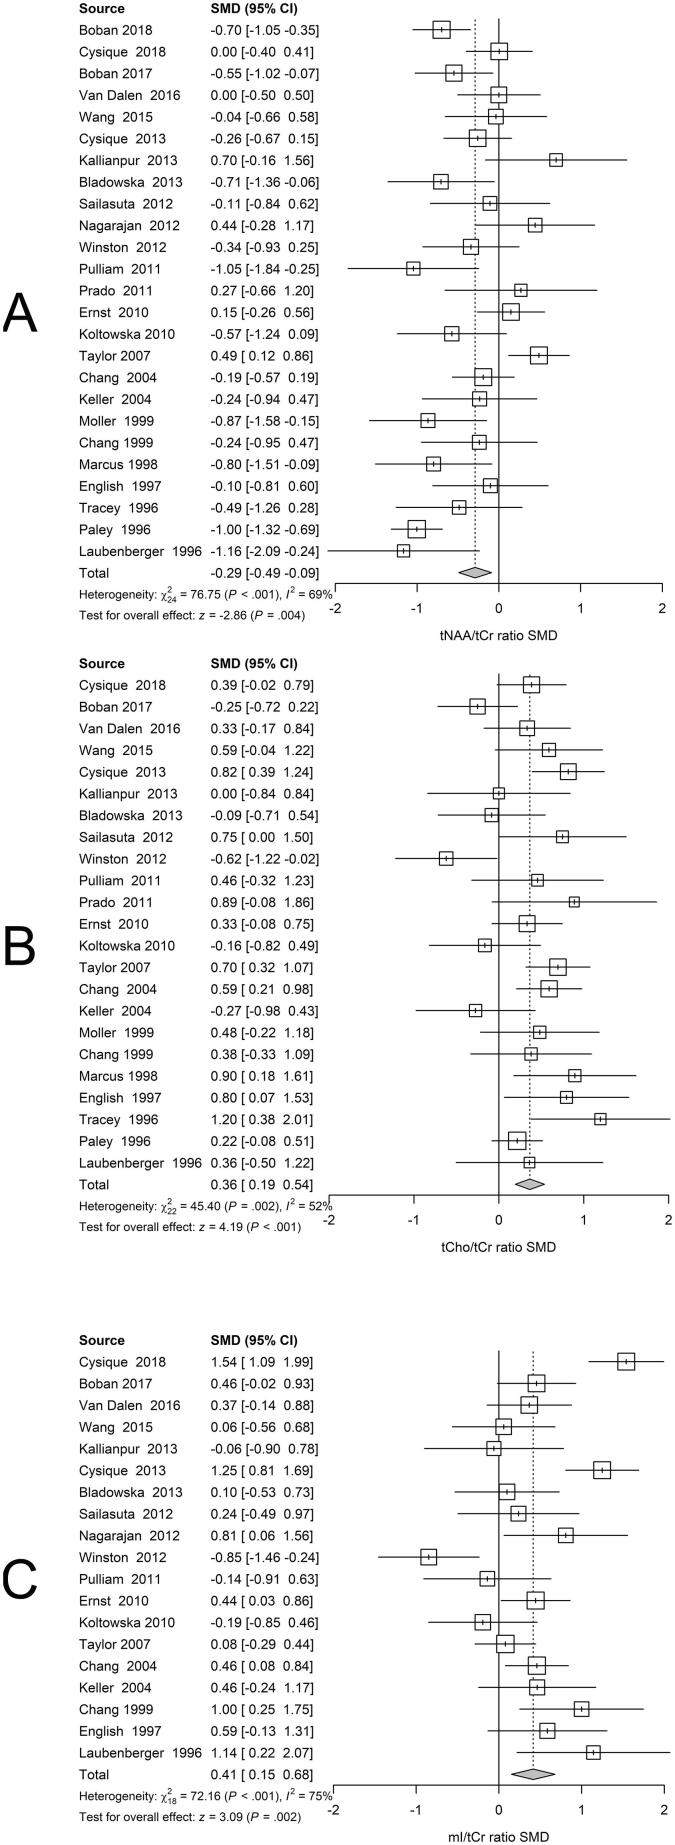
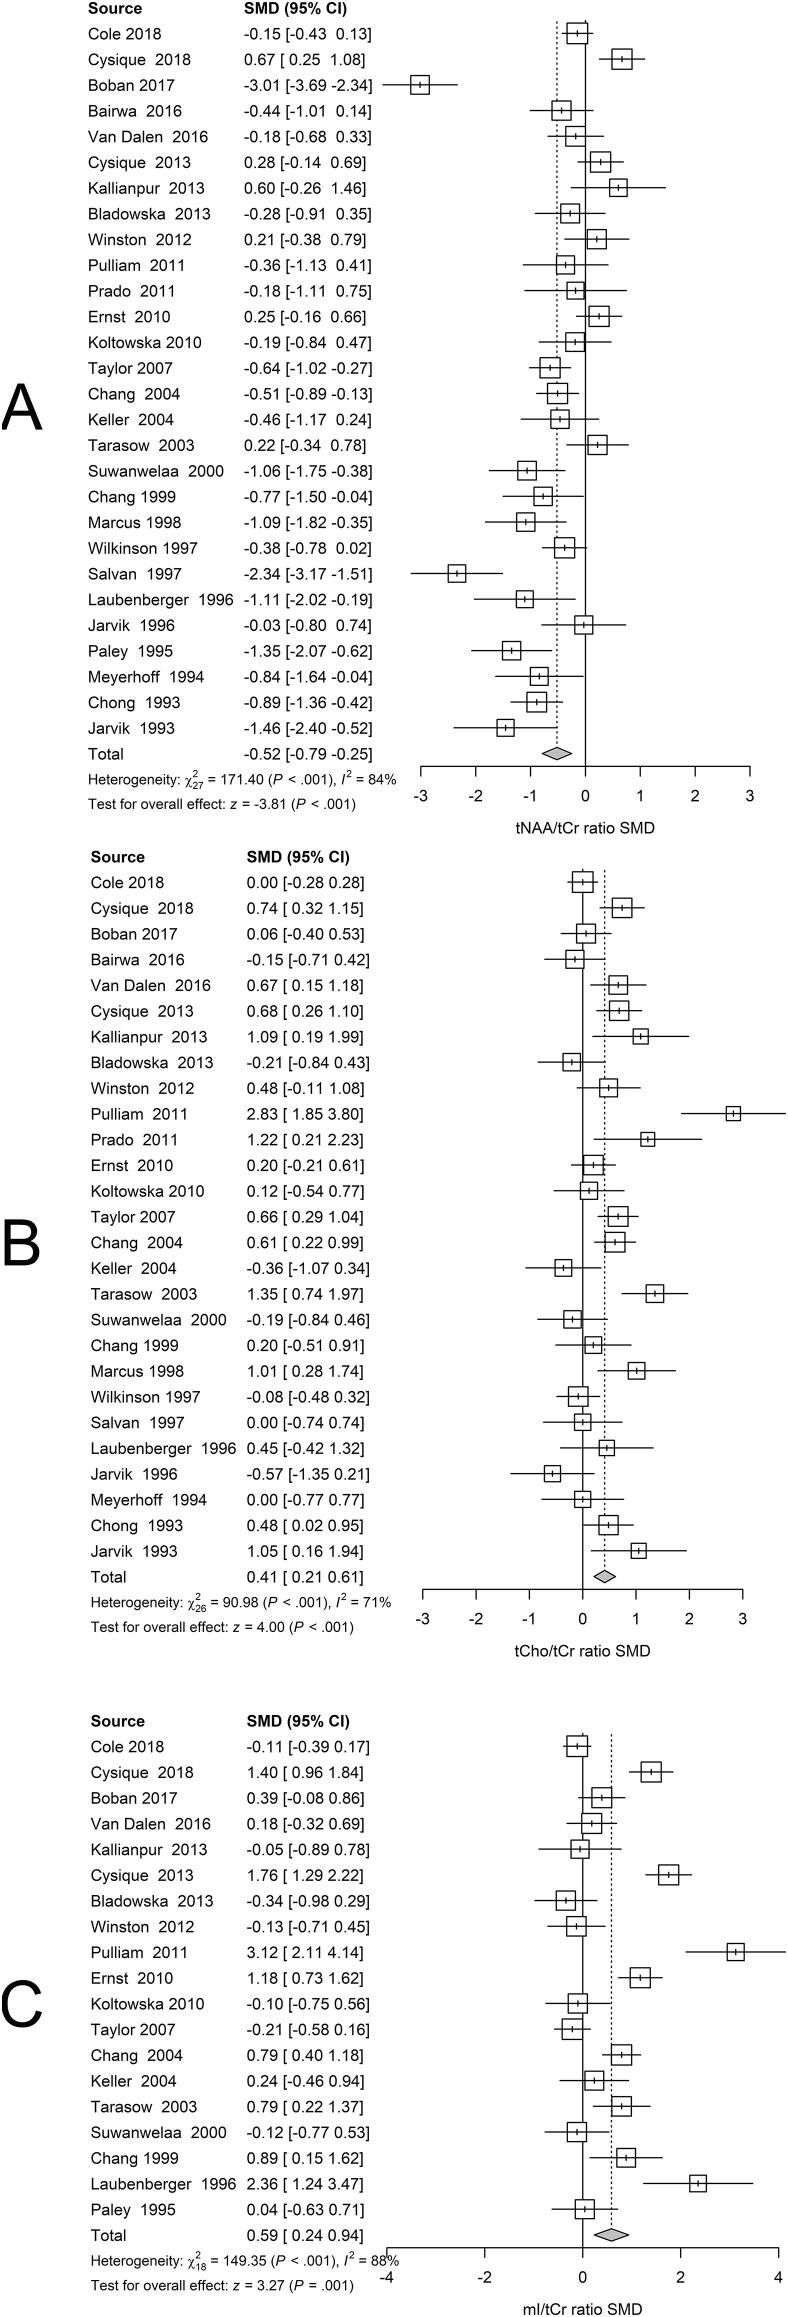
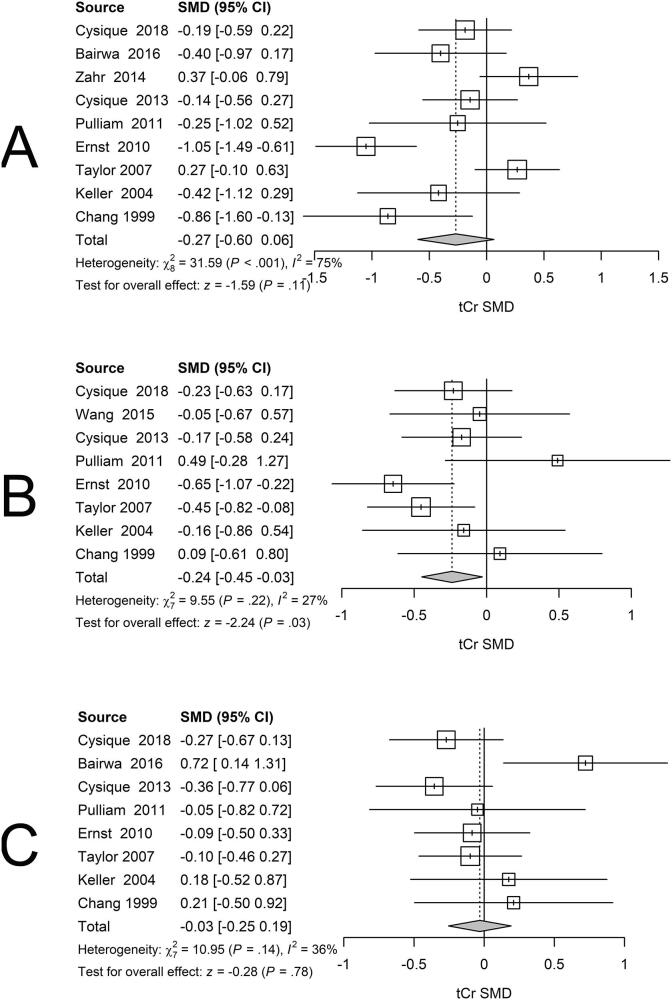
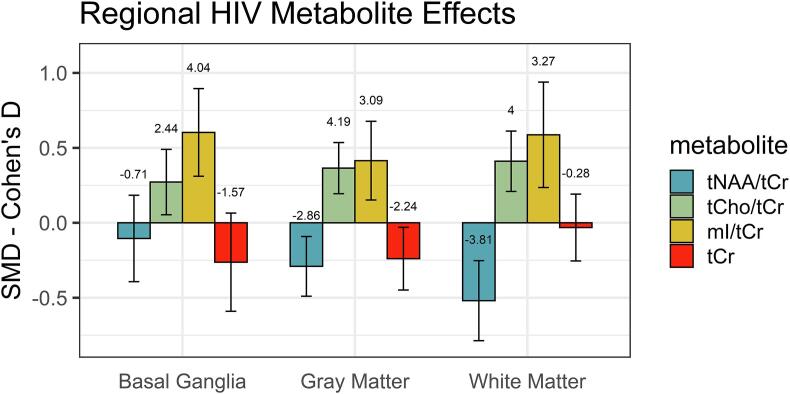
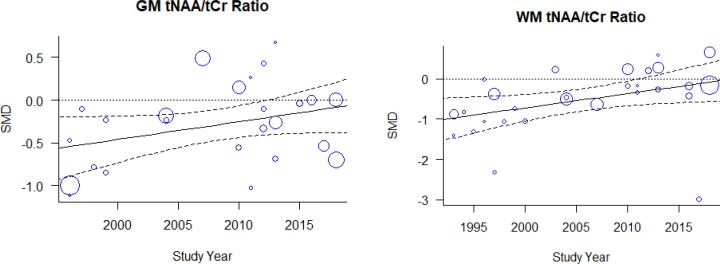
Data synthesis: BG SMDs related to positive serostatus were -0.10 [-0.39; 0.18] tNAA/tCr, 0.27 [0.05; 0.49] tCho/tCr, 0.60 [0.31; 0.90] mI/tCr, and -0.26 [-0.59; 0.06] tCr. GM SMDs related to serostatus were -0.29 [-0.49; -0.09] tNAA/tCr, 0.37 [0.19; 0.54] tCho/tCr, 0.41 [0.15; 0.68] mI/tCr, and -0.24 [-0.45; -0.03] tCr. WM SMDs related to serostatus were -0.52 [-0.79; -0.25] tNAA/tCr, 0.41 [0.21; 0.61] tCho/tCr, 0.59 [0.24; 0.94] mI/tCr, and -0.03 [-0.25; 0.19] tCr. WM regions showed larger serostatus effect sizes than BG and GM. I2 ranged from 52 to 88% for the metabolite ratios. Both GM and WM tNAA/tCr SMDs were lower with increasing calendar year.
Limitations: Many studies pooled participants with varying treatment, infection, and comorbidity durations.
Conclusions: HIV neurometabolite studies showed consistently lower tNAA/tCr, higher tCho/tCr and higher mI/tCr ratios associated with chronic HIV infection. Substantial between-study variation may have resulted from measurement technique variations, study population differences and HIV treatment changes over time. Higher WM tCho/tCr and mI/tCr may reflect reactive gliosis or myelin turnover. Neurometabolite measurements can reliably detect chronic HIV infection effects and may be useful in understanding the pathophysiology of cognitive and sensorimotor decline following HIV infection.
Classification of evidence: This study provides Class II evidence of neurometabolite differences in chronic HIV infection.
Keywords: ART; Anti-retroviral therapy; HAND; HIV associated neurocognitive disorder; Inflammation; MRS; Magnetic resonance spectroscopy; Neurons.
Copyright © 2020 The Authors. Published by Elsevier Inc. All rights reserved.
Figures
References
-
- Antuono P.G., Jones J.L., Wang Y., Li S.-J. Decreased glutamate + glutamine in Alzheimer's disease detected in vivo with 1H-MRS at 0.5 T. Neurology. 2001;56(6):737–742. - PubMed
-
- Becker J.T., Sanders J., Madsen S.K., Ragin A., Kingsley L., Maruca V., Cohen B., Goodkin K., Martin E., Miller E.N., Sacktor N., Alger J.R., Barker P.B., Saharan P., Carmichael O.T., Thompson P.M. Subcortical brain atrophy persists even in HAART-regulated HIV disease. Brain Imag. Behav. 2011;5(2):77–85. - PMC - PubMed
-
- Berger J.R., Nath A. HIV dementia and the basal ganglia. Intervirology. 1997;40(2-3):122–131. - PubMed
Publication types
MeSH terms
Substances
Grants and funding
LinkOut - more resources
Full Text Sources
Medical
Research Materials
