. 2020 Dec 29;22(1):247.
doi: 10.3390/ijms22010247.

Characterization and Differentiation of the Tumor Microenvironment (TME) of Orthotopic and Subcutaneously Grown Head and Neck Squamous Cell Carcinoma (HNSCC) in Immunocompetent Mice

Affiliations

Characterization and Differentiation of the Tumor Microenvironment (TME) of Orthotopic and Subcutaneously Grown Head and Neck Squamous Cell Carcinoma (HNSCC) in Immunocompetent Mice

Matthias Brand et al. Int J Mol Sci. .

Abstract

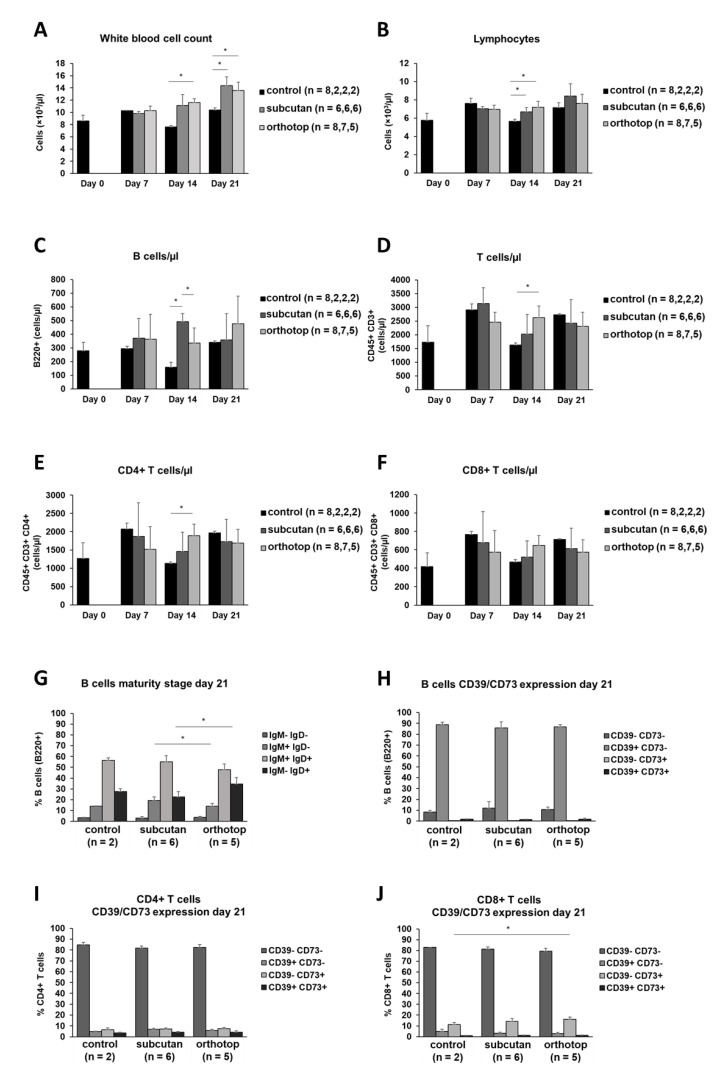
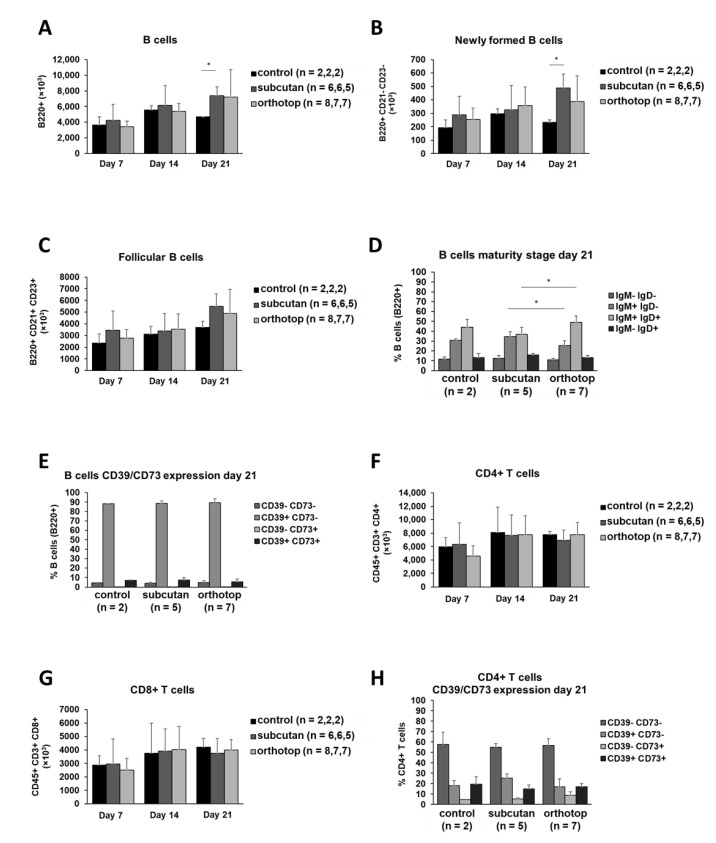
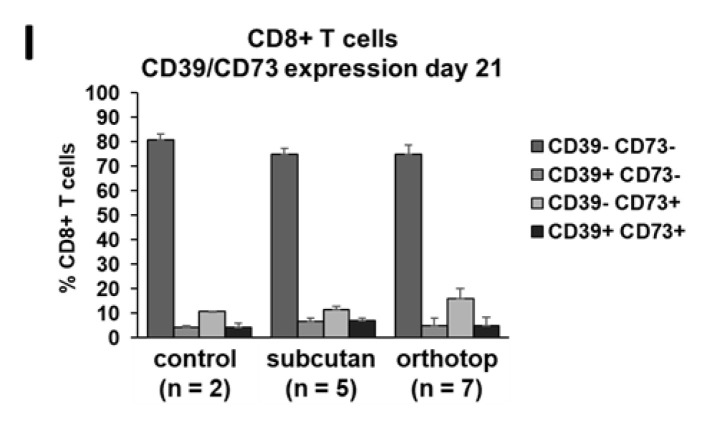
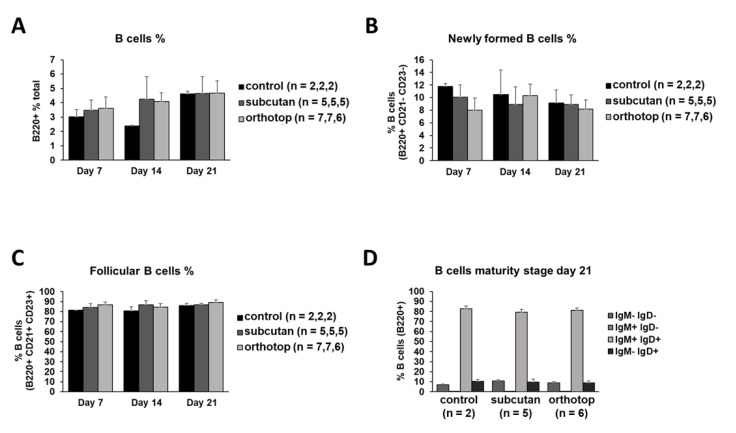
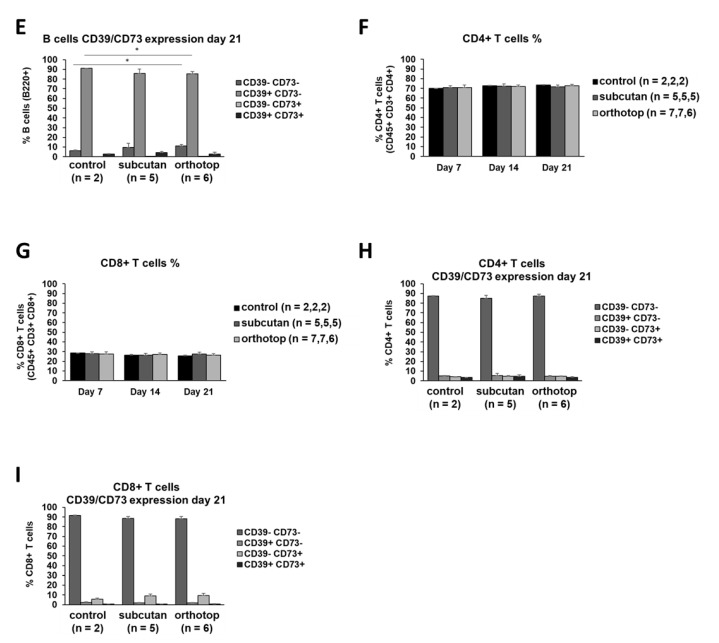
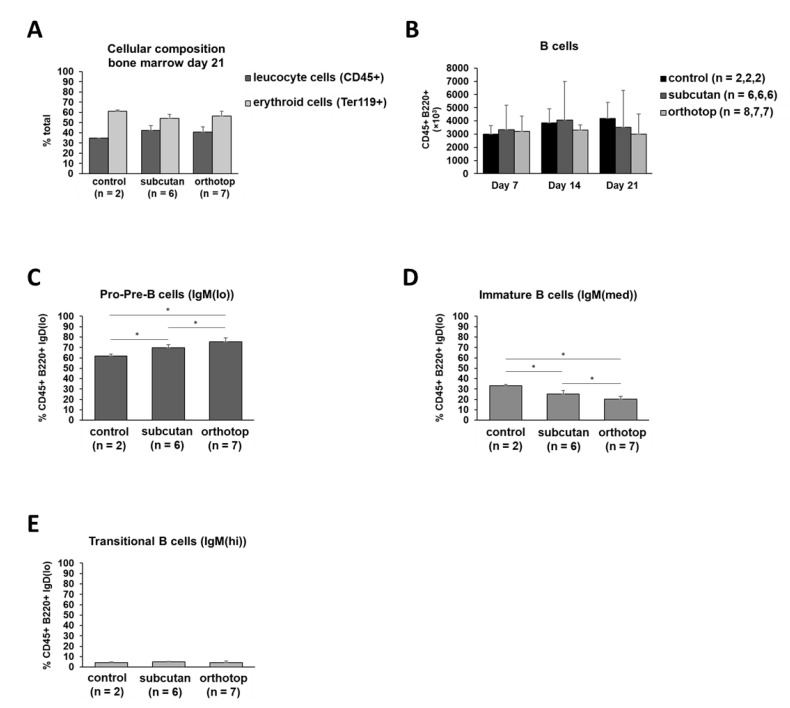
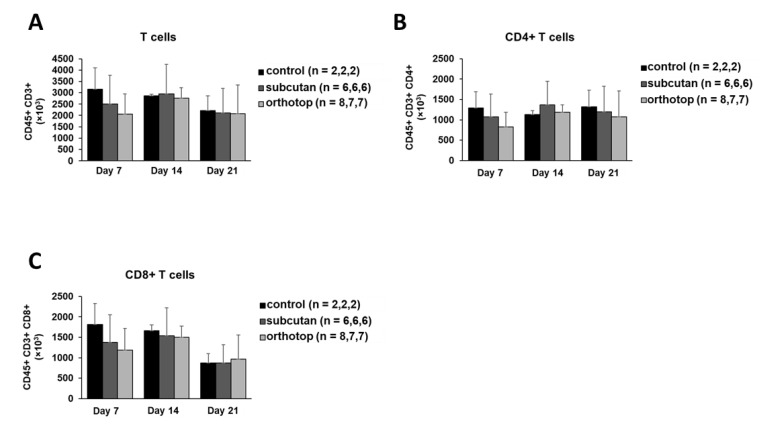
For the development and evaluation of new head and neck squamous cell carcinoma (HNSCC) therapeutics, suitable, well-characterized animal models are needed. Thus, by analyzing orthotopic versus subcutaneous models of HNSCC in immunocompetent mice, we evaluated the existence of adenosine-related immunosuppressive B- and T lymphocyte populations within the tumor microenvironment (TME). Applying the SCC VII model for the induction of HNSCC in immunocompetent C3H/HeN mice, the cellular TME was characterized after tumor initiation over time by flow cytometry. The TME in orthotopic grown tumors revealed a larger population of tumor-infiltrating lymphocytes (TIL) with more B cells and CD4+ T cells than the subcutaneously grown tumors. Immune cell populations in the blood and bone marrow showed a rather distinct reaction toward tumor induction and tumor location compared to the spleen, lymph nodes, or thymus. In addition, large numbers of immunosuppressive B- and T cells were identified within the TME but also in secondary lymphoid organs, independently of the tumor initiation site. The altered immunogenic TME may influence the response to any treatment attempt. Moreover, when analyzing the TME and other lymphoid organs of tumor-bearing mice, we observed conditions reflecting largely those of patients suffering from HNSCC suggesting the C3H/HeN mouse model as a suitable tool for studies aiming to target immunosuppression to improve anti-cancer therapies.

Keywords: CD4+ T cells; SCC VII orthotopic mouse model; SCC VII subcutaneous mouse model; adenosine-related immunosuppression; head and neck cancer; regulatory B cells; tumor microenvironment; tumor-infiltrating lymphocytes.


Conflict of interest statement

Simon Laban: Advisory Boards: Merck Sharp & Dohme (MSD), Bristol Myers Squibb (BMS), Astra Zeneca (AZ). Honoraria: MSD, BMS, AZ, Merck Serono. Johannes Doescher: Advisory Boards: Merck Serono and MSD. Honoraria: Merck Serono. Patrick J. Schuler: Advisory Boards: BMS and MSD. Thomas K. Hoffmann: Advisory Boards: MSD and BMS. Honoraria: MSD, BMS, and Merck Serono. The research was supported by the University of Ulm ‘Promotionsprogramm Experimentelle Medizin’ (M.B.). All other authors declare no conflict of interests.

Figures

Figure 1
Figure 1
A representative example of an orthotopic tumor (A1,A2) and a subcutaneous tumor (B1,B2) grown for 21 days in a murine model (marked by black arrows). After preparation, both tumors are approximately 1 cm3 in size 21 days after tumor induction (A2,B2). The attached length unit indicates the size in centimeters (A2,B2). Macroscopically, good vascularization of the tumor can be seen (A2,B2).
Figure 2
Figure 2
The tumor growth, the absolute number of tumor-infiltrating lymphocytes (TIL), the TIL/tumor weight, and the total number of myeloid cells of orthotopic and subcutaneous head and neck squamous cell carcinoma (HNSCC) bearing mice. Tumors were harvested 14 days and 21 days after tumor induction, and the tumor weight, including the difference in the average tumor weight of both experimental groups (Δ = 0.28g) (A), the absolute numbers of TIL (B), the numbers of TIL per g tumor (C), the relative TIL myeloid cell distribution (D), and the absolute numbers of macrophages, granulocytes, monocytes, and dendritic cells (EH) were determined. On day 14 and day 21, the test group size for the subcutaneous group was n = 6, and for the orthotopic group n = 6. p-values < 0.05 were considered to be significant with (*). Data shown here are listed in Table S1.
Figure 3
Figure 3
B cell populations in the tumor of orthotopic and subcutaneous HNSCC-bearing mice. (AC) Tumors were harvested 14 days and 21 days after tumor induction, and TIL were isolated. TIL were analyzed by flow cytometry for B220+ B cell frequency. For further characterization, B cells were divided into newly formed B cells (D) and follicular B cells (E). Furthermore, the B cell population was characterized by their expression of IgM and IgD (F) as well as CD39 and CD73 (G). On day 14 and day 21, the test group size for the subcutaneous group was n = 6, and for orthotopic group n = 6. p-values < 0.05 were considered to be significant with (*). Data shown here are listed in Table S1.
Figure 4
Figure 4
T cell populations in the tumor of orthotopic and subcutaneous HNSCC-bearing mice. (AD) Tumors were harvested 14 days and 21 days after tumor induction, and populations of CD4+ and CD8+ T cells and regulatory T cells were analyzed using flow cytometry. (E,F) The expression profile for CD39/CD73 was determined on CD4+ and CD8+ T cells. On day 14 and day 21, the test group size for the subcutaneous group was n = 6, and for the orthotopic group n = 6. p-values < 0.05 were considered to be significant with (*). Data shown here are listed in Table S1.
Figure 5
Figure 5
Cell populations in the peripheral blood of orthotopic and subcutaneous HNSCC-bearing mice. Leukocytes (A) and lymphocytes (B) were determined using an animal blood counter. (CF) Populations of B cells and T cells were analyzed using flow cytometry. (G,H) The expression profile for IgM/IgD and CD39/CD73 was determined on peripheral B cells. (I,J) The expression profile for CD39/CD73 was determined on T cells. Cell numbers per µl blood were calculated based on the white blood cell count (WBC). Values are shown for day 0 (control), day 7, day 14, and day 21. On day 7, day 14, and day 21, the test group size for the subcutaneous group is n = 6, while for the control group n = 2. On day 0, the test group size for the control group is n = 8. The test group size for the orthotopic group on day 7 is n = 8, day 14 n = 7, and day 21 n = 5. p-values < 0.05 were considered to be significant with (*). Data shown here are listed in Table S2.
Figure 6
Figure 6
Cell populations in the spleen of orthotopic and subcutaneous HNSCC-bearing mice. (AC) Populations of B cells and subgroups of B cells were analyzed using flow cytometry. (D,E) The expression profile for IgM/IgD and CD39/CD73 was determined on B cells. (F,G) Populations of CD4+ and CD8+ T cells were analyzed using flow cytometry. (H,I) The expression profile for CD39/CD73 was determined on T cells. Absolute cell numbers and percentages were calculated based on absolute and relative lymphocyte numbers. Values are shown for day 0 (control), day 7, day 14, and day 21. The test group size for the subcutaneous group is on day 7 is n = 6, day 14 n = 6, and day 21 n = 5. The test group size for the orthotopic group on day 7 is n = 8, day 14 n = 7, and day 21 n = 7. The test group size of the control group n = 2 on all days. p-values < 0.05 were considered to be significant with (*). Data shown here are listed in Table S3.
Figure 6
Figure 6
Cell populations in the spleen of orthotopic and subcutaneous HNSCC-bearing mice. (AC) Populations of B cells and subgroups of B cells were analyzed using flow cytometry. (D,E) The expression profile for IgM/IgD and CD39/CD73 was determined on B cells. (F,G) Populations of CD4+ and CD8+ T cells were analyzed using flow cytometry. (H,I) The expression profile for CD39/CD73 was determined on T cells. Absolute cell numbers and percentages were calculated based on absolute and relative lymphocyte numbers. Values are shown for day 0 (control), day 7, day 14, and day 21. The test group size for the subcutaneous group is on day 7 is n = 6, day 14 n = 6, and day 21 n = 5. The test group size for the orthotopic group on day 7 is n = 8, day 14 n = 7, and day 21 n = 7. The test group size of the control group n = 2 on all days. p-values < 0.05 were considered to be significant with (*). Data shown here are listed in Table S3.
Figure 7
Figure 7
Cell populations in inguinal lymph nodes of orthotopic and subcutaneous HNSCC-bearing mice. (AE) Populations of B cells and subgroups of B cells were analyzed using flow cytometry. (D,E) The expression profile for IgM/IgD and CD39/CD73 was determined in B cells. (F,G) Populations of CD4+ and CD8+ T cells were analyzed using flow cytometry. (H,I) The expression profile for CD39/CD73 was determined on T cells. Percentages were calculated based on relative lymphocyte numbers. Values are shown for day 0 (control), day 7, day 14, and day 21. On day 7, day 14, and day 21, the test group size for the subcutaneous group is n = 5, while for the control group n = 2. The test group size for the orthotopic group on day 7 is n = 7, day 14 n = 7, and day 21 n = 6. p-values < 0.05 were considered to be significant with (*). Data shown here are listed in Table S4.
Figure 7
Figure 7
Cell populations in inguinal lymph nodes of orthotopic and subcutaneous HNSCC-bearing mice. (AE) Populations of B cells and subgroups of B cells were analyzed using flow cytometry. (D,E) The expression profile for IgM/IgD and CD39/CD73 was determined in B cells. (F,G) Populations of CD4+ and CD8+ T cells were analyzed using flow cytometry. (H,I) The expression profile for CD39/CD73 was determined on T cells. Percentages were calculated based on relative lymphocyte numbers. Values are shown for day 0 (control), day 7, day 14, and day 21. On day 7, day 14, and day 21, the test group size for the subcutaneous group is n = 5, while for the control group n = 2. The test group size for the orthotopic group on day 7 is n = 7, day 14 n = 7, and day 21 n = 6. p-values < 0.05 were considered to be significant with (*). Data shown here are listed in Table S4.
Figure 8
Figure 8
Cellular composition and B cell characterization in the bone marrow of orthotopic and subcutaneous HNSCC-bearing mice. (A) Cells of the bone marrow were harvested and divided into the erythroid and lymphoid cell lineage using flow cytometry. (B) B cells in the bone marrow on day 7, day 14, and day 21 after tumor induction are compared to healthy control mice. (CE) Early B cell forms (IgD(lo)) are characterized by IgM expression intensity. On day 7, day 14, and day 21 the test group size for the subcutaneous group is n = 6, while for the control group n = 2. The test group size for the orthotopic group on day 7 is n = 8, day 14 n = 7, and day 21 n = 7. p-values < 0.05 were considered to be significant with (*). Data shown here are listed in Table S5.
Figure 9
Figure 9
Cellular composition in the thymus of orthotopic and subcutaneous HNSCC-bearing mice. (AC) Populations of T cells were analyzed using flow cytometry 7 days, 14 days, and 21 days after tumor induction. On day 7, day 14, and day 21 the test group size for the subcutaneous group is n = 6, while for the control group n = 2. The test group size for the orthotopic group on day 7 is n = 8, day 14 n = 7, and day 21 n = 7. Data shown here are listed in Table S6.

Similar articles

Cited by

References

    1. Ghanizada M., Jakobsen K.K., Grønhøj C., von Buchwald C. The effects of checkpoint inhibition on head and neck squamous cell carcinoma: A systematic review. Oral Oncol. 2019;90:67–73. doi: 10.1016/j.oraloncology.2019.01.018. - DOI - PubMed
    1. Warnakulasuriya S. Global epidemiology of oral and oropharyngeal cancer. Oral Oncol. 2009;45:309–316. doi: 10.1016/j.oraloncology.2008.06.002. - DOI - PubMed
    1. Marur S., Forastiere A.A. Proceedings of the Mayo Clinic Proceedings. Volume 83. Elsevier; Amsterdam, The Netherlands: 2008. Head and neck cancer: Changing epidemiology, diagnosis, and treatment; pp. 489–501. - PubMed
    1. Freiser M.E., Serafini P., Weed D.T. The immune system and head and neck squamous cell carcinoma: From carcinogenesis to new therapeutic opportunities. Immunol. Res. 2013;57:52–69. doi: 10.1007/s12026-013-8462-3. - DOI - PubMed
    1. Schwartz M., Zhang Y., Rosenblatt J.D. B cell regulation of the anti-tumor response and role in carcinogenesis. J. Immunother. Cancer. 2016;4:1–15. doi: 10.1186/s40425-016-0145-x. - DOI - PMC - PubMed

MeSH terms