. 2020 Dec 29;22(1):252.
doi: 10.3390/ijms22010252.

Mitochondrial TSPO Deficiency Triggers Retrograde Signaling in MA-10 Mouse Tumor Leydig Cells

Affiliations

Mitochondrial TSPO Deficiency Triggers Retrograde Signaling in MA-10 Mouse Tumor Leydig Cells

Jinjiang Fan et al. Int J Mol Sci. .

Abstract

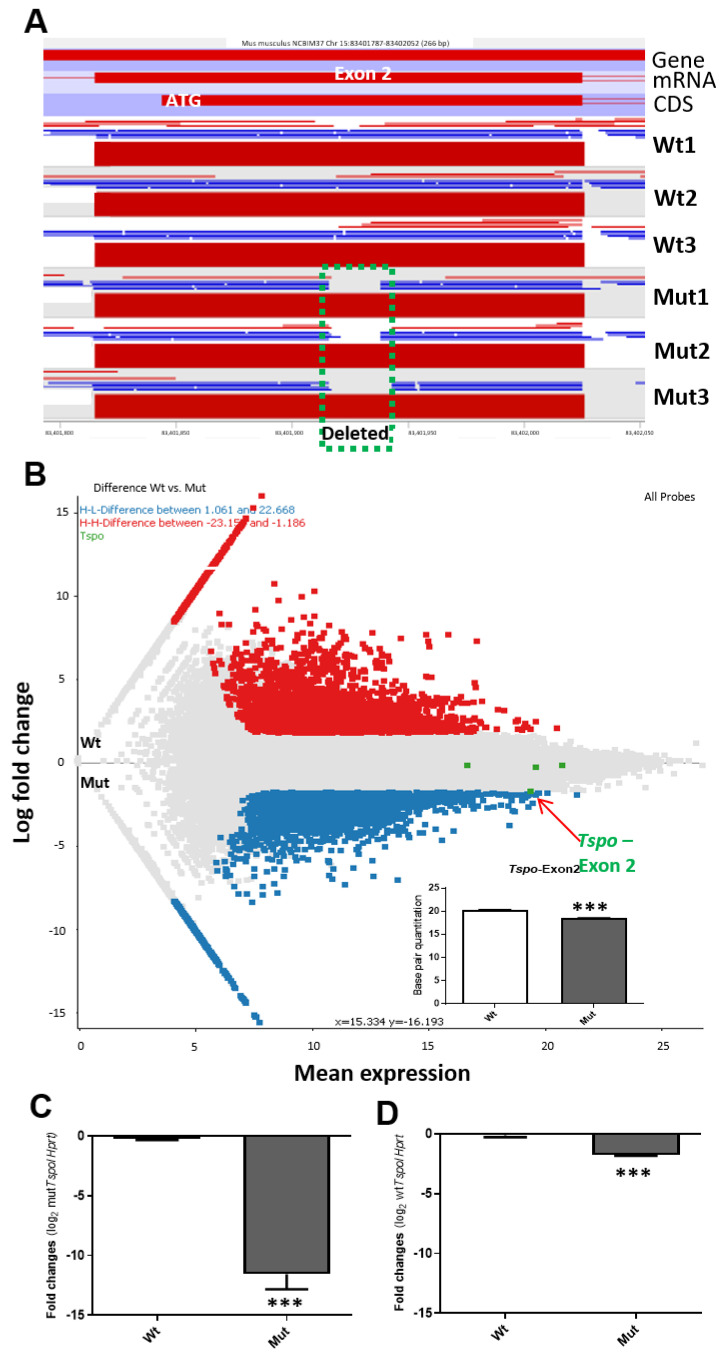
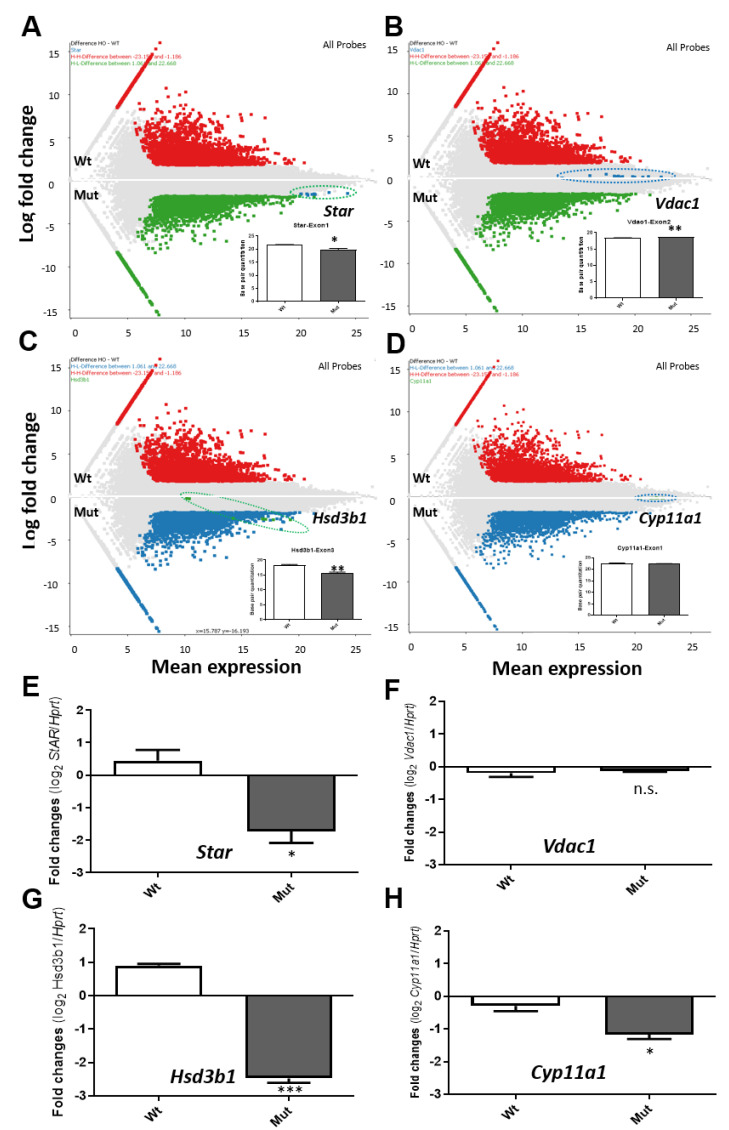
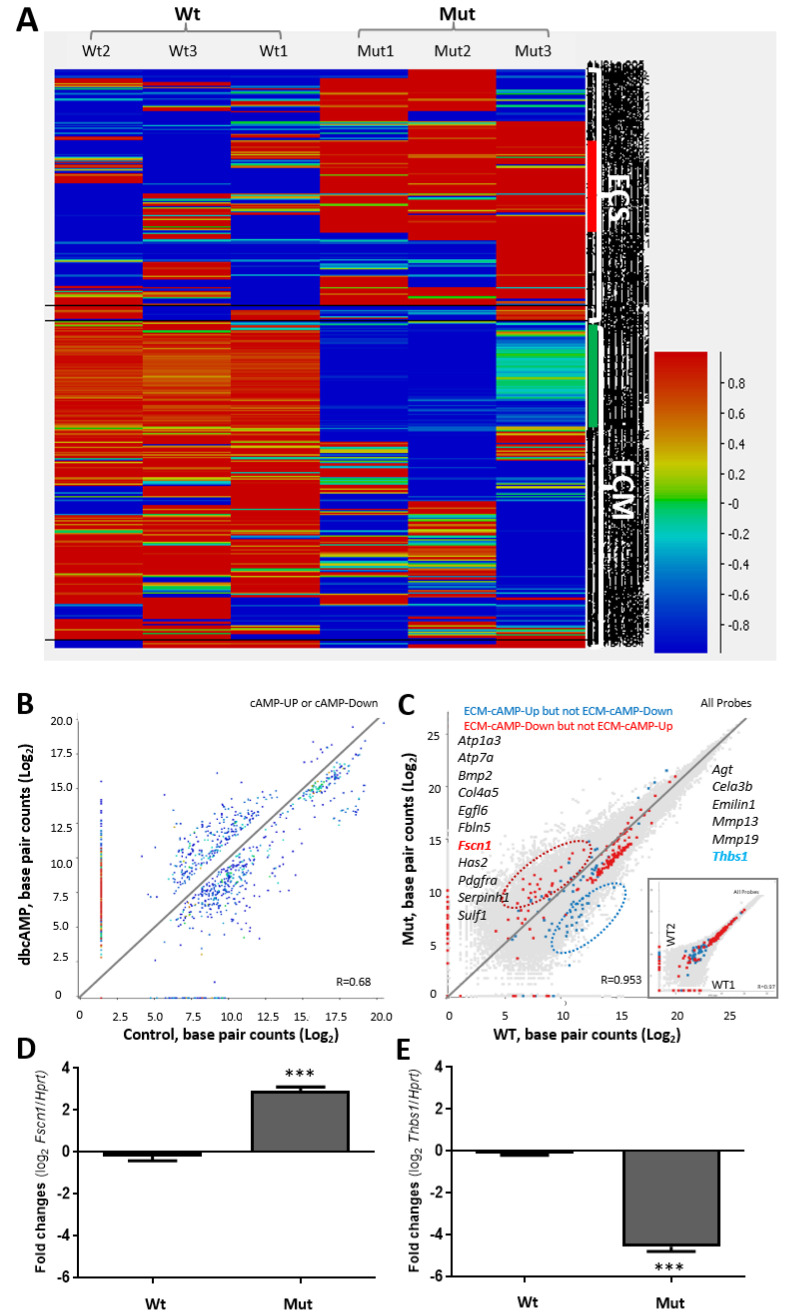
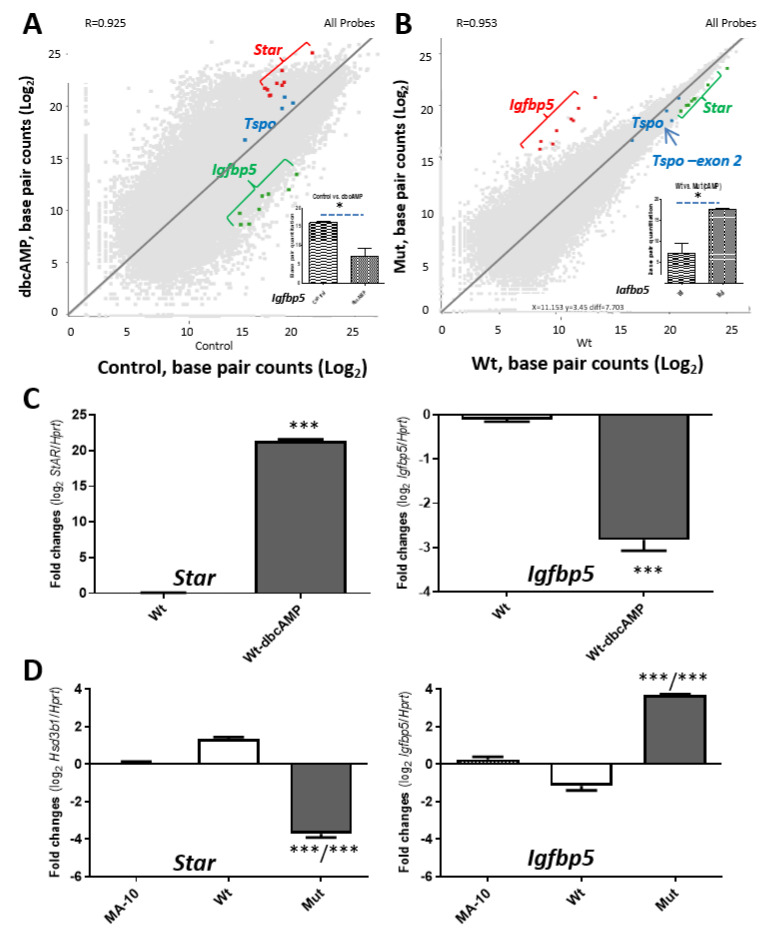
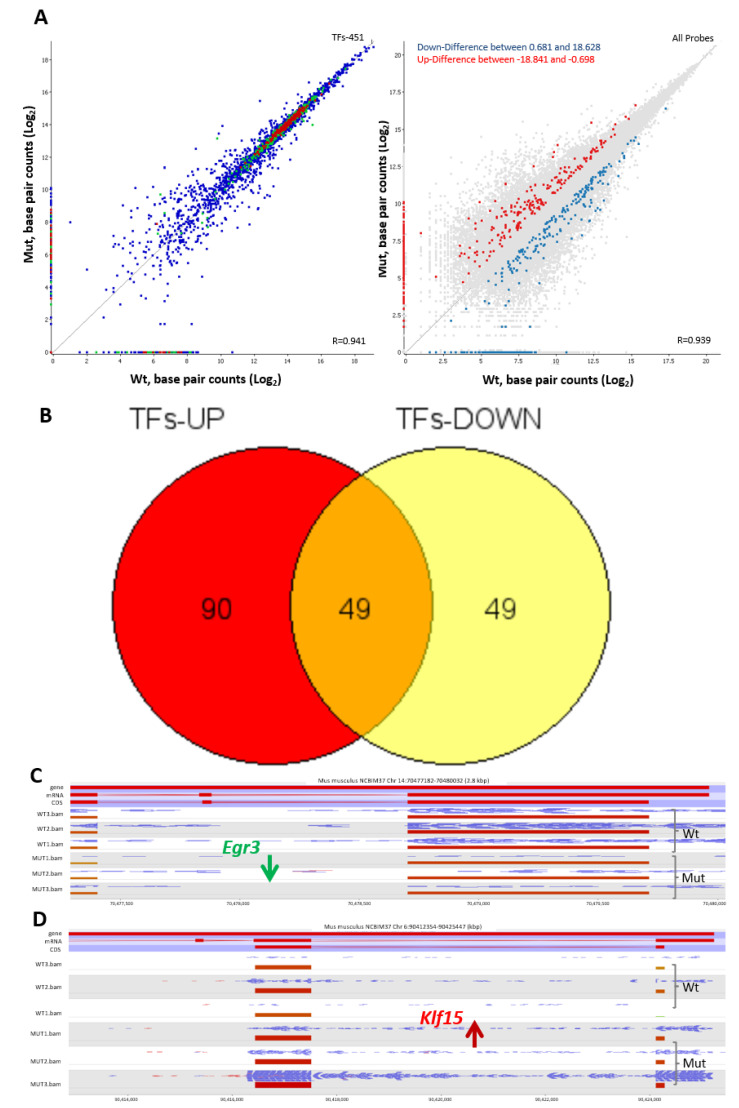
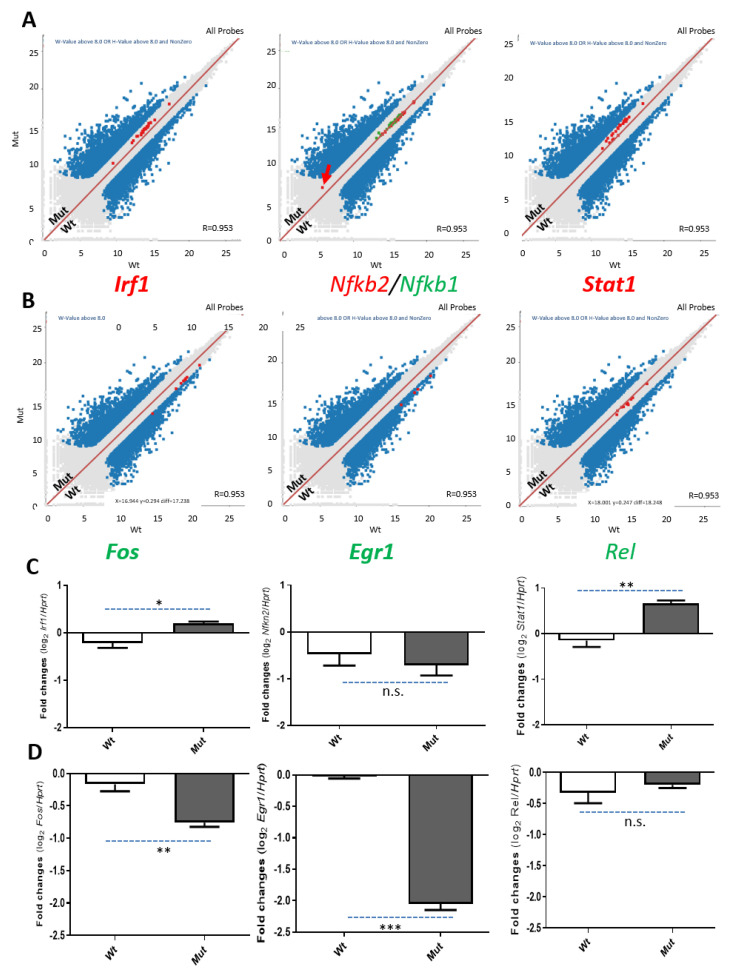
The mitochondrial translocator protein (TSPO) has been shown to bind cholesterol with high affinity and is involved in mediating its availability for steroidogenesis. We recently reported that targeted Tspo gene deletion in MA-10 mouse tumor Leydig cells resulted in reduced cAMP-stimulated steroid formation and significant reduction in the mitochondrial membrane potential (ΔΨm) compared to control cells. We hypothesized that ΔΨm reduction in the absence of TSPO probably reflects the dysregulation and/or maintenance failure of some basic mitochondrial function(s). To explore the consequences of TSPO depletion via CRISPR-Cas9-mediated deletion (indel) mutation in MA-10 cells, we assessed the transcriptome changes in TSPO-mutant versus wild-type (Wt) cells using RNA-seq. Gene expression profiles were validated using real-time PCR. We report herein that there are significant changes in nuclear gene expression in Tspo mutant versus Wt cells. The identified transcriptome changes were mapped to several signaling pathways including the regulation of membrane potential, calcium signaling, extracellular matrix, and phagocytosis. This is a retrograde signaling pathway from the mitochondria to the nucleus and is probably the result of changes in expression of several transcription factors, including key members of the NF-κB pathway. In conclusion, TSPO regulates nuclear gene expression through intracellular signaling. This is the first evidence of a compensatory response to the loss of TSPO with transcriptome changes at the cellular level.

Keywords: RNA-seq; calcium homeostasis; genomic edition; mitochondria; retrograde signaling; translocator protein.


Conflict of interest statement

The authors declare no conflict of interest.

Figures

Figure 1
Figure 1
The genome mapping of Tspo exon2 after CRISPR/Cas9-mediated genome editing and the transcriptome changes under TSPO deficiency. (A). RNA-seq mapping of transcripts onto the Tspo exon 2. Gene, mRNA, CDS (coding sequence), and ATG are indicated. Deleted area is indicated as green square dotted line. Wt1, Wt2 and Wt3: three wild-type cell populations; Mut1, Mut2 and Mut3: three mutated cell line populations. (B). M-A plot of the comparison of RNA-seq data from Wt vs. Mut, by transforming the data differences onto M (log ratio, Y-axis) and A (mean average, x-axis) scales. Each exon of Tspo gene is indicated by green dots: exon2, where there is a small deletion, is indicated and shown to be significantly lower than that in Wt, using base pair quantitation as shown in bar graph. The rest of the exons show no significant differences. Each dot represents each exon; Red dots, highly expressed genes after TSPO depletion and blue dots, the less expressed genes after TSPO depletion; the grey dots are exons showing no dramatic changes between Mut and Wt cells. Inset, base pair quantitation of exon 2 of Tspo gene, which was partially deleted by the CRISPR/Cas9 genome editing. ***, p value < 0.001 (student t-test, n = 3). C–D. Real-time PCR of Tspo Mut transcripts using one of the primers located within the deleted area as shown in A (C) and the rest of the undeleted exon regions (D). ***, p value < 0.001 (student t-test, n = 3).
Figure 2
Figure 2
MA-plots of RNA-Seq data for selected important steroidogenic genes: Star (Stard1), Vdac1, Hsd3b1, and Cyp11a1. (A). Exons of Star are shown as blue dots, and the bar graph shows quantitation of the actual number of bases between Mut versus Wt. (B). Exons of Vdac1 gene are shown as blue dots, and the bar graph shows the quantitation of the base difference between Mut versus Wt. (C). Exon of Hsd3b1 gene are shown as green dots, and the bar graph shows the quantitation of the base difference between Mut versus Wt. (D). Exon of Cyp11a1 gene are shown as green dots, and the bar graph shows the quantitation of the base difference between Mut versus Wt. (E,H). Real-time PCR of the four selected genes as shown in (AD). Three steroidogenic genes Star, Hsb3b1 and Cyp11a1 are significantly down-regulated, whereas Vdac1 shows no significant change. *, p value < 0.05 (student t-test, n = 3). **, p value < 0.01 (student t-test, n = 3). ***, p value < 0.001 (student t-test, n = 3).
Figure 3
Figure 3
The disturbed expression of ECM and/or ECS genes after Tspo mutation in Mut cells. (A). Hierarchical cluster analysis of top functional groups of genes with either down- or up-regulation. The dramatic changes of the up-regulated extracellular structure organization (ECS) genes and the down-regulated extracellular matrix organization (ECM) genes are highlighted in hierarchical clustered heat maps from red (high) to blue (low), vertical bar. (B). Selected ECM and ECS genes in Wt cells from the hierarchical cluster analysis are distributed randomly in response to dbcAMP treatment. The diagonal line in the figure separates the gene expression further into high (up-left) or low (low-right) responses to dbcAMP. The colors of the dots correspond to the colors assigned to the genes from the hierarchical cluster analysis above. Color spots along either the x- or y- axis are unreadable exon(s). (C). Unique up- (in red) or low (in blue) expression of the ECM and ECS genes in response to TSPO depletion under dbcAMP treatment. Insert, the two Wt cell lines are compared. An example from either up- and down-regulated genes (Fscn1 vs. Thbs1) is highlighted. (D,E). Real-time PCR of the two genes: Fscn1 versus Thbs1. ***, p value < 0.001 (student t-test, n = 3).
Figure 4
Figure 4
Possible compensatory mechanism to the loss of TSPO reflected in specific gene analysis. (A). A low expressed gene, insulin like growth factor binding protein 5 (Igfbp5), in comparisons with highly induced Star and slightly higher expressed Tspo in response to dbcAMP. (B). The opposite effect on three genes in response to Tspo mutation. The highly induced Igfbp5 gene under TSPO depletion is highlighted, whereas Star and Tspo were used as gene expression control(s). Inset, the bar graph is the base pair quantitation of each exon of the Igfbp5 gene. *, p value < 0.05 (Student t-test; n = 3). (C,D). Real-time PCR of Star and Igfbp5 in response to dbcAMP stimulation in Wt cells (C) and to TSPO depletion in MA-10, Wt and Mut cells (D). ***, p value < 0.001 (student t-test, n = 3).
Figure 5
Figure 5
Transcription factors (TFs) affected by the loss of TSPO. (A). A scatter plot of a total of 451 mouse TFs from HOmo sapiens COmprehensive MOdel COllection (HOCOMOCO; http://hocomoco11.autosome.ru) between Wt vs. Tspo Mut (left) and their highlighted distribution in the total transcriptome changes (right). The color of the dots in the left panel represent TFs showing higher expression (red), reduced expression (green) and no change in expression levels (blue) between Wt and Mut cells. (B). 90 TFs are up-regulated and 49 TFs are down-regulated from a total of 188 TFs dramatically changed by the loss of TSPO. C-D. An example of down- (C) and up (D) regulated genes: Egr3 (early growth response 3) and Klf15 (Kruppel like factor 15), are presented. Egr3 is an immediate-early growth response gene, which is induced by mitogenic stimulation, whereas Klf15 is a negative regulator of TP53 acetylation that inhibits NF-κB activation through repression of EP300-dependent RELA acetylation.
Figure 6
Figure 6
The NF-κB pathway is the link between the effects of the loss of TSPO on mitochondria and changes in nuclear gene expression. (A). Up-regulation of three genes involved in the NF-κB pathway: Irf1, interferon regulatory factor 1, and the whole set of Irf1 exons are up-regulated as an early actin-rearrangement-inducing factor gene; Nfkb2/1, nuclear factor kappa B subunit 2/1, and one of the Nfkb1 exons (exon 1, indicated in red arrow) are dramatically up-regulated, indicating there is an isoform-specific change; and Stat1, signal transducer and activator of transcription 1, and all of the Stat1 exons are up-regulated as a whole gene. (B). Down-regulation of three genes involved in the NF-κB pathway: Fos, a proto-oncogene, AP-1 transcription factor subunit (with Jun); Egr1, early growth response protein 1; and Rel, REL proto-oncogene and NF-κB subunit. All of the genes from the NF-κB signaling pathways were selected from the NF-κB Signaling Pathway RT2 Profiler™ PCR Array PAMM-025Z (Qiagen, Germantown, MD, USA). (C,D). Real-time PCR of the six genes shown in A and B. Both Irf1 and Stat1 up-regulation and Fos and Egr1 down-regulation in Tspo Mut cells were confirmed. n.s., non-significant; * p < 0.05, ** p < 0.01, and *** p < 0.001; Student’s t-tests (n = 3).

Similar articles

Cited by

References

    1. Papadopoulos V., Baraldi M., Guilarte T.R., Knudsen T.B., Lacapere J.J., Lindemann P., Norenberg M.D., Nutt D., Weizman A., Zhang M.R., et al. Translocator protein (18kDa): New nomenclature for the peripheral-type benzodiazepine receptor based on its structure and molecular function. Trends Pharmacol. Sci. 2006;27:402–409. doi: 10.1016/j.tips.2006.06.005. - DOI - PubMed
    1. Rupprecht R., Papadopoulos V., Rammes G., Baghai T.C., Fan J., Akula N., Groyer G., Adams D., Schumacher M. Translocator protein (18 kDa) (TSPO) as a therapeutic target for neurological and psychiatric disorders. Nat. Rev. Drug Discov. 2010;9:971–988. doi: 10.1038/nrd3295. - DOI - PubMed
    1. Rone M.B., Midzak A.S., Issop L., Rammouz G., Jagannathan S., Fan J., Ye X., Blonder J., Veenstra T., Papadopoulos V. Identification of a dynamic mitochondrial protein complex driving cholesterol import, trafficking, and metabolism to steroid hormones. Mol. Endocrinol. 2012;26:1868–1882. doi: 10.1210/me.2012-1159. - DOI - PMC - PubMed
    1. Owen D.R., Fan J., Campioli E., Venugopal S., Midzak A., Daly E., Harlay A., Issop L., Libri V., Kalogiannopoulou D., et al. TSPO mutations in rats and a human polymorphism impair the rate of steroid synthesis. Biochem. J. 2017;474:3985–3999. doi: 10.1042/BCJ20170648. - DOI - PMC - PubMed
    1. Fan J., Campioli E., Midzak A., Culty M., Papadopoulos V. Conditional steroidogenic cell-targeted deletion of TSPO unveils a crucial role in viability and hormone-dependent steroid formation. Proc. Natl. Acad. Sci. USA. 2015;112:7261–7266. doi: 10.1073/pnas.1502670112. - DOI - PMC - PubMed

MeSH terms