A Genetics-First Approach to Dissecting the Heterogeneity of Autism: Phenotypic Comparison of Autism Risk Copy Number Variants
- PMID: 33384013
- PMCID: PMC8022239
- DOI: 10.1176/appi.ajp.2020.20010015
A Genetics-First Approach to Dissecting the Heterogeneity of Autism: Phenotypic Comparison of Autism Risk Copy Number Variants
Abstract
Objective: Certain copy number variants (CNVs) greatly increase the risk of autism. The authors conducted a genetics-first study to investigate whether heterogeneity in the clinical presentation of autism is underpinned by specific genotype-phenotype relationships.
Methods: This international study included 547 individuals (mean age, 12.3 years [SD=4.2], 54% male) who were ascertained on the basis of having a genetic diagnosis of a rare CNV associated with high risk of autism (82 16p11.2 deletion carriers, 50 16p11.2 duplication carriers, 370 22q11.2 deletion carriers, and 45 22q11.2 duplication carriers), as well as 2,027 individuals (mean age, 9.1 years [SD=4.9], 86% male) with autism of heterogeneous etiology. Assessments included the Autism Diagnostic Interview-Revised and IQ testing.
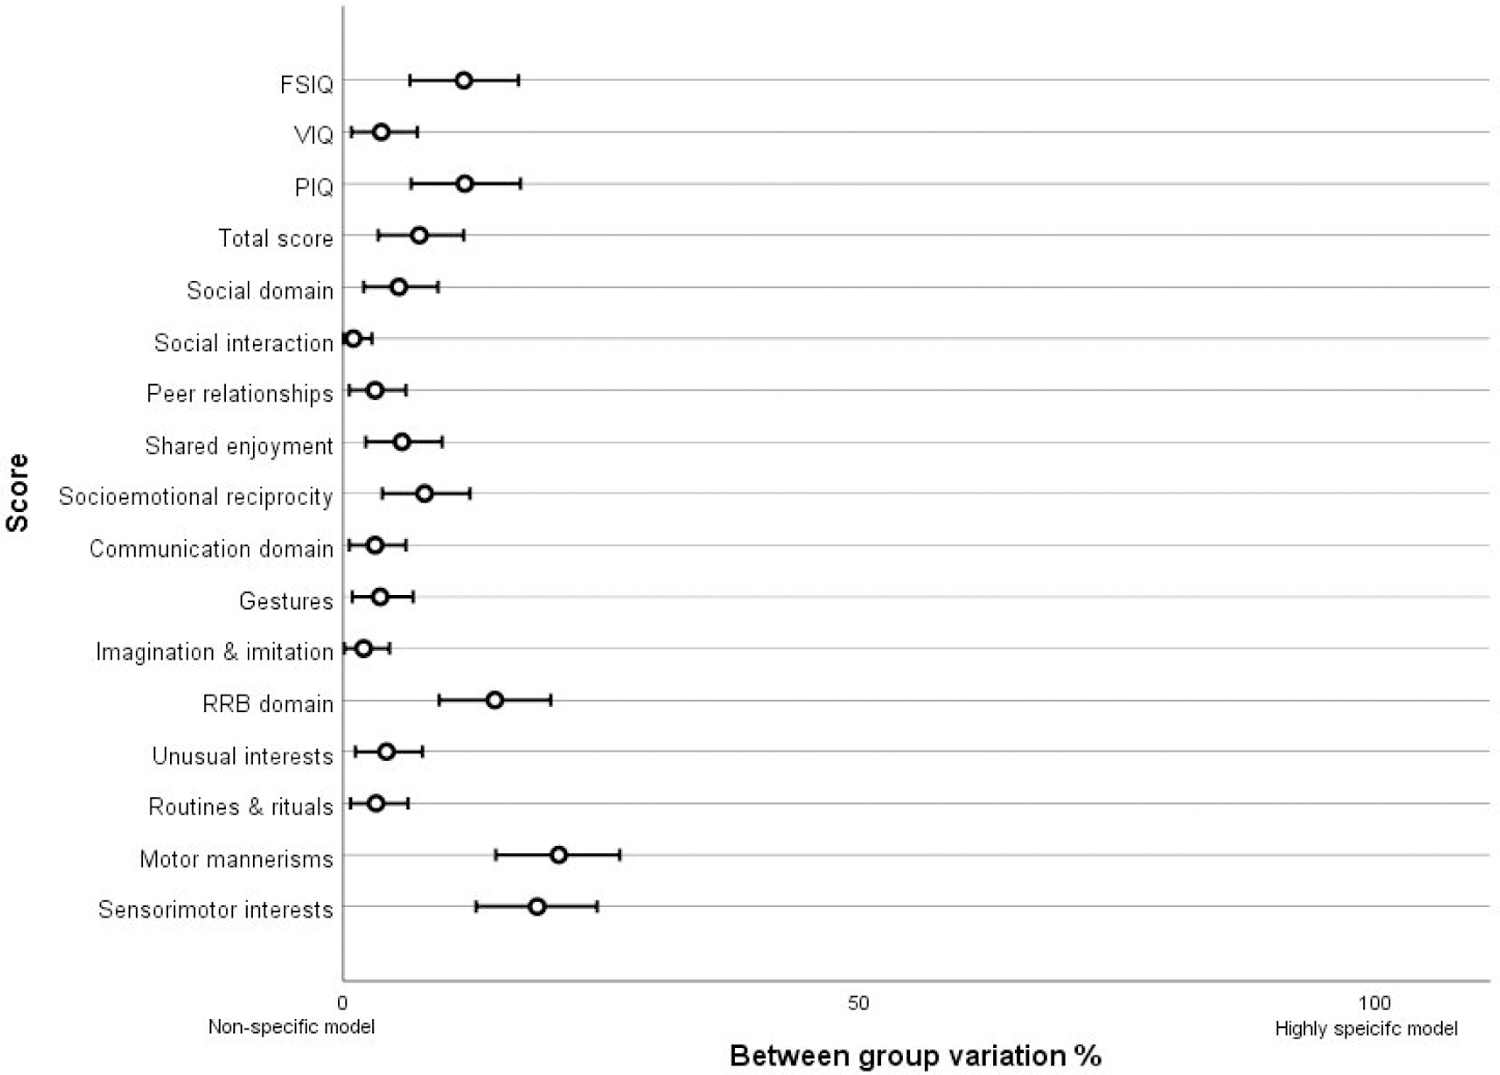
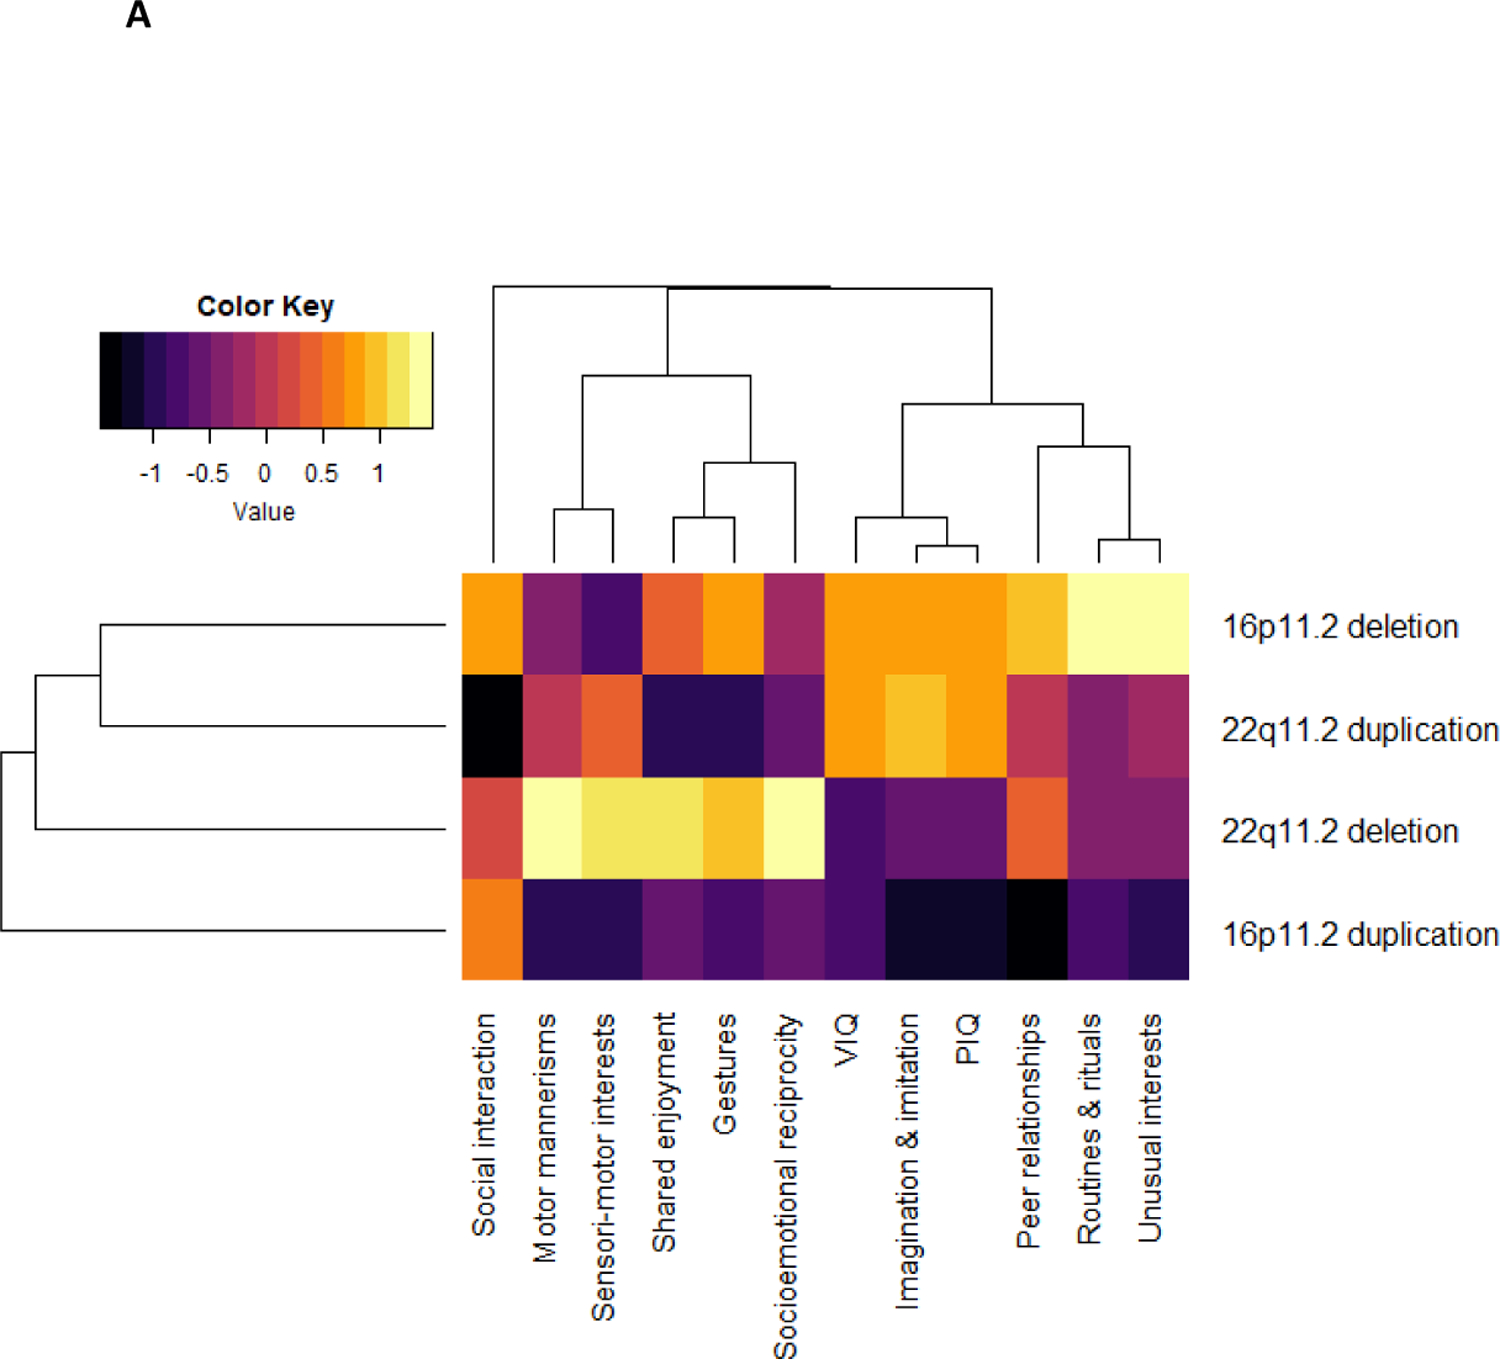
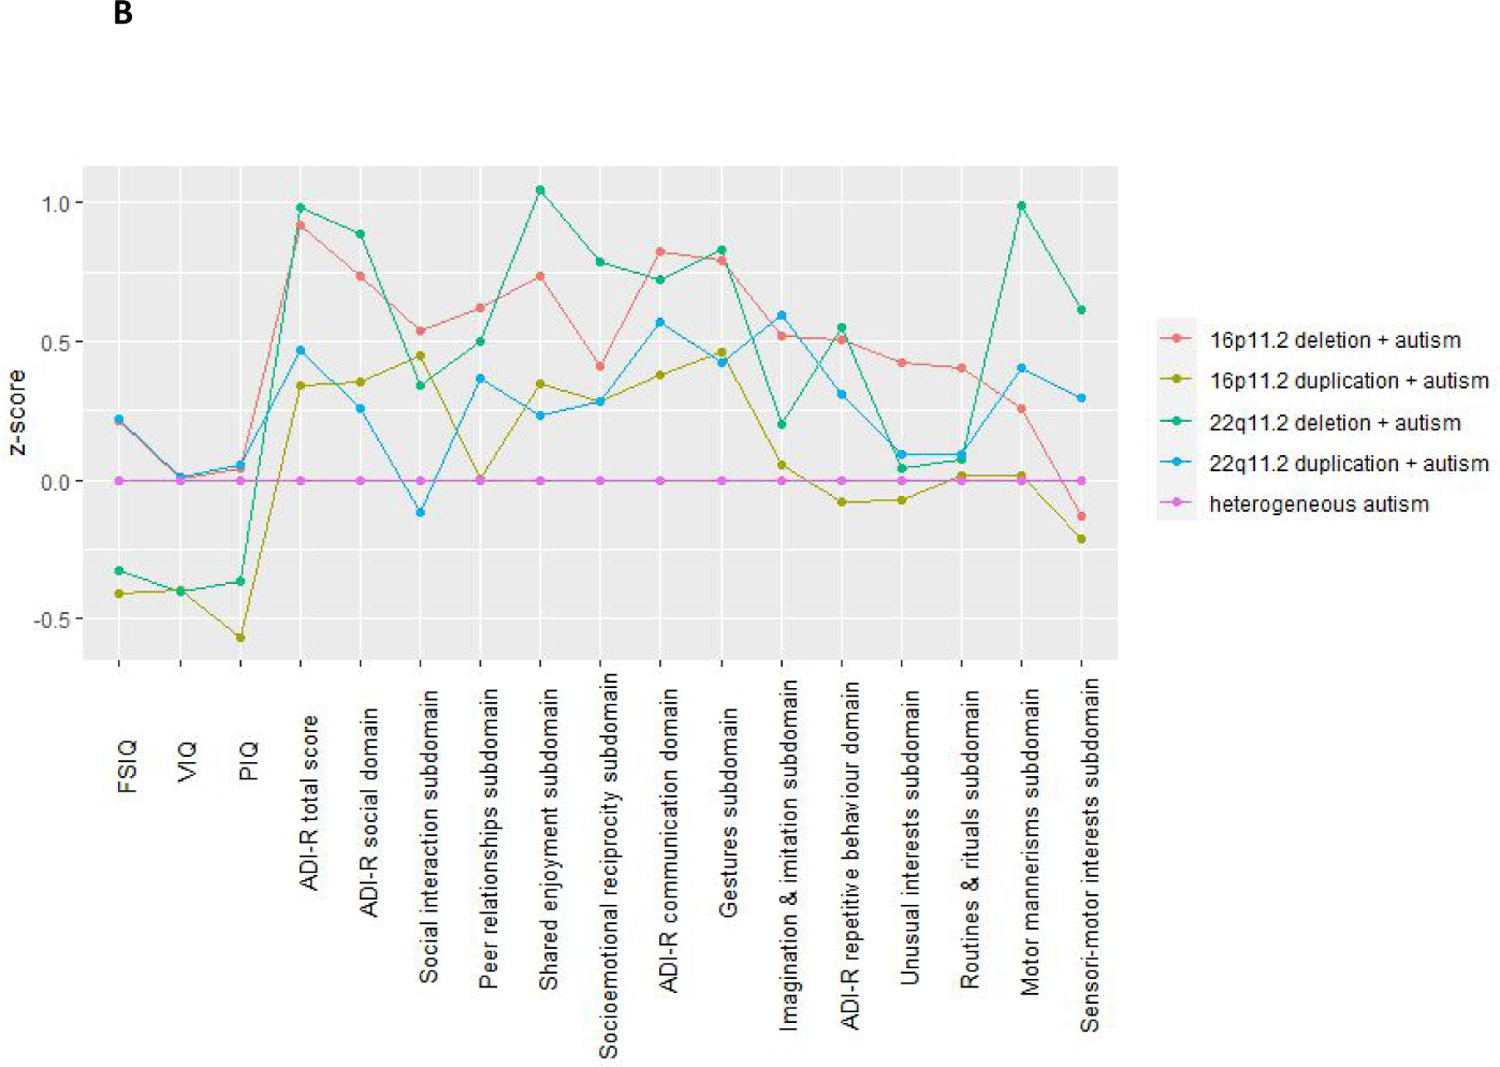
Results: The four genetic variant groups differed in autism symptom severity, autism subdomain profile, and IQ profile. However, substantial variability was observed in phenotypic outcome in individual genetic variant groups (74%-97% of the variance, depending on the trait), whereas variability between groups was low (1%-21%, depending on the trait). CNV carriers who met autism criteria were compared with individuals with heterogeneous autism, and a range of profile differences were identified. When clinical cutoff scores were applied, 54% of individuals with one of the four CNVs who did not meet full autism diagnostic criteria had elevated levels of autistic traits.
Conclusions: Many CNV carriers do not meet full diagnostic criteria for autism but nevertheless meet clinical cutoffs for autistic traits. Although profile differences between variants were observed, there is considerable variability in clinical symptoms in the same variant.
Keywords: Autism; Copy Number Variants; Genetics.
Conflict of interest statement
Declaration of Interests
JH reports grants from Wyeth, Pfizer, AbbVie, A&Z Pharmaceutical, and Takeda Pharmaceuticals outside of the submitted work. MJO and MBMvdB report grants from Takeda Pharmaceuticals outside of the submitted work. All other authors declare no competing interests.
Figures
Comment in
-
Genotype-Phenotype Predictions in Autism: Are We There Yet?Am J Psychiatry. 2021 Jan 1;178(1):11-12. doi: 10.1176/appi.ajp.2020.20111589. Am J Psychiatry. 2021. PMID: 33384006 No abstract available.
References
-
- American Psychiatric Association. Diagnostic and statistical manual of mental disorders, (DSM-5®) (American Psychiatric Pub, 2013).
-
- Charman T et al. IQ in children with autism spectrum disorders: data from the Special Needs and Autism Project (SNAP). Psychological medicine 41, 619–627 (2011). - PubMed
-
- Eaves LC, Ho HH & Eaves DM Subtypes of autism by cluster analysis. J. Autism Dev. Disord 24, 3–22 (1994). - PubMed
Publication types
MeSH terms
Grants and funding
- U01 MH119736/MH/NIMH NIH HHS/United States
- U01 MH119758/MH/NIMH NIH HHS/United States
- U01 MH119738/MH/NIMH NIH HHS/United States
- U01 MH101719/MH/NIMH NIH HHS/United States
- MRF-154-0001-RG-SKUSE/MRF_/MRF_/United Kingdom
- U01 MH119739/MH/NIMH NIH HHS/United States
- G0801418/MRC_/Medical Research Council/United Kingdom
- MR/T033045/1/MRC_/Medical Research Council/United Kingdom
- R21 MH116473/MH/NIMH NIH HHS/United States
- R01 MH085953/MH/NIMH NIH HHS/United States
- P50 HD105354/HD/NICHD NIH HHS/United States
- R01 MH064824/MH/NIMH NIH HHS/United States
- U01 MH119741/MH/NIMH NIH HHS/United States
- MR/K006584/1/MRC_/Medical Research Council/United Kingdom
- U01 MH101724/MH/NIMH NIH HHS/United States
- MR/L011166/1 /MRC_/Medical Research Council/United Kingdom
- WT_/Wellcome Trust/United Kingdom
- MR/N022572/1/MRC_/Medical Research Council/United Kingdom
- MR/L010305/1/MRC_/Medical Research Council/United Kingdom
- G0800509/MRC_/Medical Research Council/United Kingdom
- R37 MH085953/MH/NIMH NIH HHS/United States
LinkOut - more resources
Full Text Sources
Other Literature Sources
Miscellaneous