. 2021 Jan 1;371(6524):eabb6896.
doi: 10.1126/science.abb6896.

QRICH1 dictates the outcome of ER stress through transcriptional control of proteostasis

Affiliations

QRICH1 dictates the outcome of ER stress through transcriptional control of proteostasis

Kwontae You et al. Science. .

Abstract

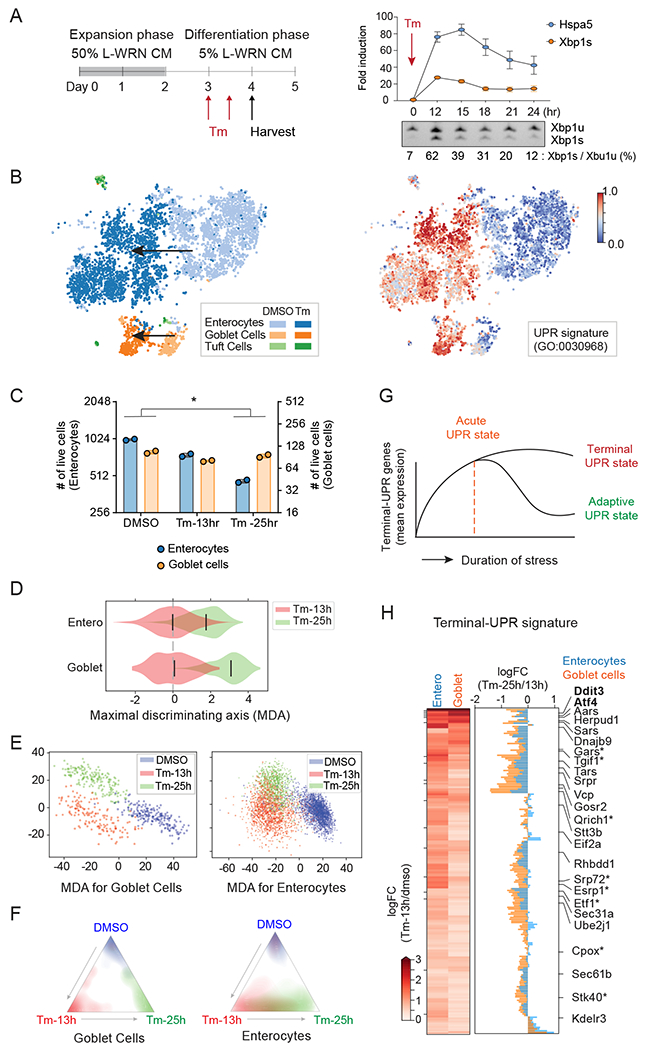
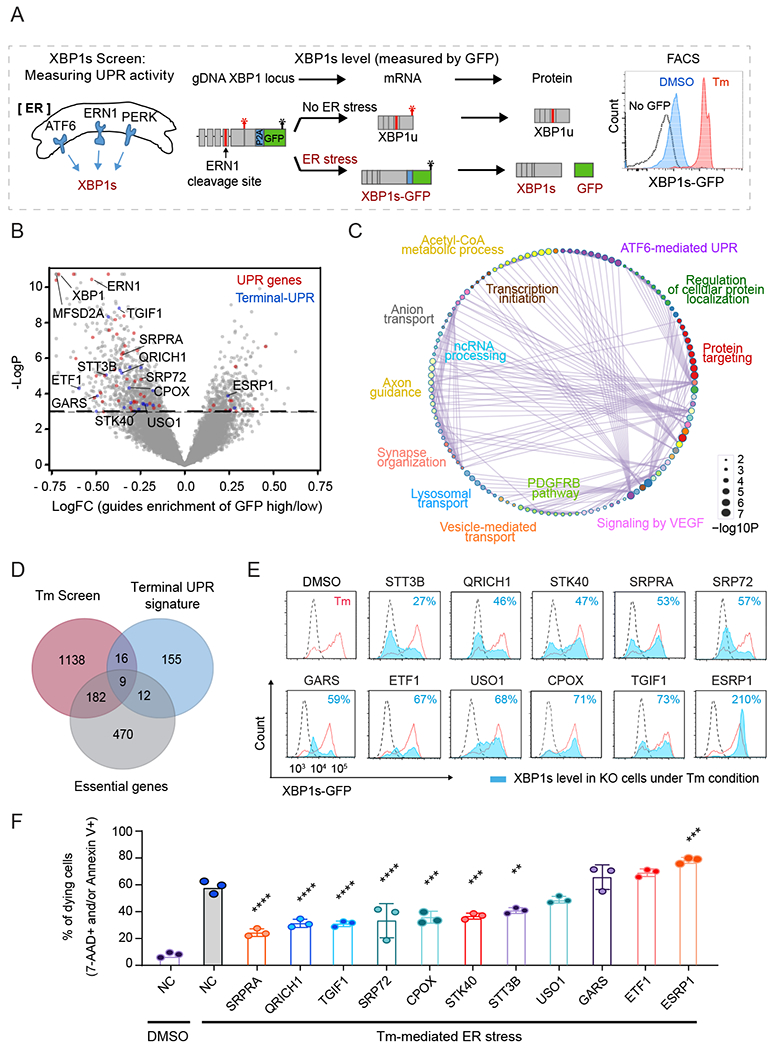
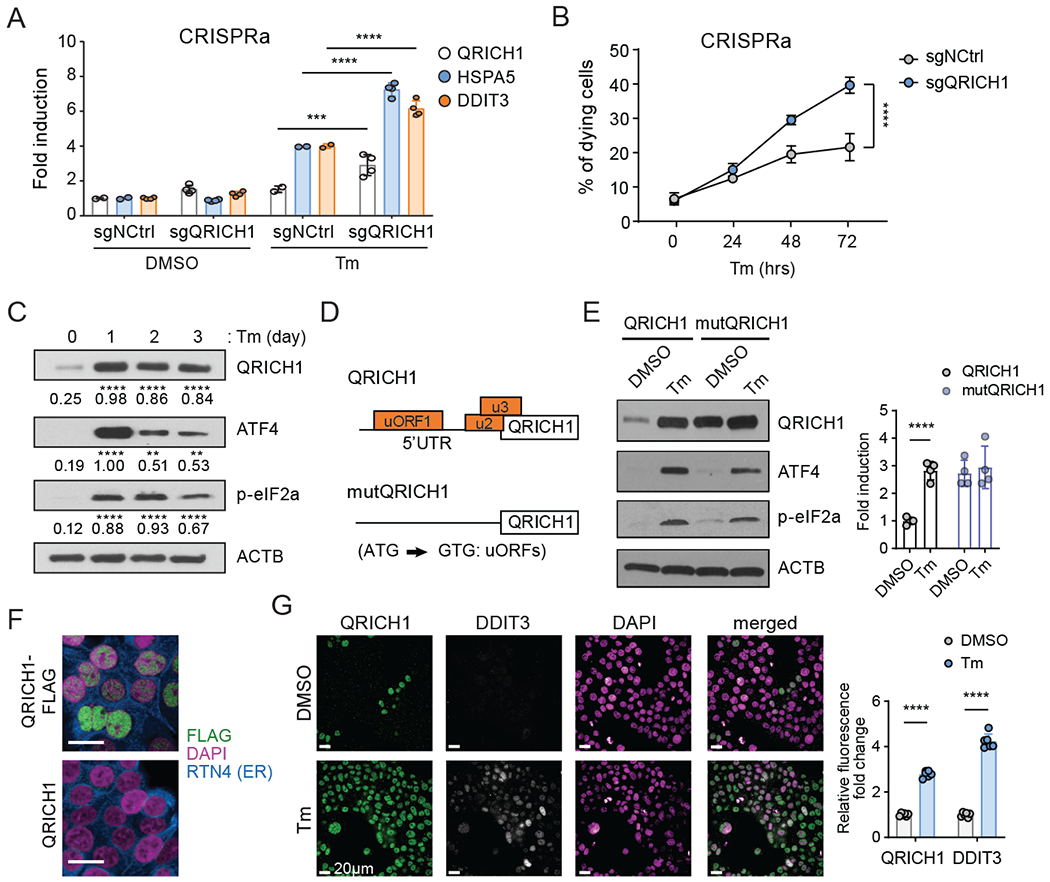
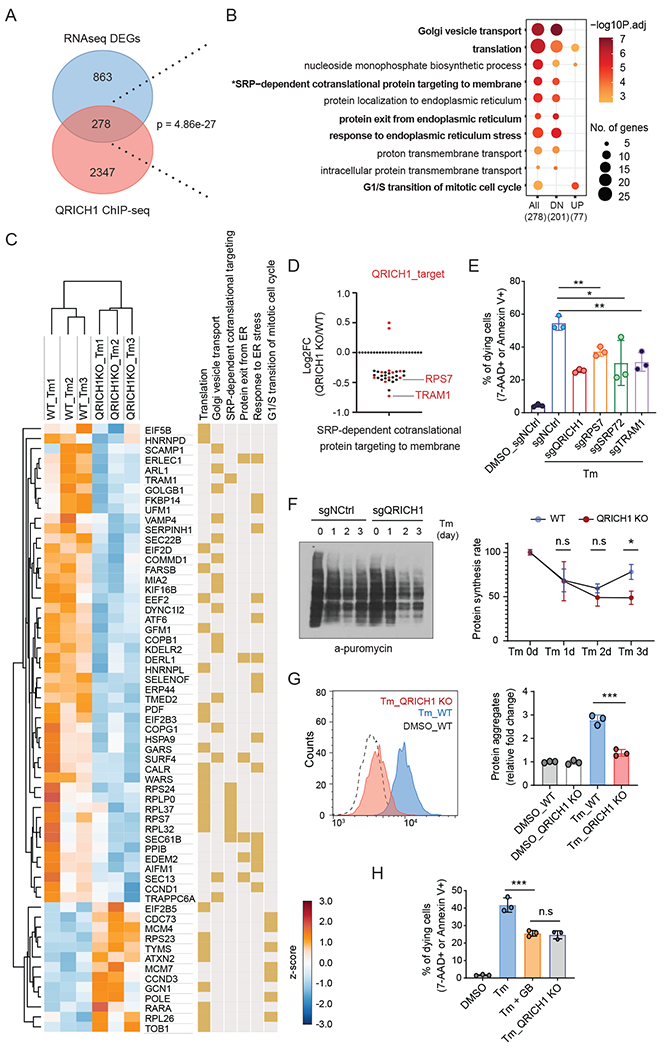
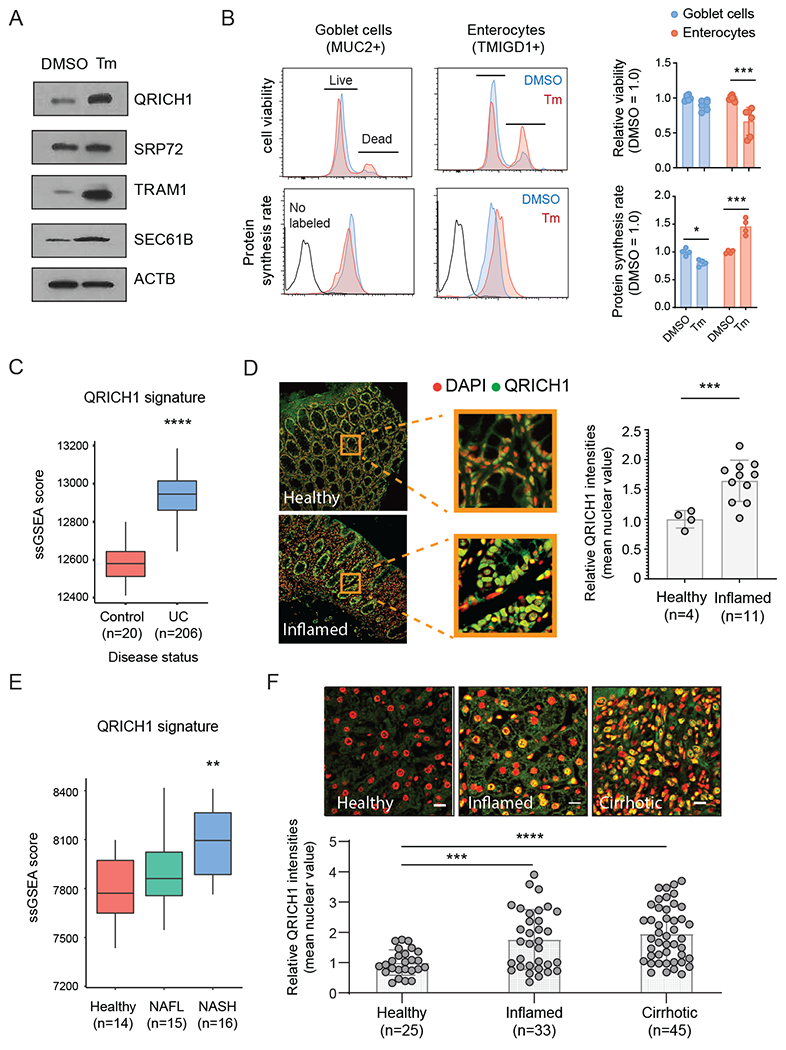
Tissue homeostasis is perturbed in a diversity of inflammatory pathologies. These changes can elicit endoplasmic reticulum (ER) stress, protein misfolding, and cell death. ER stress triggers the unfolded protein response (UPR), which can promote recovery of ER proteostasis and cell survival or trigger programmed cell death. Here, we leveraged single-cell RNA sequencing to define dynamic transcriptional states associated with the adaptive versus terminal UPR in the mouse intestinal epithelium. We integrated these transcriptional programs with genome-scale CRISPR screening to dissect the UPR pathway functionally. We identified QRICH1 as a key effector of the PERK-eIF2α axis of the UPR. QRICH1 controlled a transcriptional program associated with translation and secretory networks that were specifically up-regulated in inflammatory pathologies. Thus, QRICH1 dictates cell fate in response to pathological ER stress.


Conflict of interest statement

Competing Interests: R.J.X. is a consultant to Novartis and Nestle. A.R. is a founder and equity holder of Celsius Therapeutics, an equity holder in Immunitas Therapeutics and until August 31, 2020 was an SAB member of Syros Pharmaceuticals, Neogene Therapeutics, Asimov and ThermoFisher Scientific. From August 1, 2020, A.R. is an employee of Genentech, a member of the Roche Group.

Figures

Fig. 1.
Fig. 1.. Temporal scRNA-seq identifies gene expression signature of terminal-UPR.
(A) Experimental timeline for differentiation of intestinal organoids into monolayers and treatment with Tunicamycin (Tm). Right upper panel shows a 24-hour time course of Hspa5 and Xbp1s expression levels upon treatment with 0.5ug/ml of Tm (n=3, error bars, mean +/− SD). Right lower panel shows the ratio of Xbp1s vs. Xbp1u transcripts (n=3). Xbp1u, unspliced transcript; Xbp1s, spliced transcript. (B) ScRNA-seq tSNE plots recover known cell-types from primary intestinal monolayer cells (left) and identify transcriptomic signatures of UPR (right, colored by cell ranking). Arrows indicate the Tm-mediated positional shift. (C) The number of enterocytes and goblet cells in each condition in scRNA-seq (n=2, unpaired student t-test; *p<0.05). Goblet cells exhibit stronger resistance to prolonged UPR stress than enterocytes. (D and E) Violin (D) and scatter (E) plots of cells along the transcriptomic MDA between 13h and 25h (D) and MDAs among DMSO, 13 h, and 25 h (E). Goblet cells show more clearly distinct states between 13 h and 25 h Tm treatments compared to enterocytes. In D, bars indicate median values, and mean expression at 13 h is chosen as the baseline. (F) Linear discriminant analysis predictions show distinct and overlapping states of goblet cells (left) and enterocytes (right). Colors and coordinates, respectively, indicate the ground truths and predicted probabilities of stimulation using scRNA-seq. (G) The schematic diagram for the cellular state during ER stress. We hypothesized that terminal-UPR genes are up-regulated in the early phase of ER stress, and their persistent expression promotes UPR-mediated apoptosis under unresolved ER stress. (H) Heatmap shows the logFC of terminal-UPR genes in Tm-13h vs DMSO. Barplot shows the logFCs between Tm-25 h and Tm-13 h in enterocytes and goblet cells. Our gating strategy identified 192 terminal-UPR genes. Known and novel UPR genes are shown (novel terminal-UPR regulators are indicated by an asterisk).
Fig. 2.
Fig. 2.. Genome-wide CRISPR screens unveil gene functional proximities in, and identify novel regulators of, the UPR pathway.
(A) Schematic overview of XBP1s-GFP reporter for CRISPR screen. (B) Volcano plot of gRNA enrichment reveals putative regulators of the UPR pathway. Dashed line indicates the p-value cut-off (p<0.05). Known UPR genes and terminal-UPR genes are highlighted in red and blue, respectively. (C) Pathway interaction networks of the screen hits obtained using Cytoscape. The color code indicates pathway nodes, and GO terms represent the most significant pathway in the node. The edges show the crosstalk between the pathways. (D) Venn diagram of the CRISPR screen, single-cell analysis, and essential genes highlight 16 potent regulators of the terminal-UPR pathway. (E) Assessment of XBP1s in wild-type (red) or knockout (filled blue) cells treated with Tm by measurement of GFP intensities. Symbol indicates the targeted gene. Dashed black line indicates the GFP intensity in DMSO condition. (F) Measurement of dying (7-AAD or Annexin V positive) cells treated with Tm for 3 days (n=3, one-way ANOVA (indicated target gene values compared to Tm-treated negative control (NC)); error bars, mean +/− SD). **p<0.01, ***p<0.001, ****p<0.0001.
Fig. 3.
Fig. 3.. QRICH1 promotes cell death and its translation is upregulated by the PERK-eIF2α axis under ER stress.
(A) Measuring the transcriptional activity of UPR pathway regulators in control (sgNCtrl) or CRISPRa QRICH1 cells in normal or Tm-mediated ER stress conditions (n=4, two-way ANOVA). (B) The percentage of 7-AAD positive cells. sgNCtrl or sgQRICH1 cells treated with Tm for the indicated time. Three different guides (n=4, two-way ANOVA). (C) Immunoblot shows the time-course expression pattern of QRICH1, ATF4, and p-eIF2α during prolonged Tm treatment. A representative blot is shown (n=3, two-way ANOVA, compared to DMSO). (D) The structure of the wild type 5’UTR (containing three putative upstream ORFs) or mutated 5’UTR (substitution of A to G at the AUG translation start codon of three uORFs) of QRICH1 expression constructs. (E) Immunoblot shows the protein expression patterns of QRICH1 constructs upon DMSO or Tm treatment. ATF4 and p-eIF2α are used as markers of ER stress (n=4, multiple t-test). (F) Immunostaining for QRICH1-FLAG (green) or QRICH1 transduced cells. Nuclei and ER are stained with DAPI (magenta) and RTN4 (blue), respectively. Scale bars, 20 μm. (G) Immunostaining of endogenous QRICH1 (green) and DDIT3 (gray) in cells with DMSO or Tm treatment. Nuclei are stained with DAPI (magenta). Scale bars, 20 μm. Right graph shows the normalized intensities of QRICH1 and DDIT3 (n=6, multiple t-test). For all above panels, **p<0.01, ***p<0.005, ****p<0.0001; error bars, mean +/− SD.
Fig. 4.
Fig. 4.. QRICH1 ChIP-seq identifies QRICH1 as a promoter of protein translation activity.
(A) WT HT29 cells were treated with Tm for 24 hrs and crosslinked by formaldehyde. The cells were immunoprecipitated (IP) by anti-QRICH1 or anti-rabbit IgG and detected by immunoblot analysis. (B) The genomic annotation of QRICH1 or ATF4 ChIP-seq peaks. Promoter regions are defined as the indicated distance from the transcription start site (TSS). (C) Peak distribution of QRICH1 ChIP-seq within 3kb from the TSS. Heatmap shows the read density for QRICH1 ChIP-seq. (D) QRICH1 binding profiles on the QRICH1 promoter region in WT and QRICH1 KO cells. Black bar indicates the cloned genomic region in front of the minimal CMV promoter for the promoter activity reporter assay. (E) Level of luciferase mRNAs in WT, QRICH1 KO, and QRICH1 reconstituted (rQRICH1) cells transduced with the promoter reporter-expressing lentivirus and treated with DMSO or Tm for 24 hrs. Luciferase mRNA was measured by normalizing GFP mRNA using qRT-PCR (n=3, two-way ANOVA; *p<0.05, **p<0.01; error bars, mean +/− SD). (F and G) Functional enrichment analysis shows the top 10 enriched gene ontologies from ATF4-binding targets (F) and QRICH1-binding targets (G). (H) Venn diagram illustrating overlap of QRICH1 and ATF4 targets from ChIP-seq. GO analysis shows that the tRNA metabolic process is the most significant biological process. (I) RNA-seq shows that QRICH1 and/or ATF4-bounded tRNA synthetases are up-regulated during ER stress (n=3). An asterisk indicates the translationally upregulated genes during ER stress (28).
Fig. 5.
Fig. 5.. QRICH1 upregulates protein synthesis and secretion during ER stress.
(A) Venn diagram illustrating the overlap of QRICH1 target genes from ChIP-seq and differentially expressed genes (DEGs) between WT and QRICH1 KO cells in response to Tm treatment. (B) Functional enrichment analysis of the 278 overlapping gene set in A. All, 278 DEGs; DN, 201 down-regulated genes in QRICH1 KO cells; UP, 77 up-regulated genes in QRICH1 KO cells. (C) RNA-seq performed with WT and QRICH1 KO cells to show response to Tm treatment. Heatmap shows selective DEGs belonging to specific biological processes (related to Fig. 5B). Yellow color indicates the involved biological processes of that gene. (D) RNA-seq showed that 28 of 30 DEGs belonging to ‘SRP-mediated cotranslational ER targeting’ are down-regulated in the QRICH1 KO cells. Red dots indicate the QRICH1-target in ChIP-seq data. (E) Measurement of dying (7-AAD or Annexin V positive) cells treated with Tm for 3 days (n=3, one-way ANOVA; error bars, mean +/− SD). X-axis labels indicate the target gene. (F) Immunoblot shows the puromycin incorporation rate by anti-puromycin blot. WT and QRICH1 KO cells were pulse-labeled with puromycin after Tm treatment for the indicated times. A representative blot is shown. The graph shows the quantified intensities of anti-puromycin signals, compared to the signal of sgNCtrl-Tm 0hr (set to 100%) (n=3, two-way ANOVA; error bars, mean +/− SD, see Methods). (G) FACS analysis of WT and QRICH1 KO cells after 72 hrs Tm treatment showing the intensity of the fluorescent dye which preferentially interacts with unfolded protein aggregates (n=3, one-way ANOVA, error bars, mean +/− SD). (H) FACS analysis of cell viability in WT and QRICH1 KO cells treated with Tm or Tm plus guanabenz (GB) for 72 hrs (n=3, one-way ANOVA; error bars, mean +/− SD). For all above panels, *p<0.05, **p<0.01, ***p<0.001; n.s, not significant.
Fig. 6.
Fig. 6.. QRICH1 sensitizes primary intestinal epithelium to ER stress and is regulated during inflammatory conditions.
(A) Immunoblot shows the expression patterns of QRICH1 and SRP-mediated secretion pathway genes upon 0.5ug/ml of Tm treatment in human intestinal organoids for 24hrs. A representative blot is shown. (B) FACS analysis of human intestinal organoids shows cell-type-specific protein synthesis rates and viability during ER stress. Cells were stained with non-permeable amine-reactive dye, and anti-puromycin antibodies to assess cell viability and protein synthesis rate in goblet cells (MUC2+) and enterocytes (TMIGD1+). The graphs show quantified signals from each FACS analysis (n=6 and 4 for viability and protein synthesis rate, respectively; two-way ANOVA, error bars, mean +/− SD). (C) Single sample Gene Set Enrichment (ssGSEA) Scores for the QRICH1-signature were calculated in bulk RNA-seq data from the rectal biopsies of pediatric UC patients. Wilcoxon rank-sum test, error bars, mean +/− SD. (D) Immunofluorescence assay of a colon tissue array stained for QRICH1 (green), and nuclei (red) in the healthy and inflamed colon (two-tailed unpaired t-test, error bars, mean +/− SD). (E) ssGSEA Scores for the QRICH1-signature were calculated in bulk RNA-seq data from liver biopsy samples from healthy, NAFL, and NASH patients. Wilcoxon rank-sum test, error bars, mean +/− SD. (F) Immunofluorescence assay of a liver tissue array stained for QRICH1 (green), and nuclei (red) in healthy, inflamed, and cirrhotic livers (one-way ANOVA, error bars, mean +/− SD). For all above panels: **p<0.01, ***p<0.001, ****p<0.0001.

References

    1. Pakos-Zebrucka K et al., The integrated stress response. EMBO Rep 17, 1374–1395 (2016). - PMC - PubMed
    1. Hetz C, Chevet E, Oakes SA, Proteostasis control by the unfolded protein response. Nat Cell Biol 17, 829–838 (2015). - PMC - PubMed
    1. Wang M, Kaufman RJ, Protein misfolding in the endoplasmic reticulum as a conduit to human disease. Nature 529, 326–335 (2016). - PubMed
    1. Hetz C, Papa FR, The Unfolded Protein Response and Cell Fate Control. Mol Cell 69, 169–181 (2018). - PubMed
    1. Kirby A et al., Mutations causing medullary cystic kidney disease type 1 lie in a large VNTR in MUC1 missed by massively parallel sequencing. Nat Genet 45, 299–303 (2013). - PMC - PubMed

Publication types

MeSH terms