. 2020 Dec 31;10(1):22452.
doi: 10.1038/s41598-020-80253-w.

Magnetic spatiotemporal control of SOS1 coupled nanoparticles for guided neurite growth in dopaminergic single cells

Affiliations

Magnetic spatiotemporal control of SOS1 coupled nanoparticles for guided neurite growth in dopaminergic single cells

Fabian Raudzus et al. Sci Rep. .

Abstract

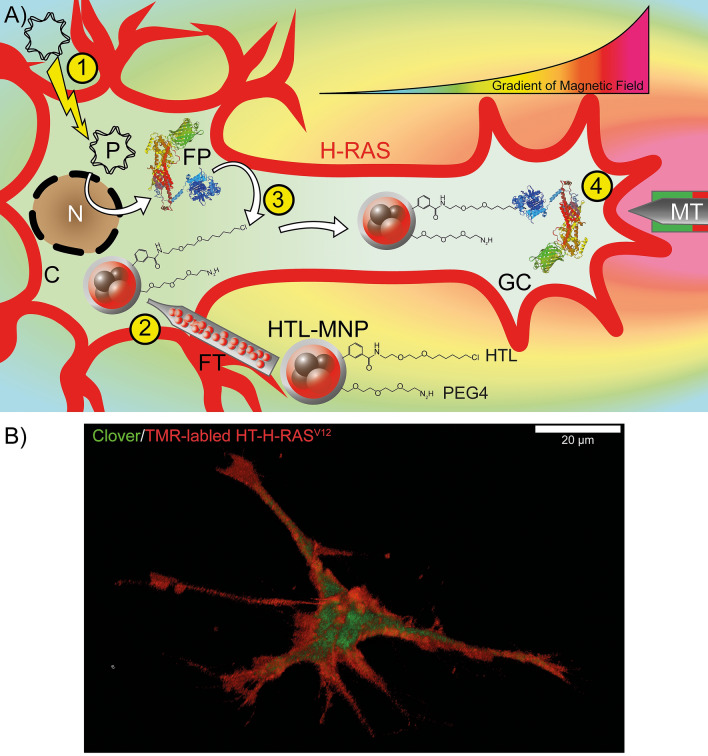
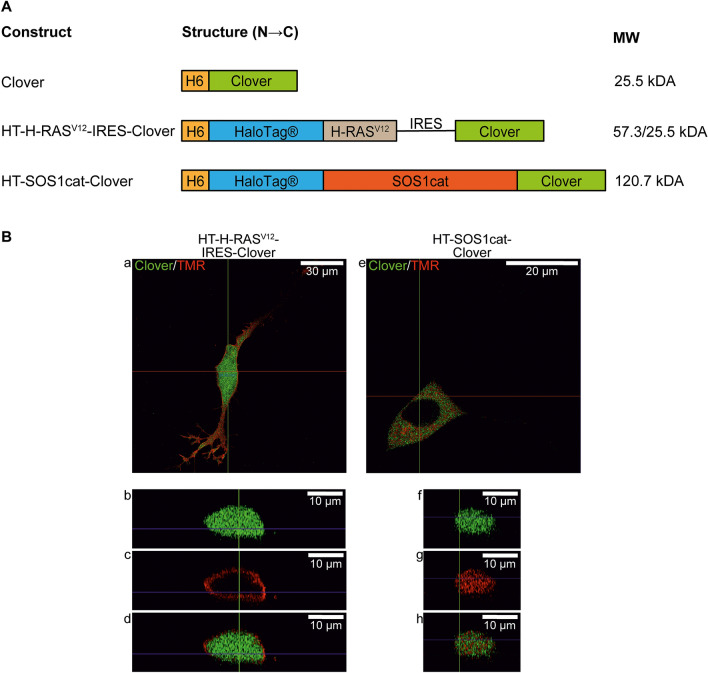
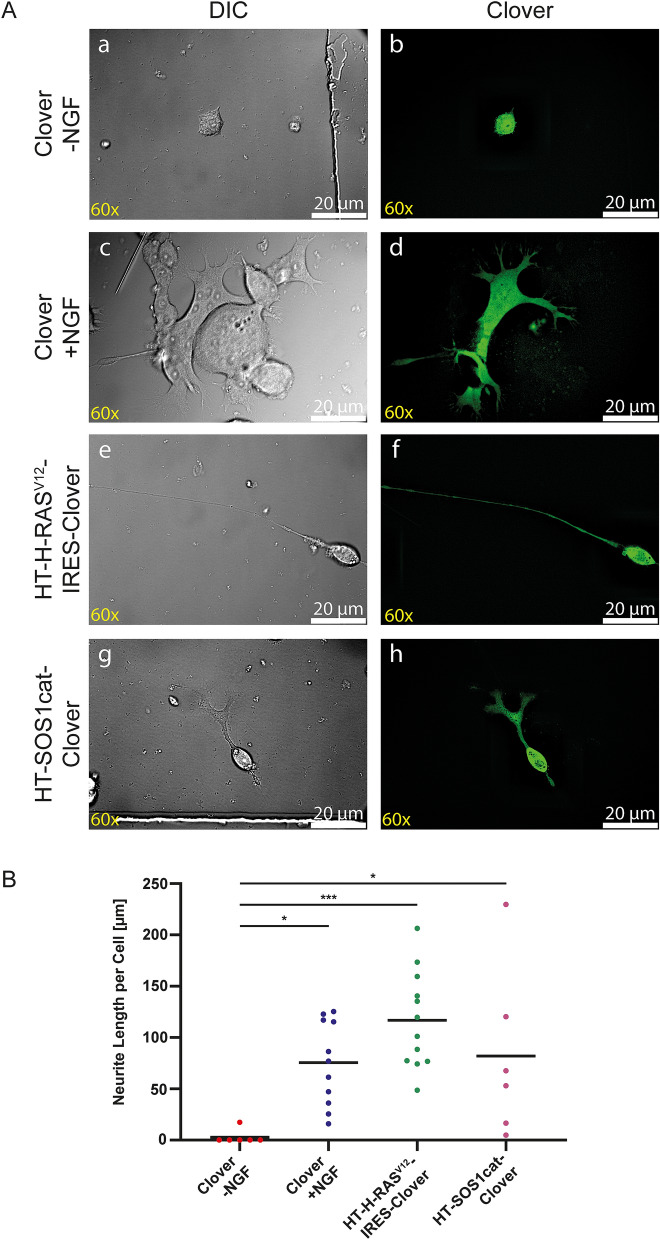
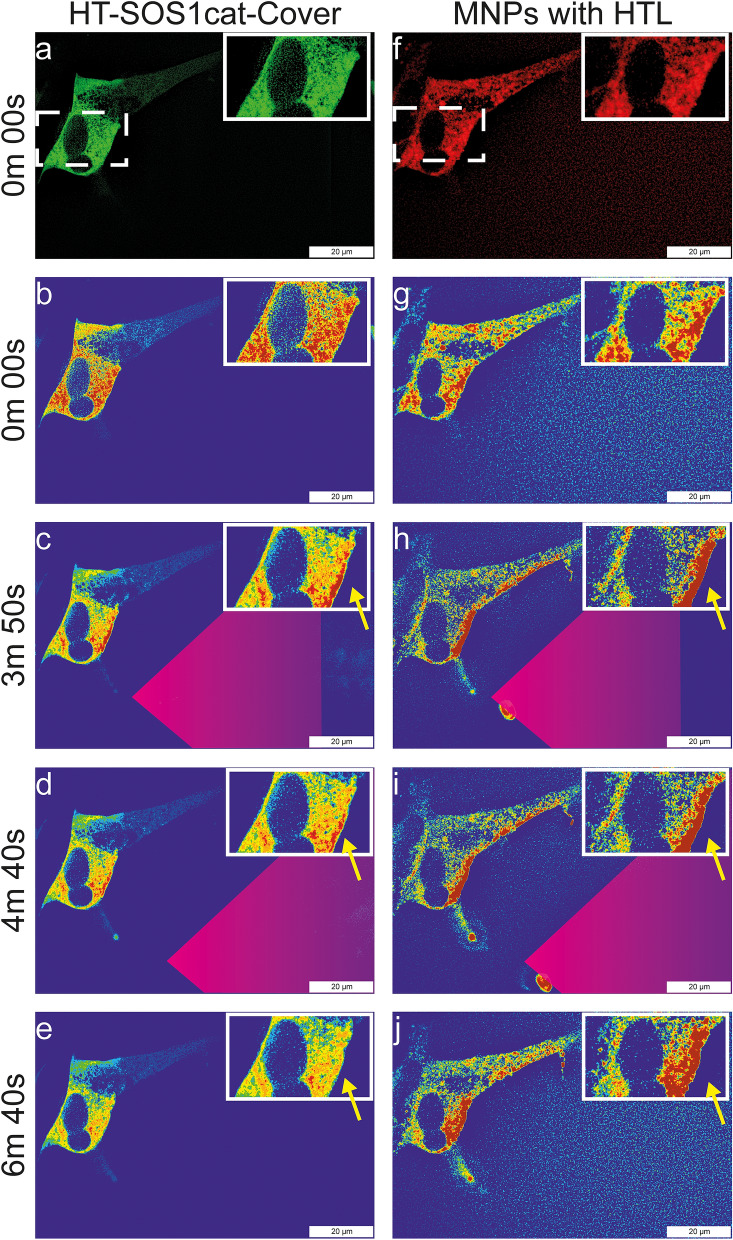
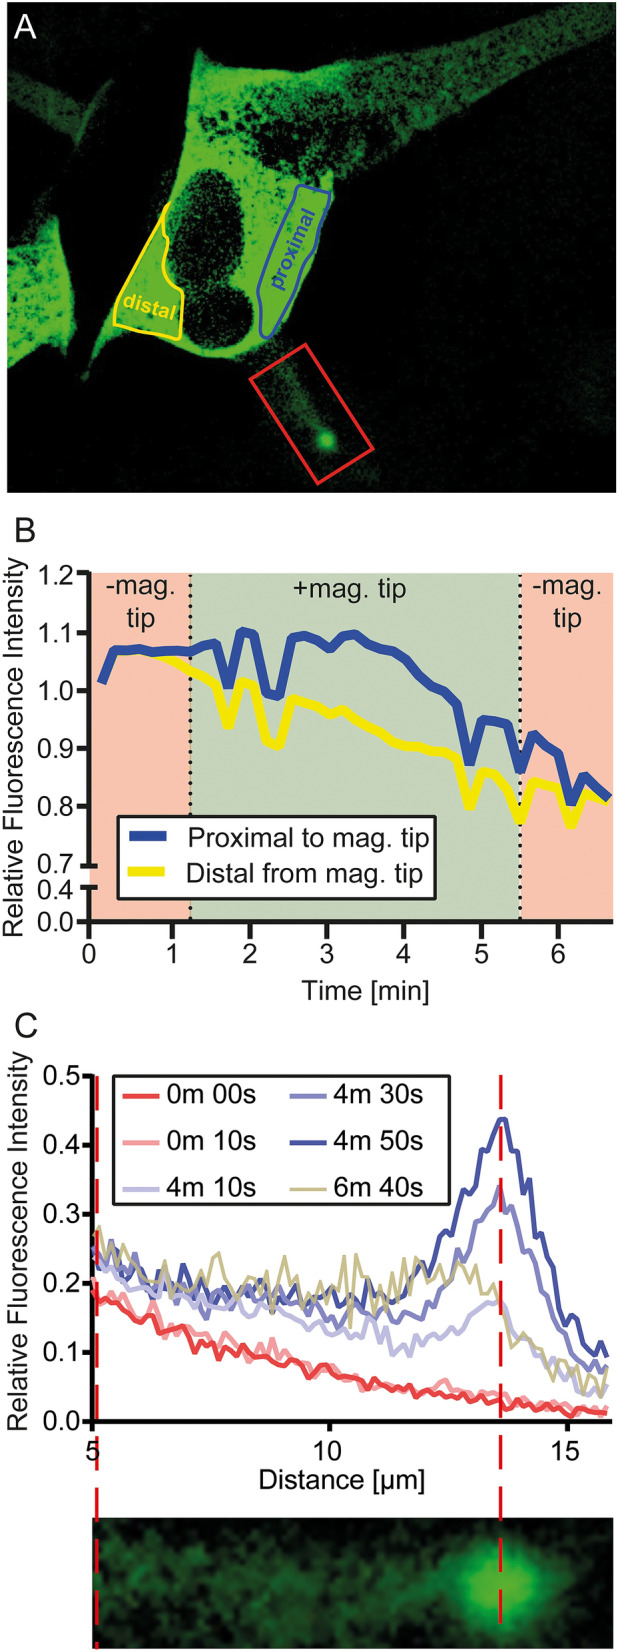
The axon regeneration of neurons in the brain can be enhanced by activating intracellular signaling pathways such as those triggered by the membrane-anchored Rat sarcoma (RAS) proto-oncogene. Here we demonstrate the induction of neurite growth by expressing tagged permanently active Harvey-RAS protein or the RAS-activating catalytic domain of the guanine nucleotide exchange factor (SOS1cat), in secondary dopaminergic cells. Due to the tag, the expressed fusion protein is captured by functionalized magnetic nanoparticles in the cytoplasm of the cell. We use magnetic tips for remote translocation of the SOS1cat-loaded magnetic nanoparticles from the cytoplasm towards the inner face of the plasma membrane where the endogenous Harvey-RAS protein is located. Furthermore, we show the magnetic transport of SOS1cat-bound nanoparticles from the cytoplasm into the neurite until they accumulate at its tip on a time scale of minutes. In order to scale-up from single cells, we show the cytoplasmic delivery of the magnetic nanoparticles into large numbers of cells without changing the cellular response to nerve growth factor. These results will serve as an initial step to develop tools for refining cell replacement therapies based on grafted human induced dopaminergic neurons loaded with functionalized magnetic nanoparticles in Parkinson model systems.


Conflict of interest statement

The authors declare no competing interests.

Figures

Figure 1
Figure 1
(A) Schematic outline of the experimental design. (1) The plasmid coding for HT-SOS1cat-Clover is electroporated, and the protein is expressed in the cell. (2) 48 h after the electroporation, magnetic nanoparticles functionalized with HaloTag Ligand (HTL-MNPs) are microinjected into the cell. (3) HT-SOS1cat-Clover is captured by the HTL-MNPs in the cytoplasm due to specific covalent binding of the HT to its ligand. (4) A magnetic tip is moved towards the neurite extension, which causes an accumulation of HT-SOS1cat-coupled MNPs in the growth cone in response to the applied magnetic field. Thus, HT-SOS1cat-Clover is translocated into the vicinity of the endogenous, membrane-anchored H-RAS, which cycles between its inactive GDP-bound and signaling active GTP-bound conformations. The magnetic field gradient is indicated by the curve above the growth cone (high magnetic field in red, low magnetic field in green; arbitrary units) and by the corresponding color gradient of the background. C cytoplasm, FP HT-SOS1cat-Clover fusion protein, FT Femtotip, GC growth cone, MT magnetic tip, N nucleus, P plasmid. Membrane-anchored H-RAS is indicated by the broad and thick red outline of the cell. (B) A three-dimensional confocal image of a PC12 cell transfected with HT-H-RASV12-IRES-Clover after in-cell binding of the red-fluorescent cell-permeable dye TMR-HTL 2 days after the transfection. Note that morphological differentiation was achieved in the absence of NGF due to the neurite promoting activity of H-RASV12 after the transfection (see Fig. 3). Three-dimensional reconstruction was performed using images from 55 Z-layers that cover a total distance of 18.9 µm. The scale bar represents 20 µm.
Figure 2
Figure 2
Domain structures of the constructs and intracellular distribution of expressed recombinant fusion proteins. (A) Constructs of the proteins. H6 poly(6)histidine tag, H-RASV12 Harvey-RASV12, IRES Internal Ribosome Entry Site, SOS1cat catalytic domain of son of sevenless 1. (B) Confocal imaging of SH-SY5Y cells transfected with either HT-H-RASV12-IRES-Clover (a–d) or HT-SOS1cat-Clover (e–h) after in-cell binding of the red-fluorescent cell-permeable dye TMR-HTL 2 days after the transfection. Overlay images derived from green and red fluorescence channels are shown (a,e), and cross-sections indicated by the horizontal red line confirm that Clover is distributed equally in the cytoplasm and nucleus of HT-H-RASV12-IRES-Clover-transfected cells (b,d), whereas HT-H-RASV12 is exclusively located at the plasma membrane (c,d). In cells transfected with HT-SOS1cat-Clover, the Clover and TMR fluorescence are colocalized in the cytoplasm (f–h). For HT-SOS1cat-Clover, exclusion from the nucleus is visible (e).
Figure 3
Figure 3
Morphological changes of PC12 cells upon the transfection of HT fusion proteins. (A) Wide-field (a,c,e,g) and fluorescent images (b,d,f,h). As a negative control, cells were only transfected with Clover and cultured in the absence of NGF (a,b). No morphological changes were induced, and the negative control cells appeared comparable to non-transfected cells when cultured in the absence of NGF (not shown). As a positive control, 50 ng/ml NGF was added to Clover-transfected cells for 2 days. An increase in cell volume, multinucleation, and outgrowth of cellular protrusions was detected in these cells (c,d). The transfection of PC12 cells with HT-H-RASV12-IRES-Clover (e,f) or HT-SOS1cat-Clover (g,h) resulted in the outgrowth of neurites of different lengths. Scale bars correspond to 20 µm. (B) Comparison of neurite lengths. PC12 cells were transfected with Clover (control), HT-H-RASV12-IRES-Clover, or HT-SOS1cat-Clover and cultivated for one day in proliferation medium followed by two days in differentiation medium. Clover-transfected PC12 cells were either cultured in the absence of NGF (− NGF; negative control) or with 50 ng/ml NGF (+ NGF; positive control). HT-H-RASV12-IRES-Clover and HT-SOS1cat-Clover were cultured without NGF. (Clover − NGF: n = 6; Clover + NGF: n = 11; HT-H-RASV12-IRES-Clover: n = 12; HT-SOS1cat-Clover: n = 6; two independent experiments; one-way ANOVA with Dunnett’s multiple comparisons test; confidence interval = 95%, *P ≤ 0.05; ***P ≤ 0.001).
Figure 4
Figure 4
Magnetic manipulation of HT-SOS1cat-Clover-transfected SH-SY5Y cells upon the injection of HTL-MNPs. The fluorescence of HT-SOS1cat-Clover is shown in the left column (Supplementary Video S5), and the fluorescence of the HTL-MNPs is shown in the right column (Supplementary Video S6). For better visualization of the corresponding fluorescence intensities, a rainbow color scheme was applied, with red corresponding to high, yellow to medium, and blue to low fluorescence intensities (for HT-SOS1cat-Clover: Supplementary Video S7; for HTL-MNPs: Supplementary Video S8). The insets show magnifications of the ROI. (a,b) At 0 min 00 s, HT-SOS1cat-Clover was distributed homogeneously in the cytoplasm. (f,g) HTL-MNPs were slightly accumulated on the left and right sides of the nucleus of the cell in the ROI. (h) At 3 min 50 s, HTL-MNPs were attracted towards the magnetic tip and accumulated at the proximal plasma membrane. (c) Similar behavior was seen for HT-SOS1cat-Clover, although the change in fluorescence intensity was weaker. (i,d) When the tip was moved at 4 min 40 s, HTL-MNPs moved into the small neurite and an increase of HT-SOS1cat-Clover fluorescence was observed. (j,e) After the tip was removed, HTL-MNPs and HT-SOS1cat-Clover began to diffuse in the next two minutes. Scale bars correspond to 20 µm.
Figure 5
Figure 5
Analysis of the magnetic manipulation of HTL-MNP-bound HT-SOS1cat-Clover in SH-SY5Y cells. (A) An image of a SH-SY5Y cell expressing HT-SOS1cat-Clover injected with HTL-MNPs (MNP fluorescence not shown). The ROI of the cell body distal from the magnetic tip is indicated in yellow. The ROI of the cell body proximal to the magnetic tip is indicated in the region enclosed by the blue line. (B) Normalized and bleaching corrected RFI of both ROIs over time. − mag. tip indicates the period from when the magnetic tip was not in the field of observation (before 1 min 10 s and after 5 min 30 s). + mag. tip indicates when the magnetic tip was in the field of observation (1 min 10 s to 5 min 30 s). The differential area of fluorescence intensities during the application of the magnetic tip (+ mag. tip) between the blue (proximal to tip) and yellow (distal to tip) curves indicates a formal redistribution of HT-SOS1cat-Clover by about 12%. (C) The line profile of the fiber including its tip [red ROI in (A)] at different time points. The red broken lines indicate the position of the maximal fluorescence in the fiber´s tip.

Similar articles

Cited by

References

    1. Thiede-Stan NK, Schwab ME. Attractive and repulsive factors act through multi-subunit receptor complexes to regulate nerve fiber growth. J. Cell Sci. 2015;128:2403–2414. doi: 10.1242/jcs.165555. - DOI - PubMed
    1. Attwell CL, van Zwieten M, Verhaagen J, Mason MRJ. The dorsal column lesion model of spinal cord injury and its use in deciphering the neuron-intrinsic injury response. Dev. Neurobiol. 2018;78:926–951. doi: 10.1002/dneu.22601. - DOI - PMC - PubMed
    1. Fawcett JW, Verhaagen J. Intrinsic determinants of axon regeneration. Dev. Neurobiol. 2018;78:890–897. doi: 10.1002/dneu.22637. - DOI - PubMed
    1. Heumann R, Korsching S, Bandtlow C, Thoenen H. Changes of nerve growth factor synthesis in nonneuronal cells in response to sciatic nerve transection. J. Cell Biol. 1987;104:1623–1631. doi: 10.1083/jcb.104.6.1623. - DOI - PMC - PubMed
    1. Reier PJ, Bregman BS, Wujek JR. Intraspinal transplantation of embyronic spinal cord tissue in neonatal and adult rats. J. Comp. Neurol. 1986;247:275–296. doi: 10.1002/cne.902470302. - DOI - PubMed

Publication types