Repurposing FDA Approved Drugs as JNK3 Inhibitor for Prevention of Neuroinflammation Induced by MCAO in Rats
- PMID: 33384558
- PMCID: PMC7770337
- DOI: 10.2147/JIR.S284471
Repurposing FDA Approved Drugs as JNK3 Inhibitor for Prevention of Neuroinflammation Induced by MCAO in Rats
Retraction in
-
Repurposing FDA Approved Drugs as JNK3 Inhibitor for Prevention of Neuroinflammation Induced by MCAO in Rats [Retraction].J Inflamm Res. 2022 Nov 7;15:6069-6070. doi: 10.2147/JIR.S395887. eCollection 2022. J Inflamm Res. 2022. PMID: 36386593 Free PMC article.
Abstract
Background: Stress-associated kinases are considered major pathological mediators in several incurable neurological disorders. Importantly, among these stress kinases, the c-Jun NH2-terminal kinase (JNK) has been linked to numerous neuropathological conditions, including oxidative stress, neuroinflammation, and brain degeneration associated with brain injuries such as ischemia/reperfusion injury. In this study, we adopted a drug repurposing/reprofiling approach to explore novel JNK3 inhibitors from FDA-approved medications to supplement existing therapeutic strategies.
Materials and methods: We performed in silico docking analysis and molecular dynamics simulation to screen potential candidates from the FDA approved drug library using the standard JNK inhibitor SP600125 as a reference. After the virtual screening, dabigatran, estazolam, leucovorin, and pitavastatin were further examined in ischemic stroke using an animal rodent model of focal cerebral ischemia using transient middle cerebral artery occlusion (t-MCAO). The selected drugs were probed for neuroprotective effectiveness by measuring the infarct area (%) and neurological deficits using a 28-point composite score. Biochemical assays including ELISA and immunohistochemical experiments were performed.
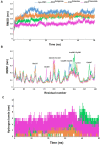
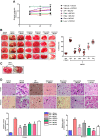
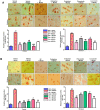
Results: We obtained structural insights for dabigatran, estazolam, and pitavastatin binding to JNK3, revealing a significant contribution of the hydrophobic regions and significant residues of active site regions. To validate the docking results, the pharmacological effects of dabigatran, estazolam, leucovorin, and pitavastatin on MCAO were tested in parallel with the JNK inhibitor SP600125. After MCAO surgery, severe neurological deficits were detected in the MCAO group compared with the sham controls, which were significantly reversed by dabigatran, estazolam, and pitavastatin treatment. Aberrant morphological features and brain damage were observed in the ipsilateral cortex and striatum of the MCAO groups. The drugs restored the anti-oxidant enzyme activity and reduced the levels of oxidative stress-induced p-JNK and neuroinflammatory mediators such as NF-kB and TNF-ɑ in rats subjected to MCAO.
Conclusion: Our results demonstrated that the novel FDA-approved medications attenuate ischemic stroke-induced neuronal degeneration, possibly by inhibiting JNK3. Being FDA-approved safe medications, the use of these drugs can be clinically translated for ischemic stroke-associated brain degeneration and other neurodegenerative diseases associated with oxidative stress and neuroinflammation.
Keywords: JNK3 inhibitors; JNK3 kinase; MCAO stroke; brain degeneration; in silico docking; neuroinflammation; re-purposing.
© 2020 Zulfiqar et al.
Conflict of interest statement
The authors report no conflicts of interest in this work.
Figures


Similar articles
-
Identification of novel and potential PPARγ stimulators as repurposed drugs for MCAO associated brain degeneration.Toxicol Appl Pharmacol. 2022 Jul 1;446:116055. doi: 10.1016/j.taap.2022.116055. Epub 2022 May 10. Toxicol Appl Pharmacol. 2022. PMID: 35550883
-
NF-κB Inhibitors Attenuate MCAO Induced Neurodegeneration and Oxidative Stress-A Reprofiling Approach.Front Mol Neurosci. 2020 Mar 24;13:33. doi: 10.3389/fnmol.2020.00033. eCollection 2020. Front Mol Neurosci. 2020. Retraction in: Front Mol Neurosci. 2023 Aug 21;16:1275831. doi: 10.3389/fnmol.2023.1275831. PMID: 32292329 Free PMC article. Retracted.
-
Piceatannol improved cerebral blood flow and attenuated JNK3 and mitochondrial apoptotic pathway in a global ischemic model to produce neuroprotection.Naunyn Schmiedebergs Arch Pharmacol. 2024 Jan;397(1):479-496. doi: 10.1007/s00210-023-02616-0. Epub 2023 Jul 20. Naunyn Schmiedebergs Arch Pharmacol. 2024. PMID: 37470802
-
JNK3 inhibitors as promising pharmaceuticals with neuroprotective properties.Cell Adh Migr. 2024 Dec;18(1):1-11. doi: 10.1080/19336918.2024.2316576. Epub 2024 Feb 15. Cell Adh Migr. 2024. PMID: 38357988 Free PMC article. Review.
-
c-Jun N-Terminal Kinases (JNKs) in Myocardial and Cerebral Ischemia/Reperfusion Injury.Front Pharmacol. 2018 Jul 5;9:715. doi: 10.3389/fphar.2018.00715. eCollection 2018. Front Pharmacol. 2018. PMID: 30026697 Free PMC article. Review.
Cited by
-
Suppression of LPS-Induced Inflammation and Cell Migration by Azelastine through Inhibition of JNK/NF-κB Pathway in BV2 Microglial Cells.Int J Mol Sci. 2021 Aug 23;22(16):9061. doi: 10.3390/ijms22169061. Int J Mol Sci. 2021. PMID: 34445767 Free PMC article.
-
Recycled Translation: Repurposing Drugs for Stroke.Transl Stroke Res. 2022 Dec;13(6):866-880. doi: 10.1007/s12975-022-01000-z. Epub 2022 Feb 26. Transl Stroke Res. 2022. PMID: 35218497 Free PMC article. Review.
-
Alpha-Linolenic Acid Impedes Cadmium-Induced Oxidative Stress, Neuroinflammation, and Neurodegeneration in Mouse Brain.Cells. 2021 Sep 1;10(9):2274. doi: 10.3390/cells10092274. Cells. 2021. PMID: 34571925 Free PMC article.
-
Interaction of Cardiovascular Nonmodifiable Risk Factors, Comorbidities and Comedications With Ischemia/Reperfusion Injury and Cardioprotection by Pharmacological Treatments and Ischemic Conditioning.Pharmacol Rev. 2023 Jan;75(1):159-216. doi: 10.1124/pharmrev.121.000348. Epub 2022 Dec 8. Pharmacol Rev. 2023. PMID: 36753049 Free PMC article. Review.
-
Carveol Promotes Nrf2 Contribution in Depressive Disorders through an Anti-inflammatory Mechanism.Oxid Med Cell Longev. 2022 Mar 7;2022:4509204. doi: 10.1155/2022/4509204. eCollection 2022. Oxid Med Cell Longev. 2022. Retraction in: Oxid Med Cell Longev. 2023 Aug 2;2023:9821732. doi: 10.1155/2023/9821732. PMID: 35295720 Free PMC article. Retracted.
References
-
- Association AH. Heart and Stroke Statistical Update. Vol. 2000 Dallas, Texas: American Heart Association; 2001.
-
- Benjamin EJ, Virani SS, Callaway CW, et al. Heart disease and stroke statistics-2018 update: A report from the American heart association. Circulation. 2018;137(12):e67–e492. - PubMed
Publication types
LinkOut - more resources
Full Text Sources
Research Materials
Miscellaneous

