. 2020 Dec 15:13:598811.
doi: 10.3389/fnmol.2020.598811. eCollection 2020.

Acetylcholine Muscarinic Receptors in Ventral Hippocampus Modulate Stress-Induced Anxiety-Like Behaviors in Mice

Affiliations

Acetylcholine Muscarinic Receptors in Ventral Hippocampus Modulate Stress-Induced Anxiety-Like Behaviors in Mice

Li Mei et al. Front Mol Neurosci. .

Abstract

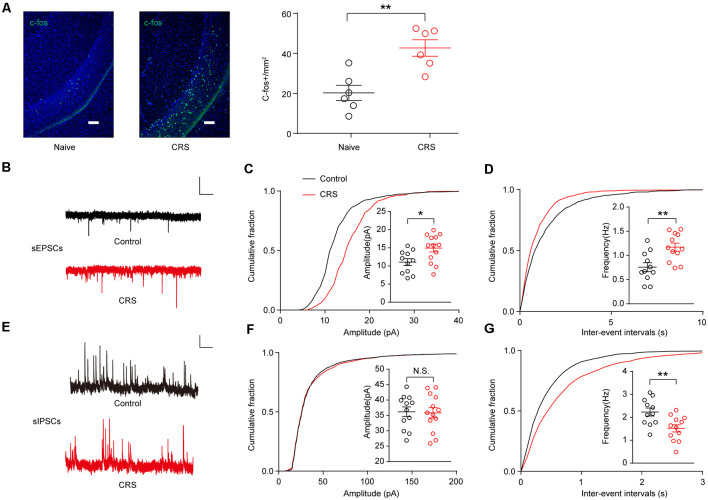
Chronic stress exposure increases the risk of developing various neuropsychiatric illnesses. The ventral hippocampus (vHPC) is central to affective and cognitive processing and displays a high density of acetylcholine (ACh) muscarinic receptors (mAChRs). However, the precise role of vHPC mAChRs in anxiety remains to be fully investigated. In this study, we found that chronic restraint stress (CRS) induced social avoidance and anxiety-like behaviors in mice and increased mAChR expression in the vHPC. CRS increased the vHPC ACh release in behaving mice. Moreover, CRS altered the synaptic activities and enhanced neuronal activity of the vHPC neurons. Using pharmacological and viral approaches, we showed that infusing the antagonist of mAChRs or decreasing their expression in the vHPC attenuated the anxiety-like behavior and rescued the social avoidance behaviors in mice probably due to suppression of vHPC neuronal activity and its excitatory synaptic transmission. Our results suggest that the changes of neuronal activity and synaptic transmission in the vHPC mediated by mAChRs may play an important role in stress-induced anxiety-like behavior, providing new insights into the pathological mechanism and potential pharmacological target for anxiety disorders.

Keywords: acetylcholine muscarinic receptors; anxiety; chronic stress; electrophysiology; hippocampus; scopolamine.


Conflict of interest statement

The authors declare that the research was conducted in the absence of any commercial or financial relationships that could be construed as a potential conflict of interest.

Figures

Figure 1
Figure 1
Chronic restraint stress (CRS) induces social avoidance and anxiety-like behaviors and increases acetylcholine (ACh) muscarinic receptor (mAChR) expression in ventral hippocampus (vHPC) in mice. (A) CRS procedure: mice were restrained for 2 h/day for 10 days and subsequently subjected to behavioral tests. (B) Representative tracks of control and stress group in social interaction (SI) test. (C) SI time in the absence or presence of social target. Two-way analysis of variance (ANOVA), F(1,56) = 5.631, p < 0.001. (D) The ratio in the SI test was decreased in the CRS group. Unpaired two-tailed Student’s t-test, t(28) = 4.086, p < 0.001. (E) Representative tracks of control and stress group in the open-field test (OFT). (F) Mice after CRS spent more time in the center area of the OFT. Unpaired two-tailed Student’s t-test, t(28) = 2.899, p = 0.0072. (G) Control and CRS mice showed no difference in total distance. Unpaired two-tailed Student’s t-test, t(28) = 0.5412, p = 0.5927. (H) Representative tracks of control and stress group in the elevated plus maze (EPM). (I) Mice after CRS spent less time in the open arms of EPM. Unpaired two-tailed Student’s t-test, t(28) = 3.183, p = 0.0036. (J) Mice after CRS spent more time in the closed arms of EPM. Unpaired two-tailed Student’s t-test, t(28) = 3.915, p < 0.001. (K) The mRNA expression of different mAChR subtypes in the vHPC in control and CRS mice. Unpaired two-tailed Student’s t-test. (L) The protein levels of M1 were increased in the vHPC of CRS mice. Unpaired two-tailed Student’s t-test, t(6) = 5.097, p = 0.0022. The data are presented as the mean ± SEM, N.S.: not significant, *p < 0.05, **p < 0.01, ***p < 0.001. The numbers of mice are shown in parentheses.
Figure 2
Figure 2
Transient restraint stress increases ACh muscarinic receptor (mAChR) signal in behaving mice. (A) Left, schematic of the fiber photometry setup. Right, a representative image validates GAch2.0 expression (green) and optical fiber tract above the vHPC. Scale bar, 500 μM. (B,C) PETH plot (B) and heat map (C) of fluorescence transients from a representative mouse aligned to the start of the restraint stress. (D) Quantification of change in fluorescence intensity before and after restraint stress (N = 5 mice). Paired Student’s t-test, t(4) = 7.754, p = 0.0015. PETH plot (E) and heat map (F) of fluorescence transients from a representative mouse, which went through 9 days of CRS, aligned to the start of restraint stress on day 10. (G) Quantification of change in fluorescence intensity before and after restraint stress (N = 5 mice). Paired Student’s t-test, t(4) = 6.399, p = 0.0031. The data are presented as the mean ± SEM, **p < 0.01. The numbers of mice are shown in parentheses.
Figure 3
Figure 3
CRS increases ventral hippocampal activity by enhancing excitatory postsynaptic currents (EPSCs) and decreasing inhibitory postsynaptic currents (IPSCs). (A) Representative images of c-Fos (green) staining in the vHPC. Scale bar, 100 μM (Left). Quantification of vHPC c-Fos+ cells after CRS (Right). Unpaired two-tailed Student’s t-test, t (10) = 4.013, p = 0.0025. (B) Representative spontaneous EPSC (sEPSC) traces of neurons in vHPC. Scale bar: 10 pA, 1 s. (C) Cumulative distribution of sEPSC amplitudes and average amplitudes. Unpaired two-tailed Student’s t-test, t(22) = 2.685, p = 0.0135. (D) Cumulative distribution of sEPSC inter-event intervals and average frequencies. Unpaired two-tailed Student’s t-test, t(21) = 3.337, p = 0.0031. (E) Representative spontaneous IPSC (sIPSC) traces of neurons in vHPC. Scale bar: 10 pA, 1 s. (F) Cumulative distribution of sIPSC amplitudes and average amplitudes. Unpaired two-tailed Student’s t-test, t(23) = 0.1448, p = 0.8862. (G) Cumulative distribution of sIPSC inter-event intervals and average frequencies. Unpaired two-tailed Student’s t-test, t(21) = 3.027, p = 0.0064. The data are presented as the mean ± SEM, N.S.: not significant, *p < 0.05, **p < 0.01. The numbers of recording neurons are shown in parentheses.
Figure 4
Figure 4
Scopolamine reverses the enhanced spontaneous excitatory postsynaptic currents (sEPSCs) in vHPC neurons and rescues CRS-induced mouse social avoidance and anxiety-like behaviors. (A) Representative sEPSC traces before, during, and after wash of scopolamine. Scale bar: 10 pA, 1 s. (B) Cumulative distribution of sEPSC amplitudes and average amplitudes. One-way ANOVA/least square difference (LSD) post hoc test. F(1.619,14.57) = 18.99, p = 0.0002. Before vs. scopolamine, t(9) = 4.369, p = 0.0036. Wash vs. scopolamine, t(9) = 5.028, p = 0.0014. (C) Cumulative distribution of sEPSC inter-event intervals and average frequencies. One-way ANOVA/LSD post hoc test. F(1.283,11.55) = 30.79, p < 0.0001. Before vs. scopolamine, t(9) = 5.376, p = 0.0009. Wash vs. scopolamine, t(9) = 6.081, p = 0.0004. (D) Representative spontaneous inhibitory postsynaptic current (sIPSC) traces before, during, and after wash of scopolamine. Scale bar: 10 pA, 1 s. (E) Cumulative distribution of sIPSC amplitudes and average amplitudes. One-way ANOVA/LSD post hoc test. F(1.878,16.9) = 0.009277, p = 0.9882. Before vs. scopolamine, t(9) = 0.0377, p > 0.9999. Wash vs. scopolamine, t(9) = 0.1537, p > 0.9999. (F) Cumulative distribution of sIPSC inter-event intervals and average frequencies. One-way ANOVA/LSD post hoc test. F(1.839,16.55) = 0.5085, p = 0.5954. Before vs. scopolamine, t(9) = 0.9347, p = 0.7487. Wash vs. scopolamine, t(9)s = 0.5731, p > 0.9999. (G) Cartoon shows drug delivery in vHPC. (H) SI time in the absence or presence of social target. Two-way ANOVA/LSD post hoc test, F(1,84) = 5.414, p = 0.022, targetACSF + stress vs. targetscopolamine + stress, t = 4.466, p < 0.001). (I) The ratio in the SI test. Two-way ANOVA/LSD post hoc test. F(1,42) = 13.28, p < 0.001. CRS + artificial cerebrospinal fluid (ACSF) vs. CRS + scopolamine, t = 4.651, p < 0.0001. (J) The time spent in the center of OFT. Two-way ANOVA/LSD post hoc test. F(1,42) = 3.671, p = 0.0621. CRS + ACSF vs. CRS + scopolamine, t = 2.975, p = 0.0097. (K) Mice total distance in OFT. Two-way ANOVA/LSD post hoc test. F(1,42) = 1.414, p = 0.291. CRS + ACSF vs. CRS + scopolamine, t = 0.7562, p = 0.7016. (L) The time spent in the open arms of elevated plus maze (EPM). Two-way ANOVA/LSD post hoc test. F(1,42) = 7.212, p = 0.0103. CRS + ACSF vs. CRS + scopolamine, t = 3.935, p = 0.015. The data are presented as the mean ± SEM, N.S.: not significant, *p < 0.05, **p < 0.01, ***p < 0.001. The numbers of recording neurons are shown in parentheses.
Figure 5
Figure 5
M1 knockdown in the vHPC reverses anxiogenic effect of CRS. (A) Representative confocal images of AAV-U6-M1shRNA-CMV-RFP (red) distribution in the vHPC. Scale bar, 500 μM; inset, 100 μM. (B) The protein levels of M1 were decreased in the vHPC of mice injected with an AAV expressing M1-shRNA. Unpaired two-tailed Student’s t-test, t (10) = 7.269, p < 0.001. (C) Left, spikes elicited after 200 pA current injection in vHPC neurons. Scale bar, 20 pA, 100 ms. Right, spikes elicited in vHPC neurons in response to current injection. Two-way ANOVA/LSD post hoc test. F(1,264) = 47.91, p < 0.001. (D) Representative spontaneous excitatory postsynaptic currents (sEPSCs) traces of neurons in vHPC. (E,F) M1 knockdown decreased sEPSCs amplitude (E), Unpaired two-tailed Student’s t-test, t(36) = 2.241, p = 0.0313, and frequency of vHPC neurons. Unpaired two-tailed Student’s t-test, t(36) = 2.039, p = 0.0489. (G–I) a.p. threshold, resting membrane potential (RMP) and membrane resistance for vHPC neurons. Unpaired two-tailed Student’s t-test, t(16) = 2.16, p = 0.0463. Scale bar, 10 pA, 1 s. (J) The time spent in the center of the OFT. Two-way ANOVA/LSD post hoc test. F(1,32) = 0.5203, p = 0.4760. CRS + CON vs. CRS + shRNA, t = 2.705, p = 0.0217. (K) The time spent in the open arms of the elevated plus maze (EPM). Two-way ANOVA/LSD post hoc test. F(1,32) = 1.243, p = 0.2732. CRS + CON vs. CRS + shRNA, t = 2.784, p = 0.0179. (L) SI time in the absence or presence of a social target. Two-way ANOVA/LSD post hoc test, F(1,64) = 4.5, p = 0.0063, targetCON + stress vs. targetCON + stress, t = 3.547, p = 0.0044. (M) The ratio in the SI test. Two-way ANOVA/LSD post hoc test. F(1,32) = 5.142, p = 0.0302. CRS + CON vs. CRS + shRNA, t = 3.04, p = 0.0094. The data are presented as the mean ± SEM, N.S.: not significant, *p < 0.05, **p < 0.01, ***p < 0.001. The numbers of mice are shown in parentheses.

Similar articles

Cited by

References

    1. Allsop S. A., Vander Weele C. M., Wichmann R., Tye K. M. (2014). Optogenetic insights on the relationship between anxiety-related behaviors and social deficits. Front. Behav. Neurosci. 8:241. 10.3389/fnbeh.2014.00241 - DOI - PMC - PubMed
    1. Bannerman D. M., Grubb M., Deacon R. M., Yee B. K., Feldon J., Rawlins J. N. (2003). Ventral hippocampal lesions affect anxiety but not spatial learning. Behav. Brain Res. 139, 197–213. 10.1016/s0166-4328(02)00268-1 - DOI - PubMed
    1. Bannerman D. M., Yee B. K., Good M. A., Heupel M. J., Iversen S. D., Rawlins J. N. P. (1999). Double dissociation of function within the hippocampus: a comparison of dorsal, ventral, and complete hippocampal cytotoxic lesions. Behav. Neurosci. 113, 1170–1188. 10.1037/0735-7044.113.6.1170 - DOI - PubMed
    1. Bartko S. J., Winters B. D., Saksida L. M., Bussey T. J. (2014). Different roles for M1 and M2 receptors within perirhinal cortex in object recognition and discrimination. Neurobiol. Learn. Mem. 110, 16–26. 10.1016/j.nlm.2014.01.002 - DOI - PubMed
    1. Bluett E. J., Homan K. J., Morrison K. L., Levin M. E., Twohig M. P. (2014). Acceptance and commitment therapy for anxiety and OCD spectrum disorders: an empirical review. J. Anxiety Disord. 28, 612–624. 10.1016/j.janxdis.2014.06.008 - DOI - PubMed

LinkOut - more resources