. 2020 Dec 15:14:590577.
doi: 10.3389/fncel.2020.590577. eCollection 2020.

Sevoflurane-Induced Neuroapoptosis in Rat Dentate Gyrus Is Activated by Autophagy Through NF-κB Signaling on the Late-Stage Progenitor Granule Cells

Affiliations

Sevoflurane-Induced Neuroapoptosis in Rat Dentate Gyrus Is Activated by Autophagy Through NF-κB Signaling on the Late-Stage Progenitor Granule Cells

Dongyi Tong et al. Front Cell Neurosci. .

Abstract

Objective: The mechanisms by which exposure of the late-stage progenitor cells to the anesthesia sevoflurane alters their differentiation are not known. We seek to query whether the effects of sevoflurane on late-stage progenitor cells might be regulated by apoptosis and/or autophagy.

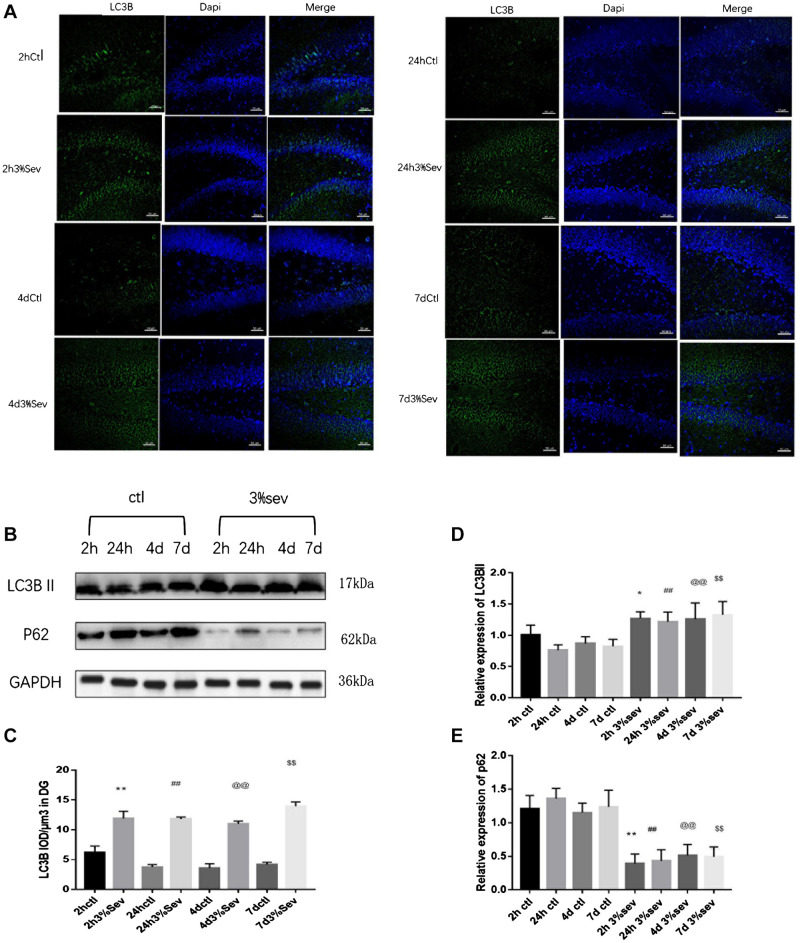
Methods: To address the short-term impact of sevoflurane exposure on granule cell differentiation, we used 5-bromo-2-deoxyuridine (BrdU) to identify the labeled late-stage progenitor granule cells. Male or female rats were exposed to 3% sevoflurane for 4 h when the labeled granule cells were 2 weeks old. Differentiation of the BrdU-labeled granule cells was quantified 4 and 7 days after exposure by double immunofluorescence. The expression of apoptosis and autophagy in hippocampal dentate gyrus (DG) was determined by western blot and immunofluorescence. Western blot for the expression of NF-κB was used to evaluate the mechanism. Morris water maze (MWM) test was performed to detect cognitive function in the rats on postnatal 28-33 days.

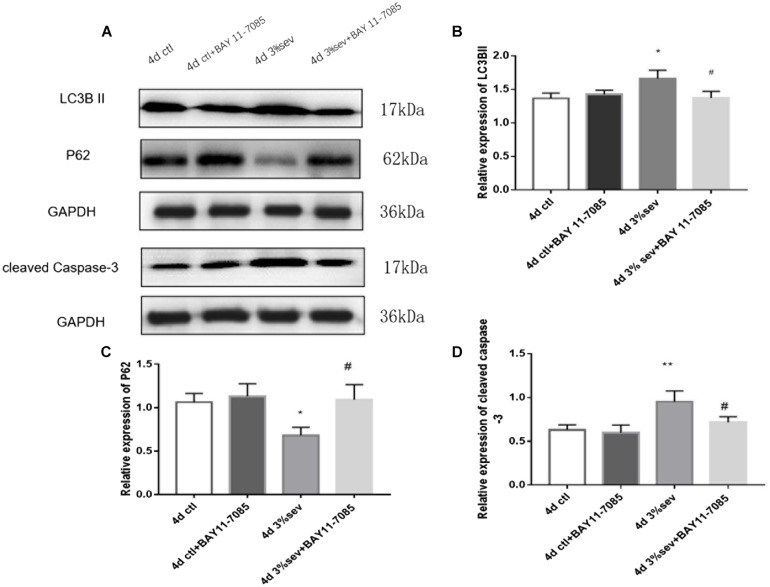
Results: Exposure to sevoflurane decreased the differentiation of the BrdU-labeled late-stage progenitor granule cells, but increased the expression of caspase-3, autophagy, and phosphorylated-P65 in the hippocampus of juvenile rats and resulted in cognitive deficiency. These damaging effects of sevoflurane could be mitigated by inhibitors of autophagy, apoptosis, and NF-κB. The increased apoptosis could be alleviated by pretreatment with the autophagy inhibitor 3-MA, and the increased autophagy and apoptosis could be reduced by pretreatment with NF-κB inhibitor BAY 11-7085.

Conclusion: These findings suggest that a single, prolonged sevoflurane exposure could impair the differentiation of late-stage progenitor granule cells in hippocampal DG and cause cognitive deficits possibly via apoptosis activated by autophagy through NF-κB signaling. Our results do not preclude the possibility that the affected differentiation and functional deficits may be caused by depletion of the progenitors pool.

Keywords: NF-κB; apoptosis; autophagy; dentate gyrus; differentiation; sevoflurane.


Conflict of interest statement

The authors declare that the research was conducted in the absence of any commercial or financial relationships that could be construed as a potential conflict of interest.

Figures

FIGURE 1
FIGURE 1
Sevoflurane exposure decreased the differentiation into DCX in BrdU+ immature cells 4 and 7 days after anesthesia. (A) BrdU (red) co-localization with DCX (green) presented the late progenitor cells differentiating into immature cells in the 4 and 7 days in sevoflurane and control groups. Scale bar = 100 μm. (B) Quantification percentage of BrdU+/DCX+ in BrdU+ immature cells. Values are presented as mean ± SD, n = 3; **P < 0.01 compared with the control 4 days group, ##P < 0.01 compared with the control 7 days group. One-way ANOVA with Newman–Keuls post hoc test or Kruskal–Wallis with Dunn’s Multiple comparison test was used for data analysis.
FIGURE 2
FIGURE 2
Sevoflurane exposure deregulated differentiation into neuron in BrdU+ mature cells 4 and 7 days after anesthesia. (A) BrdU (red) co-localization with NeuN (green) presented the late progenitor cells differentiating into mature cells in the 4 and 7 days in sevoflurane and control groups. Scale bar = 100 μm. (B) Quantification percentage of BrdU+/NeuN+ in BrdU+ mature cells. Values are presented as mean ± SD, n = 3; **P < 0.01 compared with the control 4 days group, ##P < 0.01 compared with the control 7 days group. One-way ANOVA with Newman–Keuls post hoc test or Kruskal–Wallis with Dunn’s Multiple comparison test was used for data analysis.
FIGURE 3
FIGURE 3
(A) Sevoflurane increased TUNEL expression in DG region 2 h, 24 h, 4 days, and 7 days after anesthesia. Scale bar = 50 μm. (B) BrdU (red) co-localization with caspase-3 (green) presented the apoptotic late progenitor cells 2 h, 24 h, 4 days, and 7 days in sevoflurane and control groups. Scale bar = 100 μm. (C) Sevoflurane increased cleaved caspase-3 expression in DG region 2 h, 24 h, 4 days, and 7 days after anesthesia. (D) Quantification of TUNEL positive cells/μm3 in DG region. (E) Quantification percentage of BrdU+/caspase-3+ in BrdU+ cells. (F) Quantification of cleaved caspase-3. n = 3. Values are presented as mean ± SD; **P < 0.01 compared with the 2-h control group, ##P < 0.01 compared with the 24-h control group, @P < 0.05 compared with the 4 days control group, @@P < 0.01 compared with the 4 days control group, $P < 0.05 compared with the 7 days control group, $$P < 0.01 compared with the 7 days control group.
FIGURE 4
FIGURE 4
(A) Caspase-3 inhibitor alleviated sevoflurane-induced decrease of differentiation into DCX in BrdU+ immature cells 4 days after anesthesia. (C) Caspase-3 inhibitor alleviated sevoflurane-induced decrease of differentiation into NeuN in BrdU+ mature cells 4 days after anesthesia. Scale bar = 100 μm. (B) Quantification percentage of BrdU+/DCX+ in BrdU+ immature cells. (D) Quantification percentage of BrdU+/NeuN+ in BrdU+ mature cells. Values are presented as mean ± SD, n = 3; *P < 0.05 compared with the control 4 days group, **P < 0.01 compared with the control 4 days group, #P < 0.05 compared with the 4 days sevoflurane group. One-way ANOVA with Newman–Keuls post hoc test or Kruskal–Wallis with Dunn’s Multiple comparison test was used for data analysis.
FIGURE 5
FIGURE 5
(A) Sevoflurane increased LC3B expression in DG region 2 h, 24 h, 4 days, and 7 days after anesthesia. Scale bar = 50 μm. (B) Sevoflurane upregulated LC3BII and decreased P62 expression in DG region 2 h, 24 h, 4 days, and 7 days after anesthesia. (C) Quantification analysis of the fluorescence intensity of LC3B/μm3 in the DG. n = 3. (D) Quantification of LC3BII. (E) Quantification of P62. n = 3. Values are presented as mean ± SD; *P < 0.05 compared with the 2-h control group, **P < 0.01 compared with the 2-h control group, ##P < 0.01 compared with the 24-h control group, @@P < 0.01 compared with the 4 days control group, $$P < 0.01 compared with the 7 days control group. One-way ANOVA with Newman–Keuls post hoc test or Kruskal–Wallis with Dunn’s Multiple comparison test was used for data analysis.
FIGURE 6
FIGURE 6
(A) LC3B inhibitor alleviated sevoflurane-induced decrease of differentiation into DCX in BrdU+ immature cells 4 days after anesthesia. (C) LC3B inhibitor alleviated sevoflurane-induced decrease of differentiation into NeuN in BrdU+ mature cells 4 days after anesthesia. (B) Quantification percentage of BrdU+/DCX+ in BrdU+ immature cells. (D) Quantification percentage of BrdU+/NeuN+ in BrdU+ mature cells. Values are presented as mean ± SD, n = 3; *P < 0.05 compared with the control 4 days group,**P < 0.01 compared with the control 4 days group, #P < 0.05 compared with the 4 days sevoflurane group. One-way ANOVA with Newman–Keuls post hoc test or Kruskal–Wallis with Dunn’s multiple comparison test was used for data analysis.
FIGURE 7
FIGURE 7
(A) LC3B inhibitor alleviated sevoflurane-induced cleaved caspase-3 expression in DG region 4 days after anesthesia. (B) Caspase-3 inhibitor did not affect sevoflurane-induced LC3BII expression in DG region 4 days after anesthesia. (C) Quantification of LC3BII. (D) Quantification of P62. (E) Quantification of cleaved caspase-3. n = 3. Values are presented as mean ± SD; **P < 0.01 compared with the control 4 days group, ##P < 0.01 compared with the 4 days sevoflurane group. One-way ANOVA with Newman–Keuls post hoc test or Kruskal–Wallis with Dunn’s multiple comparison test was used for data analysis.
FIGURE 8
FIGURE 8
(A) Sevoflurane upregulated both P65 and P-P65 expression in DG region 2 h, 24 h, and 4 days after anesthesia, but only P-P65 expression 7 days after anesthesia. In contrast, sevoflurane decreased IκB expression in DG 2 h, 24 h, 4 days, and 7 days after anesthesia. (B) Quantification of P65. (C) Quantification of P-P65. (D) Quantification of IκB. n = 3. Values are presented as mean ± SD, n = 3; *P < 0.05 compared with 2 h control group, **P < 0.01 compared with 2 h control group, ##P < 0.01 compared with 24 h control group, @P < 0.05 compared with 4 days control group, @@P < 0.01 compared with 4 days control group, $P < 0.05 compared with 7 days control group, $$P < 0.01 compared with 7 days control group. One-way ANOVA with Newman–Keuls post hoc test or Kruskal–Wallis with Dunn’s Multiple comparison test was used for data analysis.
FIGURE 9
FIGURE 9
(A) NF-κB inhibitor alleviated sevoflurane-induced decrease of differentiation into DCX in BrdU+ immature cells 4 days after anesthesia. (B) NF-κB inhibitor alleviated sevoflurane-induced decrease of differentiation into NeuN in BrdU+ mature cells 4 days after anesthesia. Scale bar = 100 μm. (C) Quantification (percentage) of BrdU+/DCX+ in BrdU+ immature cells. (D) Quantification (percentage) of BrdU+/NeuN+ in BrdU+ mature cells. n = 3. Values are presented as mean ± SD; *P < 0.05 compared with 4 days control group, **P < 0.01 compared with the 4 days control group, #P < 0.05 compared with 4 days sevoflurane group.
FIGURE 10
FIGURE 10
(A) NF-κB inhibitor alleviated sevoflurane-induced LC3BII and cleaved caspase-3, and increased P62 expressions in DG region 4 days after anesthesia. (B) Quantification of LC3BII. (C) Quantification of P62. (D) Quantification of cleaved caspase-3. n = 3. Values are presented as mean ± SD; *P < 0.05 compared with 4 days control group, **P < 0.01 compared with 4 days control group, #P < 0.05 compared with 4 days sevoflurane group.
FIGURE 11
FIGURE 11
Sevoflurane reduced short-term cognitive deficiency via NF-κB/P65/autophagy/apoptosis regulation. (A) Escape latency in place trials evaluated the acquisition of spatial information. (B) Platform crossing times in probe test evaluated the memory retention ability. (C) Representative traces and graphical search patterns during MWM tests. Values are presented as mean ± SD; two-way repeated ANOVA followed by Dunnett’s multiple comparisons tests was used for escape latency. **P < 0.01 compared with the control group, #P < 0.05 compared with sevoflurane group, ##P < 0.01 compared with sevoflurane group.

Similar articles

Cited by

References

    1. Abhari B. A., McCarthy N., Agostinis P., Fulda S. (2019). NF-κB contributes to Smac mimetic-conferred protection from tunicamycin-induced apoptosis. Apoptosis 24 269–277. 10.1007/s10495-018-1507-2 - DOI - PubMed
    1. Benito-Cuesta I., Diez H., Ordonez L., Wandosell F. (2017). Assessment of autophagy in neurons and brain tissue. Cells 6:25. 10.3390/cells6030025 - DOI - PMC - PubMed
    1. Biebl M., Winner B., Winkler J. (2005). Caspase inhibition decreases cell death in regions of adult neurogenesis. Neuroreport 16 1147–1150. 10.1097/00001756-200508010-00003 - DOI - PubMed
    1. Cahill S. P., Yu R. Q., Green D., Todorova E. V., Snyder J. S. (2017). Early survival and delayed death of developmentally-born dentate gyrus neurons. Hippocampus 27 1155–1167. 10.1002/hipo.22760 - DOI - PubMed
    1. Danzer S. C. (2019). Adult neurogenesis in the development of epilepsy. Epilepsy Curr. 19 316–320. 10.1177/1535759719868186 - DOI - PMC - PubMed