. 2020 Dec 15:11:595815.
doi: 10.3389/fphys.2020.595815. eCollection 2020.

Heart Rate Dependency and Inter-Lead Variability of the T Peak - T End Intervals

Affiliations

Heart Rate Dependency and Inter-Lead Variability of the T Peak - T End Intervals

Irena Andršová et al. Front Physiol. .

Abstract

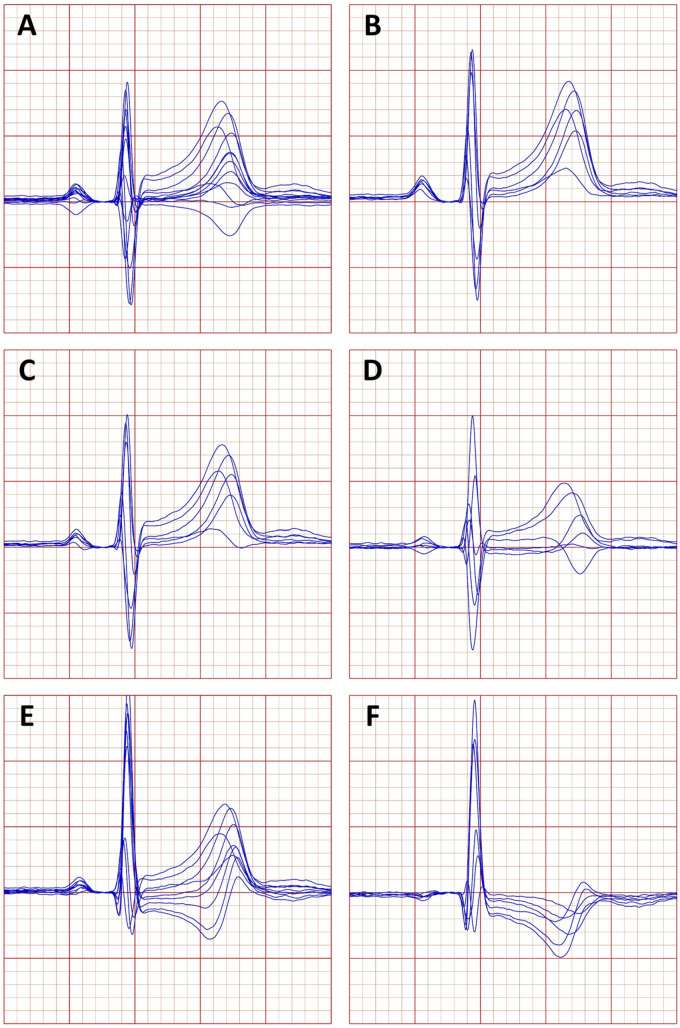
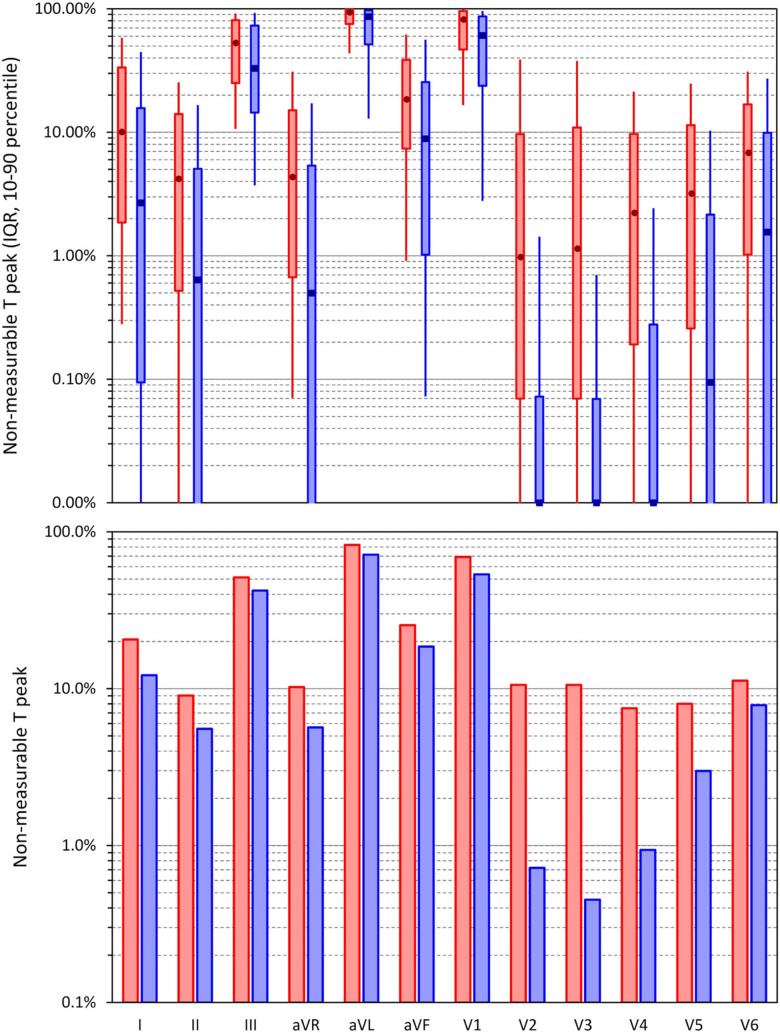
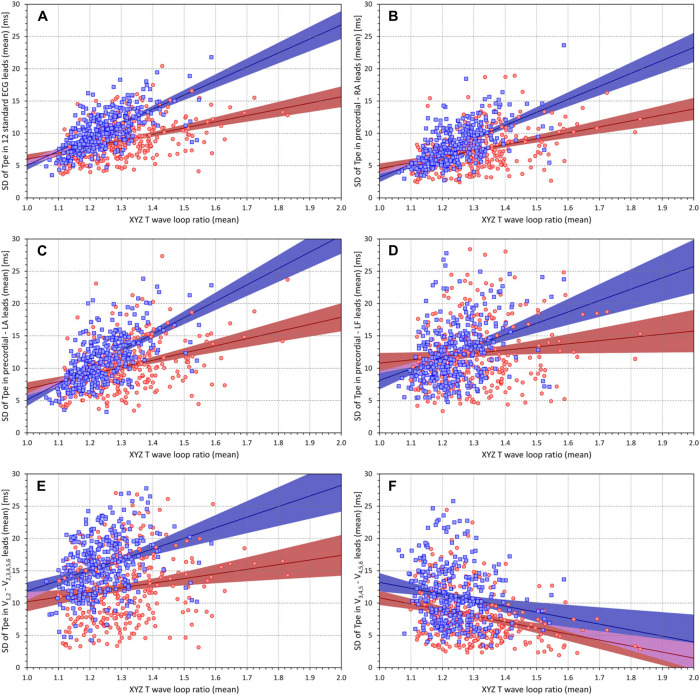
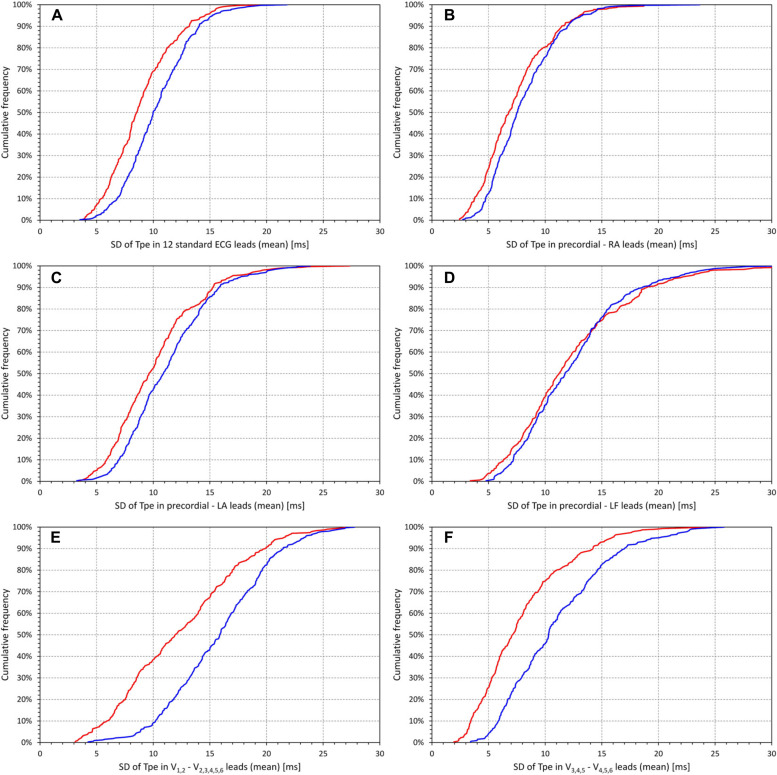
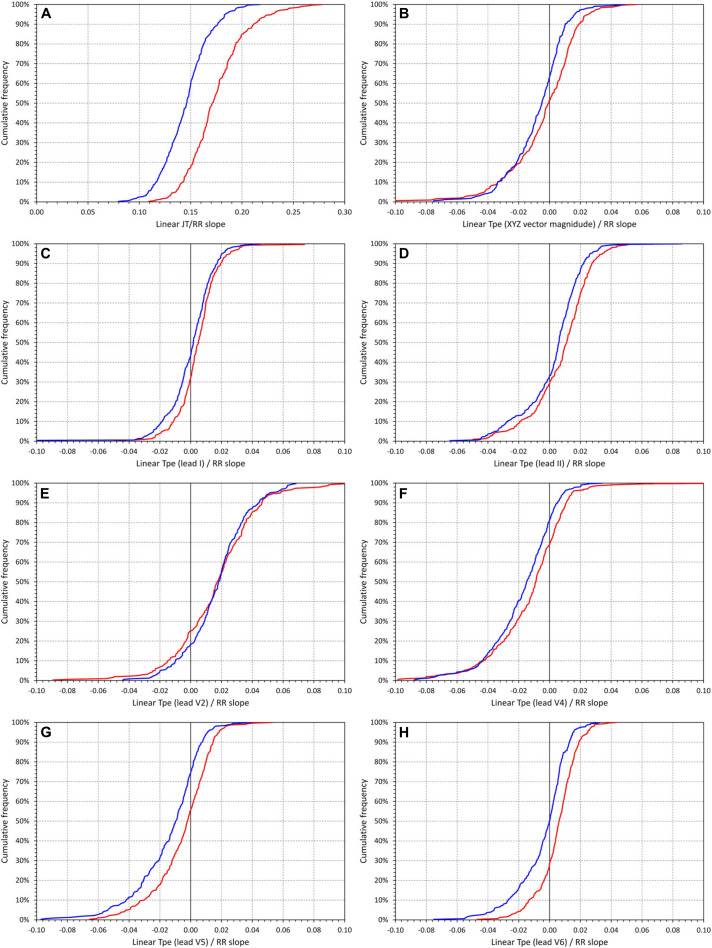
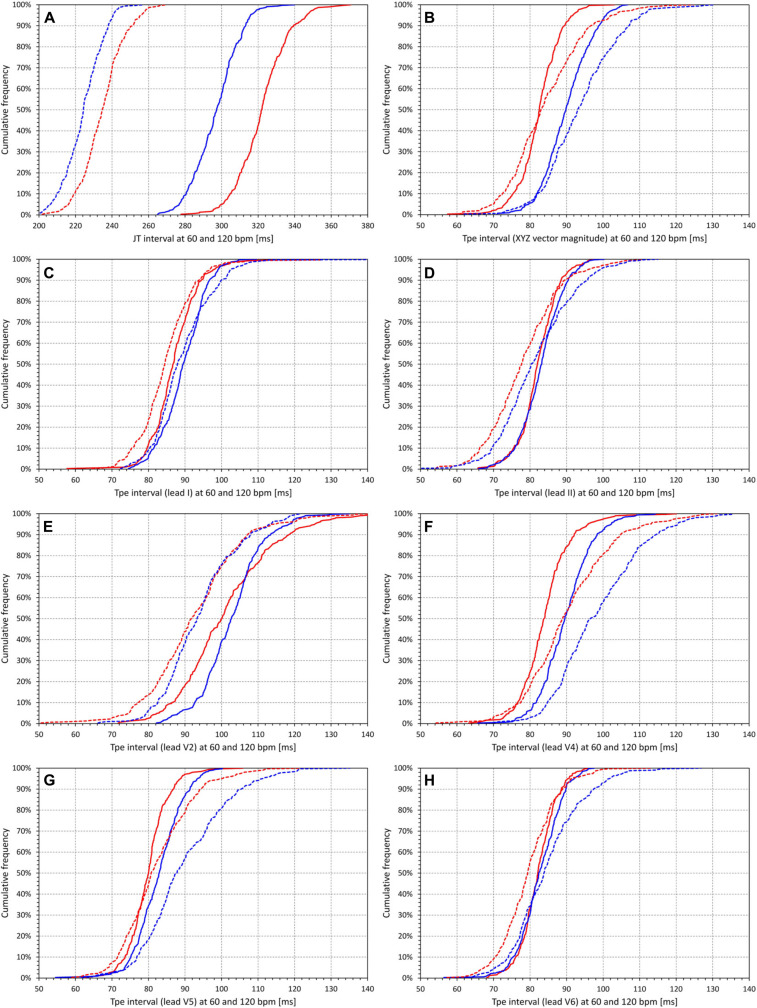
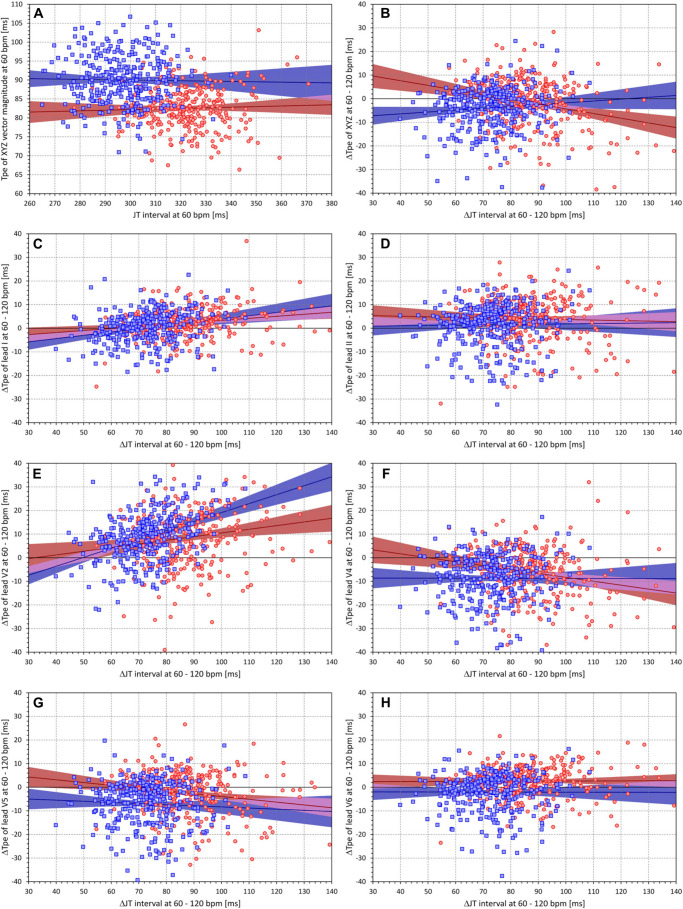
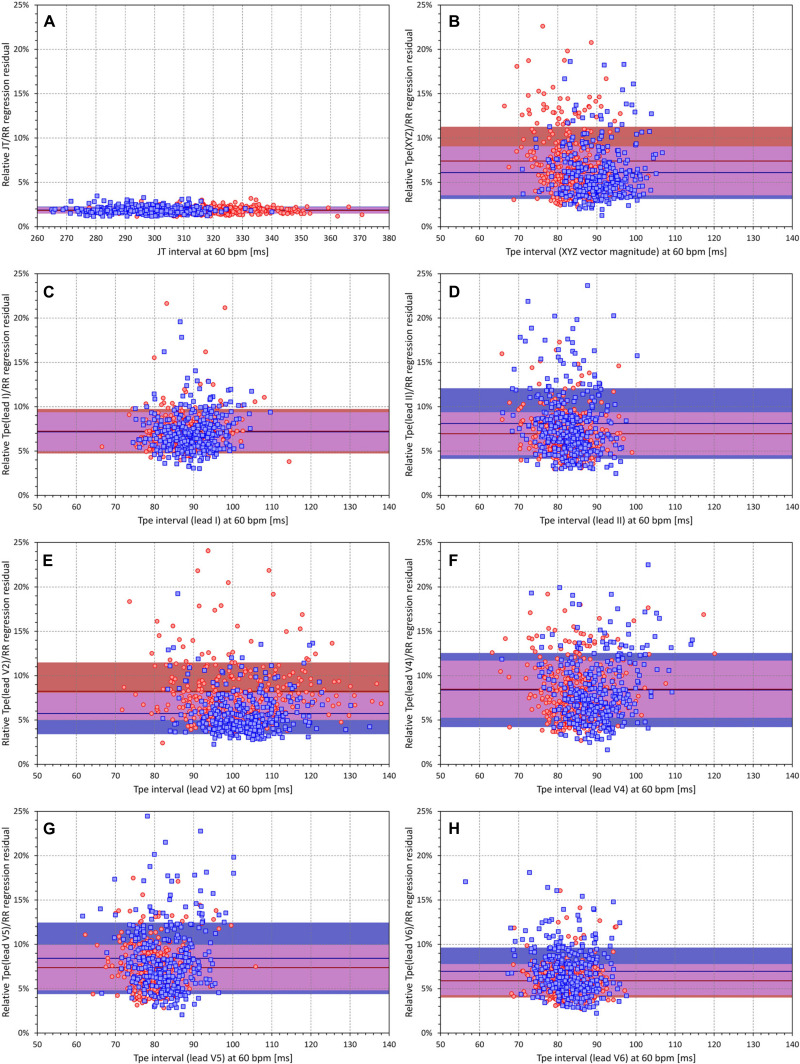
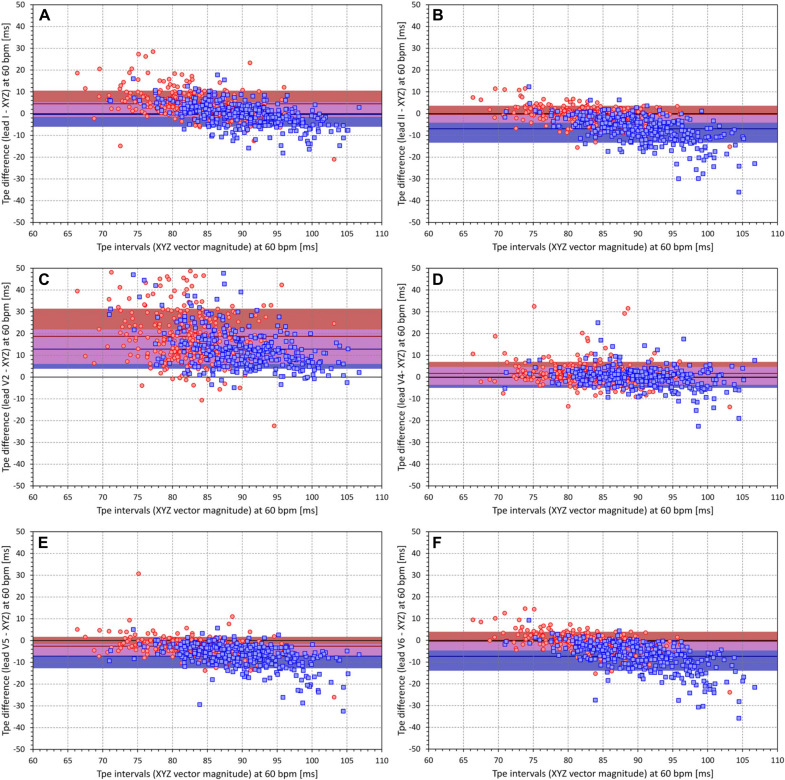
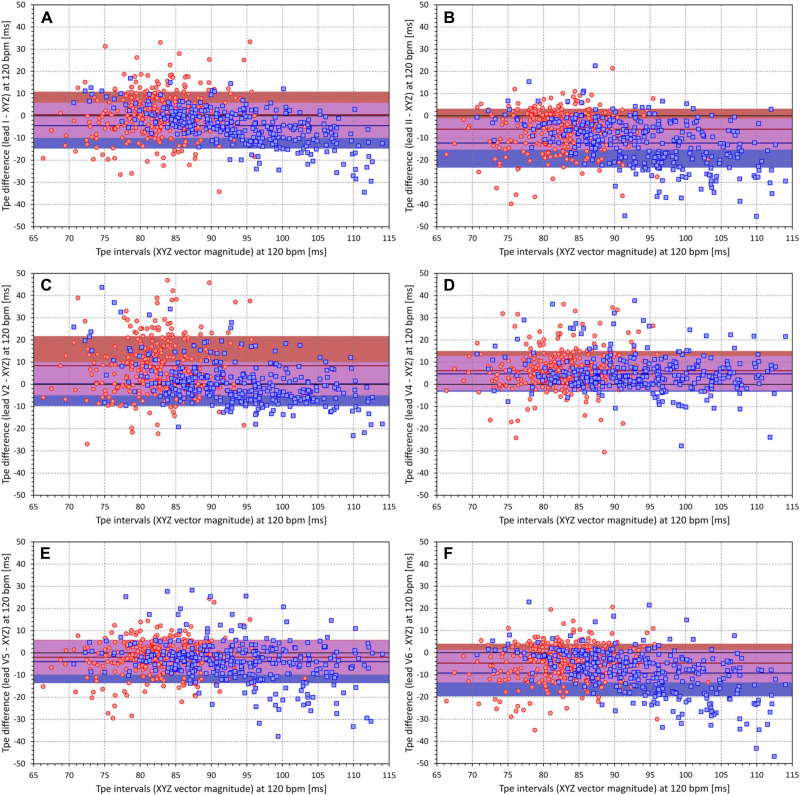
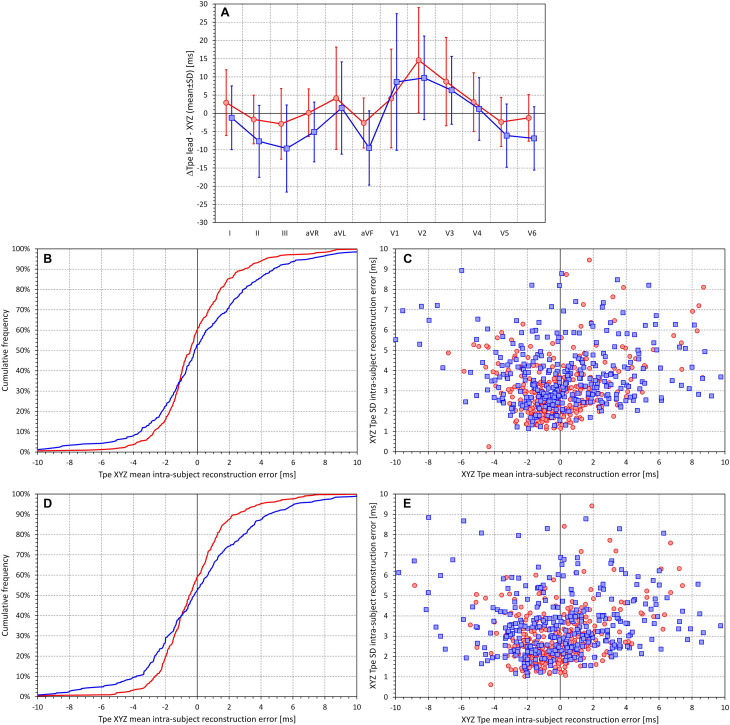
The electrocardiographic (ECG) assessment of the T peak-T end (Tpe) intervals has been used in many clinical studies, but several related physiological aspects have not been reported. Specifically, the sources of the Tpe differences between different ECG leads have not been systematically researched, the relationship of Tpe duration to underlying heart rate has not been firmly established, and little is known about the mutual correspondence of Tpe intervals measured in different ECG leads. This study evaluated 796,620 10-s 12-lead ECGs obtained from long-term Holters recorded in 639 healthy subjects (311 female) aged 33.8 ± 9.4 years. For each ECG, transformation to orthogonal XYZ lead was used to measure Tpe in the orthogonal vector magnitude (used as a reference for lead-to-lead comparisons) and to construct a three-dimensional T wave loop. The loop roundness was expressed by a ratio between its circumference and length. These ratios were significantly related to the standard deviation of Tpe durations in different ECG leads. At the underlying heart rate of 60 beats per minute, Tpe intervals were shorter in female than in male individuals (82.5 ± 5.6 vs 90.0 ± 6.5 ms, p < 0.0001). When studying linear slopes between Tpe intervals measured in different leads and the underlying heart rate, we found only minimal heart rate dependency, which was not systematic across the ECG leads and/or across the population. For any ECG lead, positive Tpe/RR slope was found in some subjects (e.g., 79 and 25% of subjects for V2 and V4 measurements, respectively) and a negative Tpe/RR slope in other subjects (e.g., 40 and 65% for V6 and V5, respectively). The steepest positive and negative Tpe/RR slopes were found for measurements in lead V2 and V4, respectively. In all leads, the Tpe/RR slope values were close to zero, indicating, on average, Tpe changes well below 2 ms for RR interval changes of 100 ms. On average, longest Tpe intervals were measured in lead V2, the shortest in lead III. The study concludes that the Tpe intervals measured in different leads cannot be combined. Irrespective of the measured ECG lead, the Tpe interval is not systematically heart rate dependent, and no heart rate correction should be used in clinical Tpe investigations.

Keywords: ECG lead comparison; T wave peak; T wave spatial loop; heart rate dependency; sex differences.


Conflict of interest statement

The authors declare that the research was conducted in the absence of any commercial or financial relationships that could be construed as a potential conflict of interest.

Figures

FIGURE 1
FIGURE 1
Example of a representative beatform of an electrocardiogram (ECG) obtained in a 33-year-old male. (A) Standard leads of the 12 lead ECG, (B) the bipolar leads between the precordial electrodes and the right arm electrode, (C) the bipolar leads between the precordial electrodes and the left arm electrode, (D) the bipolar leads between the precordial electrodes and the left foot electrode, (E) the “wide” precordial dipoles, and (F) the “narrow” precordial electrodes (see the text for explanation of the precordial dipoles).
FIGURE 2
FIGURE 2
Incidence of non-measurable peaks of the T wave in standard electrocardiogram (ECG) leads. The bottom panel shows the incidence among all ECG segments investigated in the study pooled together; the top panel shows the summary of the incidence in individual study subjects—the bars show the interquartile ranges, and the error bars the spreads between the 10th and 90th percentiles of the population. The dark marks in the middle of the bars are the population medians. In both panels, the displays in red and blue show the data in female and male subjects, respectively. Note the logarithmic vertical axes (in the top panel, there were only 0 display values below 0.01%).
FIGURE 3
FIGURE 3
Scatter diagrams between the T wave loop ratios (mean values in individual subjects) and the standard deviations of the Tpe intervals in groups of electrocardiogram (ECG) leads (mean values in individual subjects). Different panels of the figure correspond to different groups of ECG leads–the association of the panels with the lead groups is the same as in Figure 1. In each panel [please see the labels of vertical axes for the explanation of panels (A–F)], the red circles and blue squares correspond to female and male subjects, respectively. The solid red and solid blue lines show the linear regressions between the measured standard deviations of Tpe intervals and the T wave loop ratios in female and male subjects, respectively. The red- and blue-shaded areas are the 95% confidence intervals of the regression lines; the violet areas are the overlaps between the confidence intervals of the sex-specific regressions. SD, standard deviation; RA, right arm; LA, left arm; LF, left foot.
FIGURE 4
FIGURE 4
Cumulative distributions of the standard deviations of the Tpe intervals in groups of electrocardiogram (ECG) leads (mean values in individual subjects). Different panels of the figure correspond to different groups of ECG leads–the association of the panels with the lead groups is the same as in Figure 1. In each panel [please see the labels of horizontal axes for the explanation of panels (A–F)], the red and blue lines correspond to the distributions in female and male subjects, respectively. SD, standard deviation; RA, right arm; LA, left arm; LF, left foot.
FIGURE 5
FIGURE 5
Cumulative distributions of the intrasubject slopes of linear regressions between underlying hysteresis corrected heart rate and JT intervals (A) and Tpe intervals measured in different electrocardiogram (ECG) leads [(B) orthogonal XYZ vector magnitude, (C) lead I, (D) lead II, (E) lead V2, (F) lead V4, (G) lead V5, and (H) lead V6]. In each panel, the red and blue lines correspond to the distributions in female and male subjects, respectively. Note that while in (A), the horizontal axis ranges between 0 and 0.30, the horizontal axes in all other panels range between –0.10 and +0.10.
FIGURE 6
FIGURE 6
Cumulative distributions of intrasubject regression projections of the (A) JT intervals and (B–H) Tpe intervals corresponding to heart rate of 60 beats per minute (bpm) (solid lines) and to heart rate of 120 bpm (dashed lines). (B–H) correspond to different electrocardiogram (ECG) leads in the same way as the panels of Figure 5. In each panel, the red and blue lines correspond to the distributions in female and male subjects, respectively. Note that while in (A), the horizontal axis ranges between 200 and 380 ms, the horizontal axes in all other panels range between 50 and 140 ms.
FIGURE 7
FIGURE 7
(A) Scatter diagram between the subject-specific projections of JT intervals and Tpe intervals (measurement in the XYZ vector magnitude) to the heart rate of 60 bpm. (B–H) Scatter diagrams between subject-specific JT interval changes from 60 to 120 bpm and Tpe interval changes from 60 to 120 bpm; the panels correspond to the Tpe measurement in different electrocardiogram (ECG) leads in the same way as the panels of Figure 5. In each panel, the red circles and blue squares correspond to female and male subjects, respectively. The solid red and solid blue lines show the linear regressions between the displayed values in female and male subjects, respectively. The red- and blue-shaded areas are the 95% confidence intervals of the regression lines; the violet areas are the overlaps between the confidence intervals of the sex-specific regressions.
FIGURE 8
FIGURE 8
(A) Scatter diagram between JT intervals at heart rate of 60 bpm and relative linear JT/RR regression residuals (see the text for explanation). (B–H) Similar scatter diagrams between Tpe intervals at heart rate of 60 bpm and relative linear Tpe/RR regression residuals; the panels correspond to the Tpe measurement in different electrocardiogram (ECG) leads in the same way as the panels of Figure 5. In each panel, the red circles and blue squares correspond to female and male subjects, respectively. The solid red and solid blue horizontal lines show the means of the relative regression residuals in female and male subjects, respectively. The red- and blue-shaded areas are the bands of mean ± standard deviation of the relative regression residuals in female and male subjects, respectively. The violet areas are the overlaps between the ±standard deviation bands of both sexes.
FIGURE 9
FIGURE 9
All panels show scatter diagrams between the individual Tpe intervals measured in the XYZ vector magnitude and the corresponding differences between the Tpe intervals measured in different electrocardiogram (ECG) leads and the Tpe intervals measured in XYZ vector magnitude. All the panels show the Tpe values (and their differences) regression projected to the heart rate of 60 bpm. The different panels correspond to the comparison of Tpe measurements made in different ECG leads [(A) lead I, (B) lead II, (C) lead V2, (D) lead V4, (E) lead V5, (F) lead V6]. In each panel, the red circles and blue squares correspond to female and male subjects, respectively. The solid red and solid blue horizontal lines show the means of the Tpe differences in female and male subjects, respectively. The red- and blue shaded areas are the bands of mean ± standard deviation of the Tpe differences in female and male subjects, respectively. The violet areas are the overlaps between the ±standard deviation bands of both sexes.
FIGURE 10
FIGURE 10
All panels have the same meaning as the panels of Figure 9, but instead of Tpe values individually projected to the heart rate of 60 bpm, values projected to the heart rate of 120 bpm are displayed. Please see the legend of Figure 9 and the labels of the axes for the explanation of panels (A–F).
FIGURE 11
FIGURE 11
For different electrocardiogram (ECG) leads, (A) shows the summaries of the differences between the Tpe measurements in the given lead and the Tpe measurements in the XYZ vector magnitude (analysis based on ECGs with complete measurements pooled together—see the text for details). (B,D) Cumulative distributions of the mean intrasubject differences between the Tpe intervals measured in the XYZ vector magnitude and their approximation by the restricted and complete regression models, respectively. (C,E) Scatter diagrams between the means and standard deviations of the intrasubject differences between the Tpe intervals measured in the XYZ vector magnitude and their approximation by the restricted and complete regression models, respectively (see the text for details). In (A), the red and blue graphs correspond to the data in female and male subjects, respectively. In (B,D), the red and blue lines correspond to female and male subjects, respectively. In (C,E), the red circles and blue squares correspond to female and male subjects, respectively.

References

    1. Acar B., Köymen H. (1999). SVD-based on-line exercise ECG signal orthogonalization. IEEE Trans. Biomed. Eng. 46 311–321. 10.1109/10.748984 - DOI - PubMed
    1. Acar B., Yi G., Hnatkova K., Malik M. (1999). Spatial, temporal and wavefront direction characteristics of 12-lead T-wave morphology. Med. Biol. Eng. Comput. 37 574–584. 10.1007/bf02513351 - DOI - PubMed
    1. Antzelevitch C. (2008). Drug-induced spatial dispersion of repolarization. Cardiol. J. 15 100–121. - PMC - PubMed
    1. Antzelevitch C., Di Diego J. M. (2019). Tpeak-Tend interval as a marker of arrhythmic risk. Heart Rhythm. 16 954–955. 10.1016/j.hrthm.2019.01.017 - DOI - PMC - PubMed
    1. Batchvarov V., Hnatkova K., Malik M. (2002). Assessment of noise in digital electrocardiograms. Pacing Clin. Electrophysiol. 25 499–503. 10.1046/j.1460-9592.2002.00499.x - DOI - PubMed

LinkOut - more resources