. 2020 Dec 15:11:618879.
doi: 10.3389/fneur.2020.618879. eCollection 2020.

Optical Coherence Tomography and Optical Coherence Tomography Angiography Findings After Optic Neuritis in Multiple Sclerosis

Affiliations

Optical Coherence Tomography and Optical Coherence Tomography Angiography Findings After Optic Neuritis in Multiple Sclerosis

Olwen C Murphy et al. Front Neurol. .

Abstract

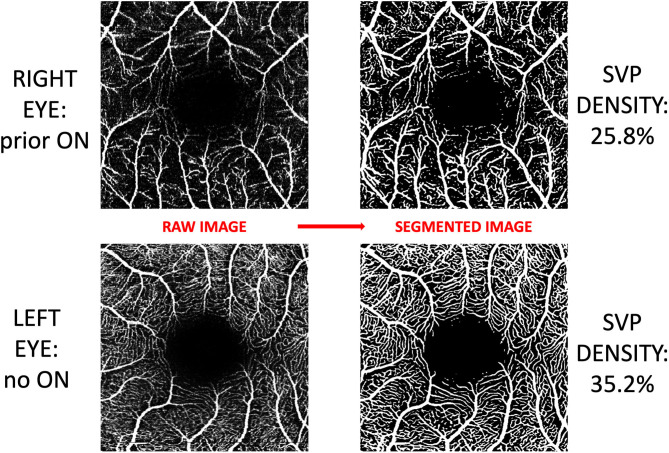
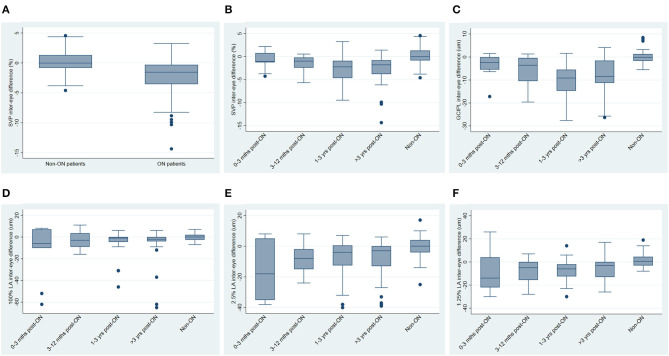
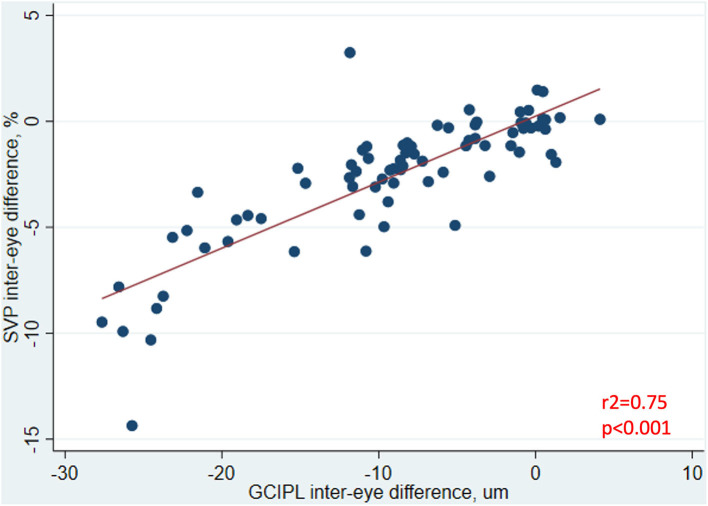
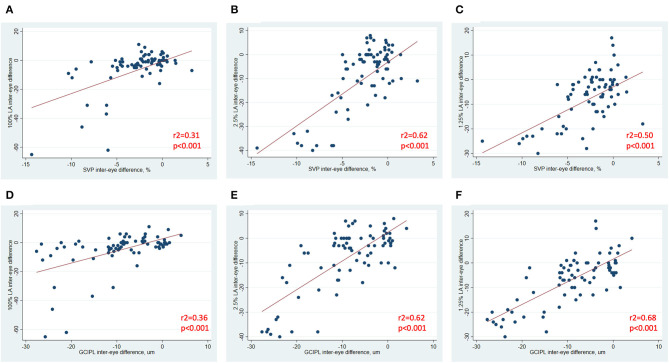
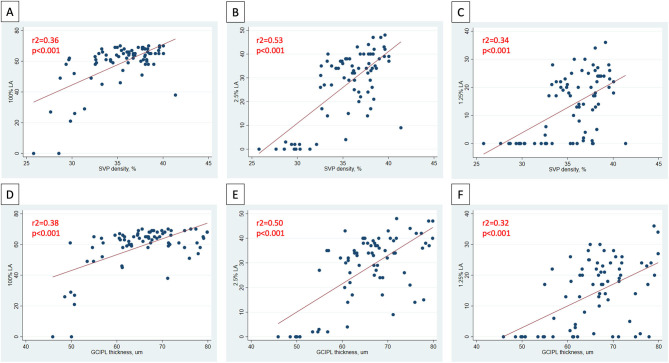
Background: In people with multiple sclerosis (MS), optic neuritis (ON) results in inner retinal layer thinning, and reduced density of the retinal microvasculature. Objective: To compare inter-eye differences (IEDs) in macular optical coherence tomography (OCT) and OCT angiography (OCTA) measures in MS patients with a history of unilateral ON (MS ON) vs. MS patients with no history of ON (MS non-ON), and to assess how these measures correlate with visual function outcomes after ON. Methods: In this cross-sectional study, people with MS underwent OCT and OCTA. Superficial vascular plexus (SVP) density of each eye was quantified using a deep neural network. IEDs were calculated with respect to the ON eye in MS ON patients, and with respect to the right eye in MS non-ON patients. Statistical analyses used mixed-effect regression models accounting for intra-subject correlations. Results: We included 43 MS ON patients (with 92 discrete OCT/OCTA visits) and 14 MS non-ON patients (with 24 OCT/OCTA visits). Across the cohorts, mean IED in SVP density was -2.69% (SD 3.23) in MS ON patients, as compared to 0.17% (SD 2.39) in MS non-ON patients (p = 0.002). When the MS ON patients were further stratified according to time from ON and compared to MS non-ON patients with multiple cross-sectional analyses, we identified that IED in SVP density was significantly increased in MS ON patients at 1-3 years (p = < 0.001) and >3 years post-ON (p < 0.001), but not at <3 months (p = 0.21) or 3-12 months post-ON (p = 0.07), while IED in ganglion cell + inner plexiform layer (GCIPL) thickness was significantly increased in MS ON patients at all time points post-ON (p ≦ 0.01 for all). IED in SVP density and IED in GCIPL thickness demonstrated significant relationships with IEDs in 100% contrast, 2.5% contrast, and 1.25% contrast letter acuity in MS ON patients (p < 0.001 for all). Conclusions: Our findings suggest that increased IED in SVP density can be detected after ON in MS using OCTA, and detectable changes in SVP density after ON may occur after changes in GCIPL thickness. IED in SVP density and IED in GCIPL thickness correlate well with visual function outcomes in MS ON patients.

Keywords: inter-eye asymmetry; multiple sclerosis; optic neuritis; optical coherence tomography; optical coherence tomography angiography; outcomes; retinal vasculature.


Conflict of interest statement

ES has served on a scientific advisory boards for Viela Bio and Genentech and is funded by a Sylvia Lawry physician fellowship award from NMSS. JP is a founder of Sonovex, Inc. and serves on its Board of Directors. He has received consulting fees from JuneBrain LLC and is PI on research grants to Johns Hopkins from 12Sigma Technologies and Biogen. PC has received consulting fees from Disarm and Biogen and is PI on grants to JHU from Biogen and Annexon. SS has received consulting fees from Medical Logix for the development of CME programs in neurology, and has served on scientific advisory boards for Biogen, Genzyme, Genentech Corporation, EMD Serono, and Celgene. He is the PI of investigator-initiated studies funded by Genentech and Biogen, was the site investigator of a trial sponsored by MedDay Pharmaceuticals, and received support from the Race to Erase MS foundation. He has received equity compensation for consulting from JuneBrain LLC, a retinal imaging device developer. The remaining authors declare that the research was conducted in the absence of any commercial or financial relationships that could be construed as a potential conflict of interest.

Figures

Figure 1
Figure 1
Post-acquisition processing and segmentation of OCTA images. Images of the superficial vascular plexus (SVP) were acquired using Spectralis OCTA (Heidelberg Engineering, Germany). A neural network algorithm developed at Johns Hopkins University was trained to exploit the shared vessel structures from repeated scans acquired by two different OCTA devices while suppressing the scan-dependent noises and artifacts. The trained algorithm generates a vessel mask for each scan for computing SVP density. In this figure, OCTA images from both eyes of a patient with a history of optic neuritis are demonstrated. Inter-eye difference in SVP density in this patient was −9.4%.
Figure 2
Figure 2
Inter-eye differences in SVP density, GCIPL thickness and visual function, stratified by history of optic neuritis. (A) Inter-eye differences in SVP density in MS non-ON patients vs. MS ON patients. (B) Inter-eye differences in SVP density in MS ON patients stratified by time from ON, vs. MS non-ON patients. (C) Inter-eye differences in GCIPL thickness in MS ON patients stratified by time from ON, vs. MS non-ON patients. (D–F) Inter-eye differences in 100% contrast letter acuity (D), 2.5% contrast letter acuity (E), and 1.25% contrast letter acuity (F) in MS ON patients stratified by time from ON vs. MS non-ON patients.
Figure 3
Figure 3
Relationship between inter-eye differences in SVP density and GCIPL thickness in MS ON patients. In MS ON patients at least 3 months post-ON (after resolution of the acute phase of ON), the relationship between inter-eye differences in SVP density and GCIPL thickness is shown here. P-value was calculated using mixed-effects linear regression accounting for intra-subject correlations. R2-value was estimated from the mixed-effects model using the Snijders and Bosker method.
Figure 4
Figure 4
Relationships between inter-eye differences in OCT/OCTA and visual function measures in MS ON patients. In MS ON patients at least 3 months post-ON (after resolution of the acute phase of ON), relationships between inter-eye differences in SVP density and 100% contrast LA, 2.5% contrast LA, and 1.25% contrast LA are demonstrated in (A–C). In MS ON patients at least 3 months post-ON, relationships between inter-eye differences in GCIPL thickness and 100% contrast LA, 2.5% contrast LA, and 1.25% contrast LA are demonstrated in (D–F). P-values were calculated using mixed-effects linear regression accounting for intra-subject correlations. R2-values were estimated from the mixed-effects model using the Snijders and Bosker method.
Figure 5
Figure 5
Relationships between OCT/OCTA and visual function measures in individual MS ON eyes. In MS ON eyes at least 3 months post-ON (after resolution of the acute phase of ON), relationships between SVP density and 100% contrast LA, 2.5% contrast LA, and 1.25% contrast LA in the MS ON eye are demonstrated in (A–C). In MS ON eyes at least 3 months post-ON, relationships between GCIPL thickness and 100% contrast LA, 2.5% contrast LA, and 1.25% contrast LA in the MS ON eye are demonstrated in (D–F). P-values were calculated using mixed-effects linear regression accounting for intra-subject correlations. R2-values were estimated from the mixed-effects model using the Snijders and Bosker method.

References

    1. Lambe J, Saidha S, Bermel RA. Optical coherence tomography and multiple sclerosis: update on clinical application and role in clinical trials. Mult Scler. (2020) 26:624–39. 10.1177/1352458519872751 - DOI - PubMed
    1. Lambe J, Murphy O, Saidha S. Can optical coherence tomography be used to guide treatment decisions in adult or pediatric multiple sclerosis? Curr Treat Options Neurol. (2018) 20:9 10.1007/s11940-018-0493-6 - DOI - PubMed
    1. Wang L, Murphy O, Caldito NG, Calabresi PA, Saidha S. Emerging applications of optical coherence tomography angiography (OCTA) in neurological research. Eye Vis. (2018) 5:11. 10.1186/s40662-018-0104-3 - DOI - PMC - PubMed
    1. Dutta R, Trapp BD. Mechanisms of neuronal dysfunction and degeneration in multiple sclerosis. Prog Neurobiol. (2011) 93:1–12. 10.1016/j.pneurobio.2010.09.005 - DOI - PMC - PubMed
    1. Salapa HE, Lee S, Shin Y, Levin MC. Contribution of the degeneration of the neuro-axonal unit to the pathogenesis of multiple sclerosis. Brain Sci. (2017) 7:69. 10.3390/brainsci7060069 - DOI - PMC - PubMed