

Highly Sensitive Flow Cytometric Detection of Residual B-Cells After Rituximab in Anti-Neutrophil Cytoplasmic Antibodies-Associated Vasculitis Patients
- PMID: 33384685
- PMCID: PMC7770159
- DOI: 10.3389/fimmu.2020.566732
Highly Sensitive Flow Cytometric Detection of Residual B-Cells After Rituximab in Anti-Neutrophil Cytoplasmic Antibodies-Associated Vasculitis Patients
Abstract
Background: B-cell depletion with rituximab (RTX) is an effective treatment for anti-neutrophil cytoplasmic antibodies (ANCA)-associated vasculitis (AAV) patients. Nevertheless, relapses are frequent after RTX, often preceded by B-cell repopulation suggesting that residual autoreactive B-cells persist despite therapy. Therefore, this study aimed to identify minimal residual autoimmunity (MRA) in the B-cell compartment of AAV patients treated with RTX.
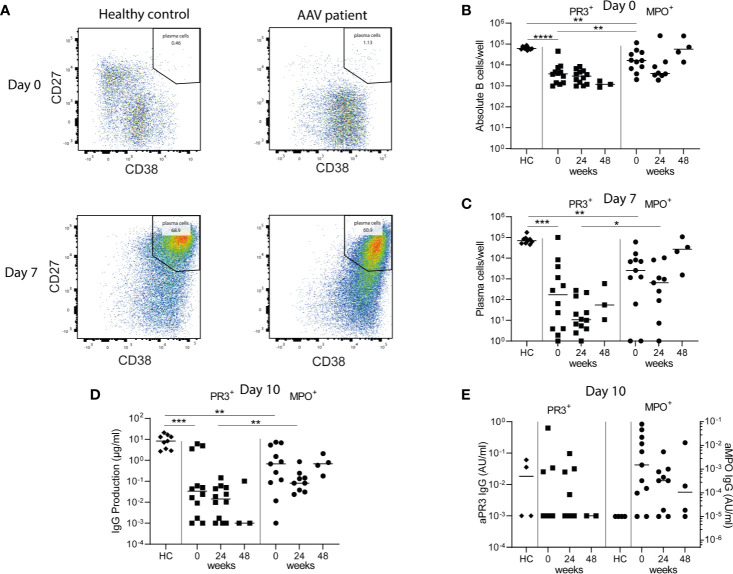
Methods: EuroFlow-based highly-sensitive flow cytometry (HSFC) was employed to study B-cell and plasma cell (PC) subsets in-depth in AAV patients before and after RTX treatment. Additionally, peripheral blood mononuclear cells (PBMCs) of these RTX-treated AAV patients were cultured and in vitro stimulated with CpG, IL-2, and IL-21 to induce antibody-secreting cells (ASC). (ANCA)-IgG was measured in these supernatants by ELISA.
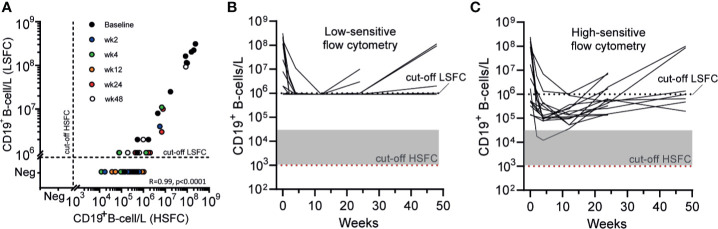
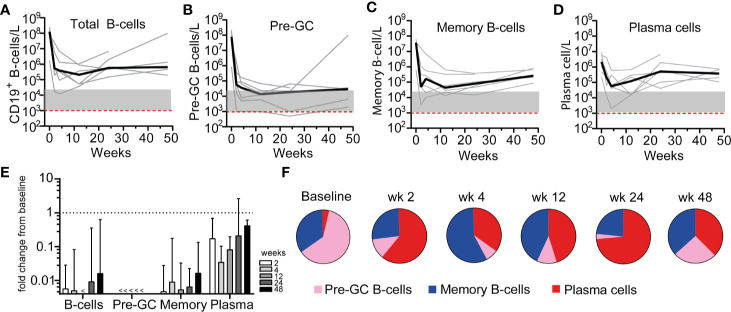
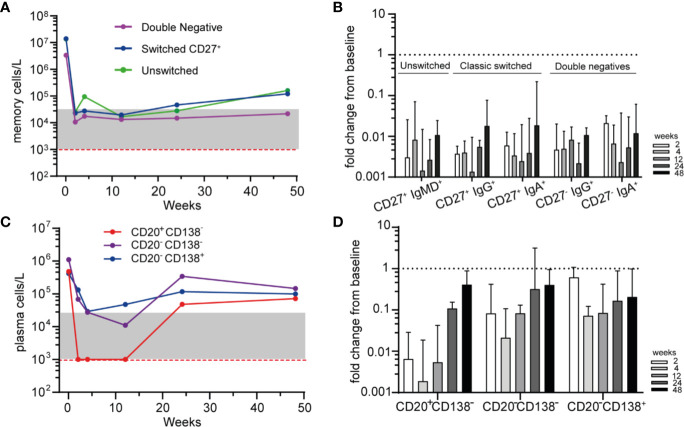
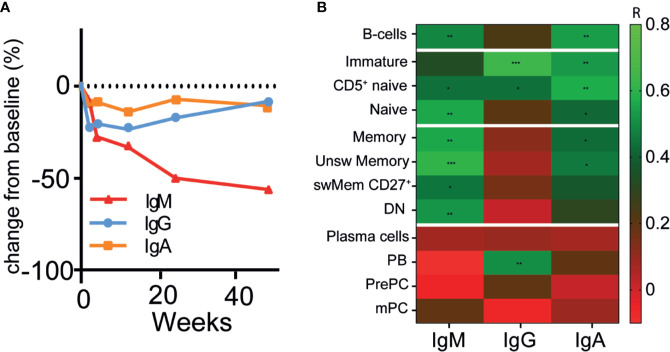
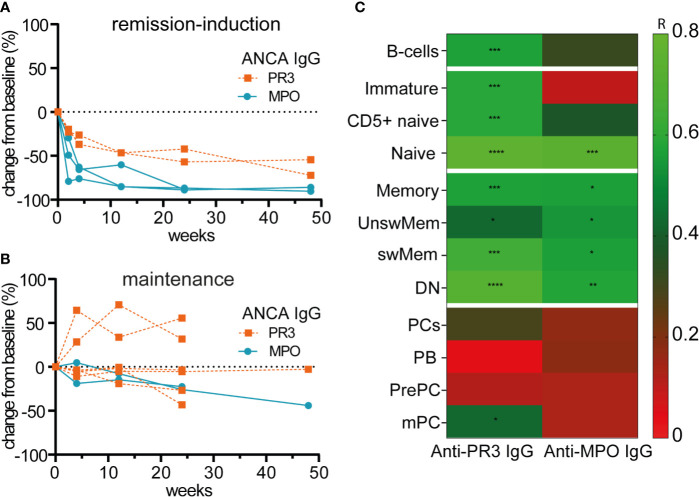
Results: By employing EuroFlow-based HSFC, we detected circulating CD19+ B-cells at all timepoints after RTX treatment, in contrast to conventional low-sensitive flow cytometry. Pre-germinal center (Pre-GC) B-cells, memory B-cells and CD20+CD138- plasmablasts (PBs) were rapidly and strongly reduced, while CD20-CD138- PrePC and CD20-CD138+ mature (m)PCs were reduced slower and remained detectable. Both memory B-cells and CD20- PCs remained detectable after RTX. Serum ANCA-IgG decreased significantly upon RTX. Changes in ANCA levels strongly correlated with changes in naive, switched CD27+ and CD27- (double-negative) memory B-cells, but not with plasma cells. Lastly, we demonstrated in vitro ANCA production by AAV PBMCs, 24 and 48 weeks after RTX treatment reflecting MRA in the memory compartment of AAV patients.
Conclusion: We demonstrated that RTX induced strong reductions in circulating B-cells, but never resulted in complete B-cell depletion. Despite strongly reduced B-cell numbers after RTX, ANCA-specific memory B-cells were still detectable in AAV patients. Thus, MRA is identifiable in AAV and can provide a potential novel approach in personalizing RTX treatment in AAV patients.
Keywords: ANCA antibodies; ANCA-associated vasculitis; B-cells; glomerulonephritis; highly sensitive flow cytometry; immunomonitoring; minimal residual autoimmunity; rituximab.
Copyright © 2020 van Dam, Oskam, Kamerling, Arends, Bredewold, Berkowska, van Dongen, Rabelink, van Kooten and Teng.
Conflict of interest statement
The authors declare that the research was conducted in the absence of any commercial or financial relationships that could be construed as a potential conflict of interest.
Figures
Similar articles
-
Defects in B-lymphopoiesis and B-cell maturation underlie prolonged B-cell depletion in ANCA-associated vasculitis.Ann Rheum Dis. 2024 Oct 21;83(11):1536-1548. doi: 10.1136/ard-2024-225587. Ann Rheum Dis. 2024. PMID: 38851295 Free PMC article.
-
B cell repopulation kinetics after rituximab treatment in ANCA-associated vasculitides compared to rheumatoid arthritis, and connective tissue diseases: a longitudinal observational study on 120 patients.Arthritis Res Ther. 2017 May 18;19(1):101. doi: 10.1186/s13075-017-1306-0. Arthritis Res Ther. 2017. PMID: 28521808 Free PMC article.
-
PR3-ANCAs predict relapses in ANCA-associated vasculitis patients after rituximab.Nephrol Dial Transplant. 2021 Jul 23;36(8):1408-1417. doi: 10.1093/ndt/gfaa066. Nephrol Dial Transplant. 2021. PMID: 32601673 Free PMC article.
-
Impact of rituximab trials on the treatment of ANCA-associated vasculitis.Nephrol Dial Transplant. 2014 Jun;29(6):1151-9. doi: 10.1093/ndt/gft318. Epub 2013 Oct 14. Nephrol Dial Transplant. 2014. PMID: 24126571 Review.
-
B-cell-targeted therapy in systemic vasculitis.Curr Opin Rheumatol. 2016 Jan;28(1):15-20. doi: 10.1097/BOR.0000000000000235. Curr Opin Rheumatol. 2016. PMID: 26599379 Review.
Cited by
-
Automated EuroFlow approach for standardized in-depth dissection of human circulating B-cells and plasma cells.Front Immunol. 2023 Oct 17;14:1268686. doi: 10.3389/fimmu.2023.1268686. eCollection 2023. Front Immunol. 2023. PMID: 37915569 Free PMC article.
-
Anti-myeloperoxidase IgM B cells in anti-neutrophil cytoplasmic antibody-associated vasculitis.Nat Commun. 2025 Feb 12;16(1):1582. doi: 10.1038/s41467-025-56786-x. Nat Commun. 2025. PMID: 39939347 Free PMC article.
-
CD19-targeting CAR T cells protect from ANCA-induced acute kidney injury.Ann Rheum Dis. 2024 Mar 12;83(4):499-507. doi: 10.1136/ard-2023-224875. Ann Rheum Dis. 2024. PMID: 38182404 Free PMC article.
-
Unmet needs in ANCA-associated vasculitis: Physicians' and patients' perspectives.Front Immunol. 2023 Feb 23;14:1112899. doi: 10.3389/fimmu.2023.1112899. eCollection 2023. Front Immunol. 2023. PMID: 36911748 Free PMC article. Review.
-
Insights From Early Clinical Trials Assessing Response to mRNA SARS-CoV-2 Vaccination in Immunocompromised Patients.Front Immunol. 2022 Mar 4;13:827242. doi: 10.3389/fimmu.2022.827242. eCollection 2022. Front Immunol. 2022. PMID: 35309332 Free PMC article. Review.
References
-
- Gopaluni S, Smith RM, Lewin M, McAlear CA, Mynard K, Jones RB, et al. Rituximab versus azathioprine as therapy for maintenance of remission for anti-neutrophil cytoplasm antibody-associated vasculitis (RITAZAREM): study protocol for a randomized controlled trial. Trials (2017) 18(1):112. 10.1186/s13063-017-1857-z - DOI - PMC - PubMed
-
- Charles P, Terrier B, Perrodeau E, Cohen P, Faguer S, Huart A, et al. Comparison of individually tailored versus fixed-schedule rituximab regimen to maintain ANCA-associated vasculitis remission: results of a multicentre, randomised controlled, phase III trial (MAINRITSAN2). Ann Rheumatic Dis (2018) 77(8):1143–9. 10.1136/annrheumdis-2017-212878 - DOI - PubMed
Publication types
MeSH terms
Substances
LinkOut - more resources
Full Text Sources
Research Materials
Miscellaneous