. 2020 Dec 15:11:599464.
doi: 10.3389/fpls.2020.599464. eCollection 2020.

Co-expression Networks From Gene Expression Variability Between Genetically Identical Seedlings Can Reveal Novel Regulatory Relationships

Affiliations

Co-expression Networks From Gene Expression Variability Between Genetically Identical Seedlings Can Reveal Novel Regulatory Relationships

Sandra Cortijo et al. Front Plant Sci. .

Abstract

Co-expression networks are a powerful tool to understand gene regulation. They have been used to identify new regulation and function of genes involved in plant development and their response to the environment. Up to now, co-expression networks have been inferred using transcriptomes generated on plants experiencing genetic or environmental perturbation, or from expression time series. We propose a new approach by showing that co-expression networks can be constructed in the absence of genetic and environmental perturbation, for plants at the same developmental stage. For this, we used transcriptomes that were generated from genetically identical individual plants that were grown under the same conditions and for the same amount of time. Twelve time points were used to cover the 24-h light/dark cycle. We used variability in gene expression between individual plants of the same time point to infer a co-expression network. We show that this network is biologically relevant and use it to suggest new gene functions and to identify new targets for the transcriptional regulators GI, PIF4, and PRR5. Moreover, we find different co-regulation in this network based on changes in expression between individual plants, compared to the usual approach requiring environmental perturbation. Our work shows that gene co-expression networks can be identified using variability in gene expression between individual plants, without the need for genetic or environmental perturbations. It will allow further exploration of gene regulation in contexts with subtle differences between plants, which could be closer to what individual plants in a population might face in the wild.

Keywords: Arabidopsis; co-expression analysis; gene expression; modules; networks; seedlings; variability.


Conflict of interest statement

The authors declare that the research was conducted in the absence of any commercial or financial relationships that could be construed as a potential conflict of interest.

Figures
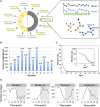
FIGURE 1
FIGURE 1
Inference of gene co-expression networks in absence of genetic and environmental perturbations. (A) Description of co-expression network inference using transcriptomes performed on single seedlings. Transcriptomes were generated for a total of 14 seedlings per time point, with 12 time points spanning a day/night cycle over 24 h. In each time point, genes with correlated expression profiles in the 14 seedlings were identified. The co-expression network was inferred based on pairs of genes significantly correlated in at least four consecutive time points. Finally, modules in the network, which consist of groups of genes that are densely connected, were detected. (B) Total number of edges in the final network that are detected in each time point. (C) Distribution of the number of genes present in each of the 153 modules. Inset shows the same data plotted with a logarithmic scale. (D) Number of edges that are detected in each time point for four modules: module 1 in which most edges are detected during day time, module 21 in which most edges are detected during the night time, module 8 in which most edges are detected at the transition between night and day, and module 12 in which most edges are detected at the transition between day and night.
FIGURE 2
FIGURE 2
Expression profiles throughout the time course for genes in each module with 5 genes or more, using the average expression of the fourteen seedlings for each time point. Each line represents the normalized expression (z-score) for one gene. Modules are ordered by the percentage of genes in the averaged time course network (high to low). Modules highlighted in blue contain 50% or more of genes that are also in the averaged time course network. Modules highlighted in red contain 15% or less of genes that are also in the averaged time course network.
FIGURE 3
FIGURE 3
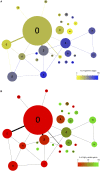
Network architecture is mainly influenced by the time of day when edges are detected and by the presence of highly variable genes in modules. Organization of modules in the network, with the size of circles representing the module size (i.e., number of edges). Number of edges connecting the modules is represented by the thickness of the lines between modules. The number in each module corresponds to the module number. (A) Modules are color coded based on the percentage of edges that are detected during the night in each module. Blue modules are composed of a majority of nighttime edges, while yellow modules are mainly composed of daytime edges. (B) Modules are color coded based on the percentage of highly variable genes (HVGs) in the modules. Green modules are composed of a majority of HVGs while red modules have a low percentage of HVGs.
FIGURE 4
FIGURE 4
Modules enriched in genes involved in the photosynthesis and the glucosinolate pathway. (A) Functional analysis of modules 8 and 37. For each module, the number of genes that are part of photosystem I (green), photosystem II (orange), the light harvesting complex (blue), or the ATP synthase (purple) is indicated. (B) Functional analysis of module 1. Genes of the module are color coded depending on their role in the glucosinolate pathway: biosynthesis (turquoise), transport (green), or regulation (orange). Genes previously identified as co-expressed with glucosinolate biosynthesis genes are also indicated (gray). On the right side, the glucosinolate biosynthesis pathway is shown with an indication of the number of genes present in module 1 at each step of the pathway.
FIGURE 5
FIGURE 5
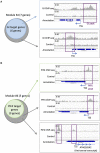
Additional TF targets can be identified using TF target enrichment in modules. (A) Analysis of GI transcriptional regulator targets on module 64: six of the seven genes in module 64 are known targets of GI (left). IGV screenshot showing the signal for the GI ChIP-seq (right) at a known GI target (top) and for the seventh gene in module 64 that is not known as a GI target (bottom). (B) Analysis of PIF4 TF targets on module 86: three of the five genes in module 86 are known targets of PIF4 (left). IGV screenshot showing the signal for the PIF4 ChIP-seq (right) at a known PIF4 target (top) and for the two other genes in module 86 that are not known as a PIF4 target (bottom).

Similar articles

Cited by

References

    1. Amrine K. C. H., Blanco-Ulate B., Cantu D. (2015). Discovery of core biotic stress responsive genes in Arabidopsis by weighted gene co-expression network analysis. PLoS One 10:e0118731. 10.1371/journal.pone.0118731 - DOI - PMC - PubMed
    1. Aoki K., Ogata Y., Shibata D. (2007). Approaches for extracting practical information from gene co-expression networks in plant biology. Plant Cell Physiol. 48 381–390. 10.1093/pcp/pcm013 - DOI - PubMed
    1. Bauer S., Grossmann S., Vingron M., Robinson P. N. (2008). Ontologizer 2.0–a multifunctional tool for GO term enrichment analysis and data exploration. Bioinformatics 24 1650–1651. 10.1093/bioinformatics/btn250 - DOI - PubMed
    1. Bhosale R., Jewell J. B., Hollunder J., Koo A. J. K., Vuylsteke M., Michoel T., et al. (2013). Predicting gene function from uncontrolled expression variation among individual wild-type Arabidopsis plants. Plant Cell 25 2865–2877. 10.1105/tpc.113.112268 - DOI - PMC - PubMed
    1. Blondel V. D., Guillaume J.-L., Lambiotte R., Lefebvre E. (2008). Fast unfolding of communities in large networks. J. Stat. Mech. 2008:10008 10.1088/1742-5468/2008/10/P10008 - DOI

LinkOut - more resources