. 2020 Dec 15:11:592436.
doi: 10.3389/fgene.2020.592436. eCollection 2020.

HOXA5 Expression Is Elevated in Breast Cancer and Is Transcriptionally Regulated by Estradiol

Affiliations

HOXA5 Expression Is Elevated in Breast Cancer and Is Transcriptionally Regulated by Estradiol

Imran Hussain et al. Front Genet. .

Abstract

HOXA5 is a homeobox-containing gene associated with the development of the lung, gastrointestinal tract, and vertebrae. Here, we investigate potential roles and the gene regulatory mechanism in HOXA5 in breast cancer cells. Our studies demonstrate that HOXA5 expression is elevated in breast cancer tissues and in estrogen receptor (ER)-positive breast cancer cells. HOXA5 expression is critical for breast cancer cell viability. Biochemical studies show that estradiol (E2) regulates HOXA5 gene expression in cultured breast cancer cells in vitro. HOXA5 expression is also upregulated in vivo in the mammary tissues of ovariectomized female rats. E2-induced HOXA5 expression is coordinated by ERs. Knockdown of either ERα or ERβ downregulated E2-induced HOXA5 expression. Additionally, ER co-regulators, including CBP/p300 (histone acetylases) and MLL-histone methylases (MLL2, MLL3), histone acetylation-, and H3K4 trimethylation levels are enriched at the HOXA5 promoter in present E2. In summary, our studies demonstrate that HOXA5 is overexpressed in breast cancer and is transcriptionally regulated via estradiol in breast cancer cells.

Keywords: HOXA5; breast cancer; chromatin; estradiol; estrogen receptors; gene expression.


Conflict of interest statement

The authors declare that the research was conducted in the absence of any commercial or financial relationships that could be construed as a potential conflict of interest.

Figures

Figure 1
Figure 1
HOXA5 expression in breast cancer cells and tissues. (A) Comparison of HOXA5 expression in different cell lines. The total RNA was isolated from CCL228 (colon cancer), H358 (lung cancer) HeLa (cervical cancer), JAR (placental cancer), MDAMB231 (ER-negative breast cancer), T47D (ER-positive breast cancer), MCF7 (ER-positive breast cancer) cell lines and analyzed by RT-qPCR using primers specific to HOXA5 and GAPDH (loading control). HOXA5 expression relative to GAPDH is plotted. Bars indicate averages ± standard errors (n = 3). **denotes p < 0.0001 compared to HEK293F control cells (B–D) HOXA5 expression in breast cancer tissue. Tissue microarray slide (containing six cases of human breast cancer cases and respective adjacent normal breast tissue) was subjected to DAB staining with HOXA5 antibody. The HOXA5 expression level was quantified (C). A magnified view of case 3 is in (D).
Figure 2
Figure 2
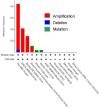
CBioportal analysis of breast cancer database for HOXA5 expression. HOXA5 expression in different types of breast cancer patients using a preexisting cancer gene expression database using a cBioPortal online data analysis tool (https://www.cbioportal.org). The data provided by cBioPortal includes mutations, deletions, and copy-number amplifications for HOXA5; CAN, copy number alteration.
Figure 3
Figure 3
HOXA5 knockdown affects cell viability and cell-cycle progression. (A–C) MCF7 cells were transfected with HOXA5-specific and scramble antisense for 48 h, RNA was analyzed by RT-PCR with primers specific to HOXA5 (A, quantification in B). GAPDH was used as normalization control. Bars indicate averages ± standard errors (n = 3). **denotes p < 0.0001 compared to scramble control. Proteins were analyzed by Western blot using HOXA5 and β-actin (loading control) antibodies (C). (D,E) Impact of HOXA5 knockdown on cell growth and viability. MCF7 cells were transfected with HOXA5-specific and scramble-antisense oligonucleotides. Live cell numbers were counted under HOXA5 knockdown conditions for varying periods of time and plotted in (D). Data points indicate averages ± standard errors (n = 3). **denotes p < 0.0001 compared to scramble control. Morphologies of cells were visualized under a microscope (Nikon Eclipse TE2000-U) (E). Bars indicate standard errors (n = 3). (F) Flow cytometry analysis. MCF7 cells were treated with HOXA5 and scramble antisense separately for 48 h and subjected to flow cytometry analysis. Panel 1: Control cells treated with no antisense, panel 2: cells treated with scramble-antisense, panels 3–5: cells treated with increasing concentration of HOXA5-specific antisense. The cell populations at different stages of the cell cycle are shown inside the respective panels.
Figure 4
Figure 4
E2-induced expression of HOXA5. (A,B) E2-induced expression of HOXA5 in MCF7 cells. MCF7 cells (grown in phenol red–free media and charcoal-stripped FBS) were treated with varying concentrations (0–10 nM) of E2 for 6 h in the presence and absence of 10 nM tamoxifen. RNA analyzed by RT-PCR using primers specific to HOXA5 and GAPDH (control). An agarose gel analysis picture of the PCR products is shown in (A), and qPCR analysis (expression of HOXA5 relative to GAPDH) is in (B). Bars indicate averages ± standard errors (n = 3). **denotes p < 0.0001 compared to untreated controls; *denotes p < 0.001 compared to 10 nM E2. (C–E) Effects of E2 on HOXA5 expression in OVX rats in vivo. OVX female rats were treated with E2 (5 μg for 24 h) or vehicle (peanut oil/saline). RNA and protein were isolated from the mammary glands of the control and E2-treated animals. RNA was analyzed by RT-PCR using rat-specific primers for HOXA5 (quantification in D); GAPDH was used as a loading control. Each experiment was repeated thrice with three parallel replicates. Bars indicate averages ± standard errors, **denotes p < 0.0001 compared to vehicle control. Western blot analysis of the HOXA5 protein levels from the protein samples obtained from control, E2-treated mammary gland tissues of animals are shown in (E). β-actin was used as the loading control. Each experiment was repeated at least thrice (n = 3).
Figure 5
Figure 5
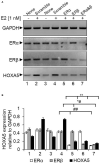
Knockdown of ERs and its impact on E2-induced HOXA5 expression. MCF7 cells were transfected with ERα or ERβ-specific ASOs or a scramble antisense for 48 h, followed by treatment with E2 (1 nM, 6 h). RNA was analyzed by RT-qPCR by using primers specific to HOXA5, ERs, and GAPDH (control) separately (A). Lane 1: control cells (no E2); lane 2: cells treated with E2; lanes 3 and 4: cells treated with scramble antisense in the absence and presence E2; lanes 5 and 6: cells treated with ERα and ERβ antisense, respectively, followed by exposure to E2; lane 7: cells transfected with 1:1 mixture of ERα and ERβ antisenses in the presence of E2. The qPCR analysis data is in (B). qPCR reactions were carried out in three parallel replicates, and each experiment was repeated at least thrice (n = 3). Bars indicate averages ± standard errors. **indicates p < 0.0001 compared to E2-treated scramble control (for HOXA5 target); *#indicates p < 0.0001 compared to E2-treated scramble control (for ERβ target); ##indicates p < 0.0001 compared to E2-treated scramble control (for ERα target).
Figure 6
Figure 6
ERα and ERβ enrichment on the HOXA5 promoter ERE in the presence of E2. The HOXA5 promoter contains two putative ERE regions (ERE1 and ERE2) near the transcription start site (A). E2-treated (nM E2 for 6 h) and control (untreated) MCF7 cells were analyzed by ChIP assay using antibodies against ERα, ERβ, and β-actin (control). The ChIP DNA was analyzed by regular PCR (agarose gel analysis, B) and qPCR (C) using HOXA5 promoter primers (ERE1 and ER2 regions). Bars indicate averages ± standard errors (n = 3). *denotes p < 0.0001 compared to ERα ChIP control; #denotes p < 0.0001 compared to ERβ ChIP control for both the EREs.
Figure 7
Figure 7
Enrichment of ER co-regulators at the HOXA5 promoter EREs. E2-treated (1 nM, 6 h) MCF7 cells were analyzed by ChIP assay using different antibodies. The ChIP DNA was analyzed by PCR using HOXA5 promoter primers (ERE1 and ERE2 regions). An agarose gel analysis showing the recruitment of selected factors on the ERE1 and ERE2 regions of the HOXA5 promoter is shown in (A). qPCR analysis of the ChIP DNA samples showing the enrichment (relative to input) of CBP, p300, MLL1, MLL2, MLL3, MLL4, H3K4-trimethyl, histone acetylation, RNAP II, and β-actin into the ERE1 and ERE2 regions of the HOXA5 promoter region in the presence of E2 is shown in (B,C). For (B,C), bars indicate averages ± standard errors (n = 3). *denotes p < 0.0001 compared to respective ChIP control for ERE1; #denotes p < 0.0001 compared to respective ChIP control for ERE2.
Figure 8
Figure 8
Model showing the mechanism of E2-mediated activation of HOXA5. Binding of E2 induces conformational change in ERs and induces dimerization and activation of ERs. Activated ER dimers enter the nucleus, bind to the HOXA5 promoter (EREs). ER co-regulators (CBP, p300, MLL2, MLL3, and others) also bind to the HOXA5 promoter, modify chromatins (H3K4-trimethylation via MLL2 and MLL3 and histone acetylation via CBP/p300), aid in recruitment of RNA polymerase II (RNAP II) and general transcription factors (GTFs) to the promoter and ultimately lead to transcription activation of HOXA5.

Similar articles

Cited by

References

    1. Abdel-Wahab O., Adli M., LaFave L. M., Gao J., Hricik T., Shih A. H., et al. . (2012). ASXL1 mutations promote myeloid transformation through loss of PRC2-mediated gene repression. Cancer Cell 22, 180–193. 10.1016/j.ccr.2012.06.032 - DOI - PMC - PubMed
    1. Acampora D., D'Esposito M., Faiella A., Pannese M., Migliaccio E., Morelli F., et al. . (1989). The human HOX gene family. Nucleic Acids Res. 17, 10385–10402. 10.1093/nar/17.24.10385 - DOI - PMC - PubMed
    1. Akam M. (1987). The molecular basis for metameric pattern in the Drosophila embryo. Development 101, 1–22. - PubMed
    1. Ansari K. I., Hussain I., Kasiri S., Mandal S. S. (2012a). HOXC10 is overexpressed in breast cancer and transcriptionally regulated by estrogen via involvement of histone methylases MLL3 and MLL4. J. Mol. Endocrinol. 48, 61–75. 10.1530/JME-11-0078 - DOI - PubMed
    1. Ansari K. I., Hussain I., Shrestha B., Kasiri S., Mandal S. S. (2011a). HOXC6 Is transcriptionally regulated via coordination of MLL histone methylase and estrogen receptor in an estrogen environment. J. Mol. Biol. 411, 334–349. 10.1016/j.jmb.2011.05.050 - DOI - PMC - PubMed