. 2020 Dec 18:8:e10532.
doi: 10.7717/peerj.10532. eCollection 2020.

The p53 signaling pathway of the large yellow croaker (Larimichthys crocea) responds to acute cold stress: evidence via spatiotemporal expression analysis of p53, p21, MDM2, IGF-1, Gadd45, Fas, and Akt

Affiliations

The p53 signaling pathway of the large yellow croaker (Larimichthys crocea) responds to acute cold stress: evidence via spatiotemporal expression analysis of p53, p21, MDM2, IGF-1, Gadd45, Fas, and Akt

Baoying Qian et al. PeerJ. .

Abstract

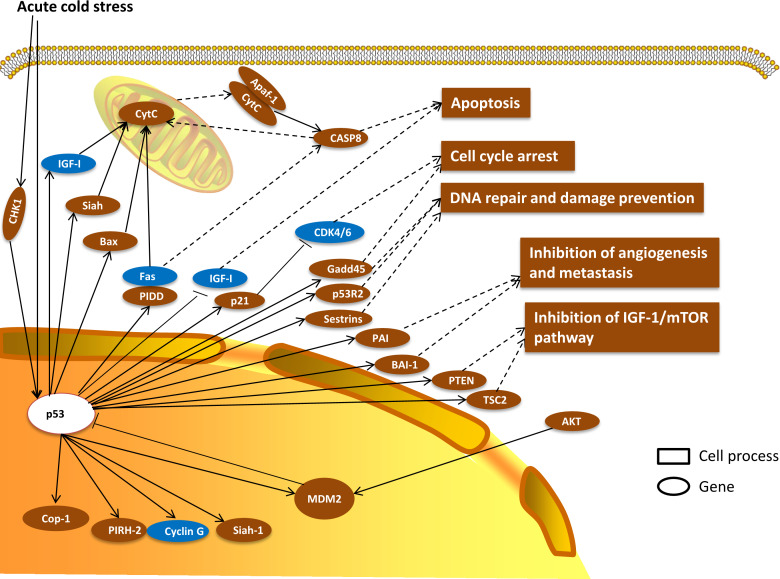
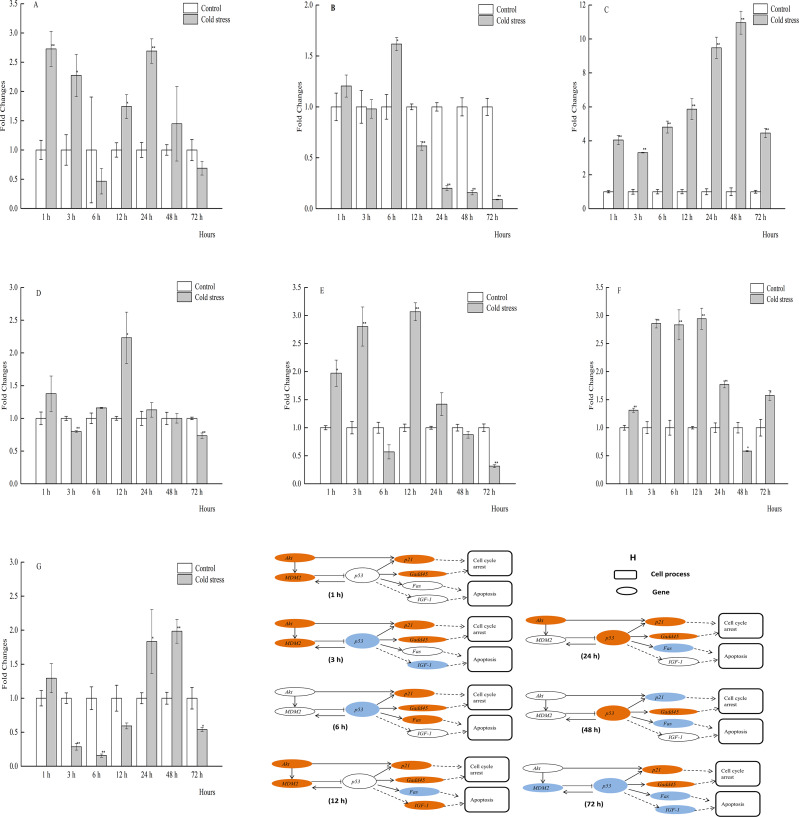
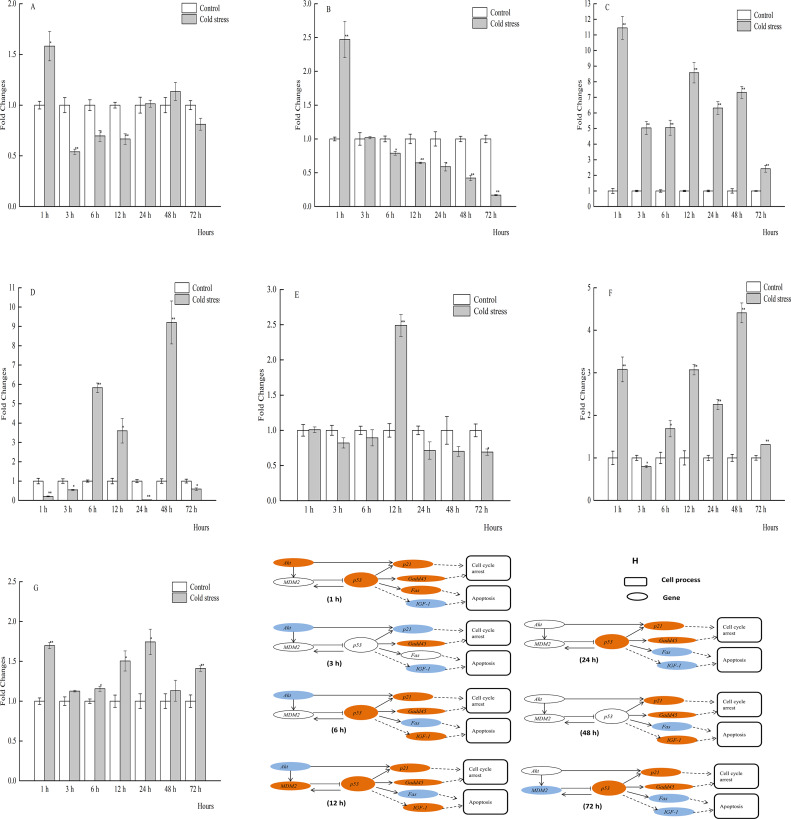
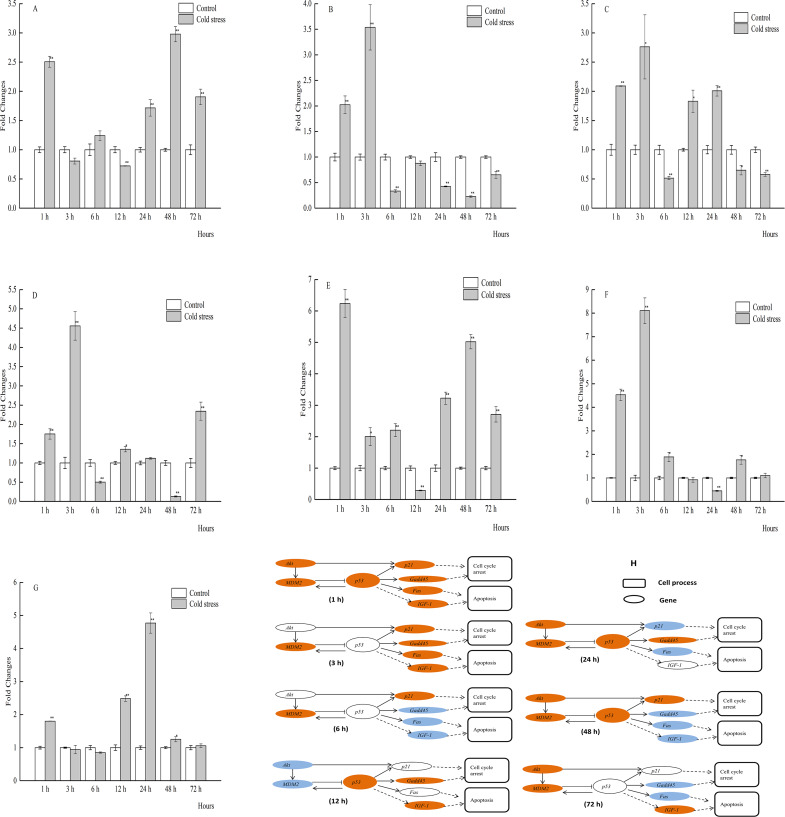
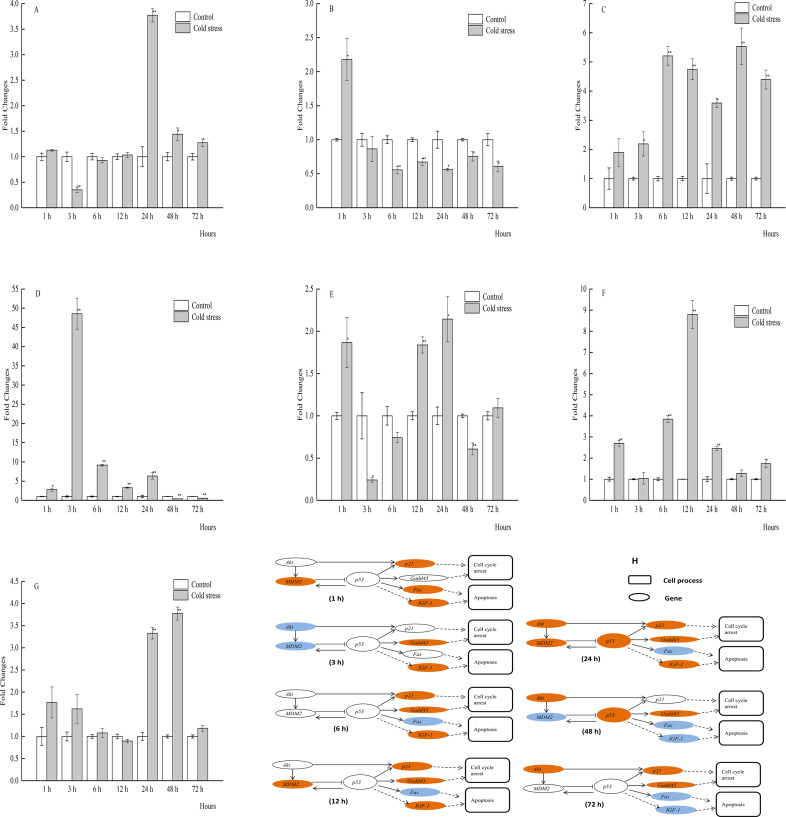
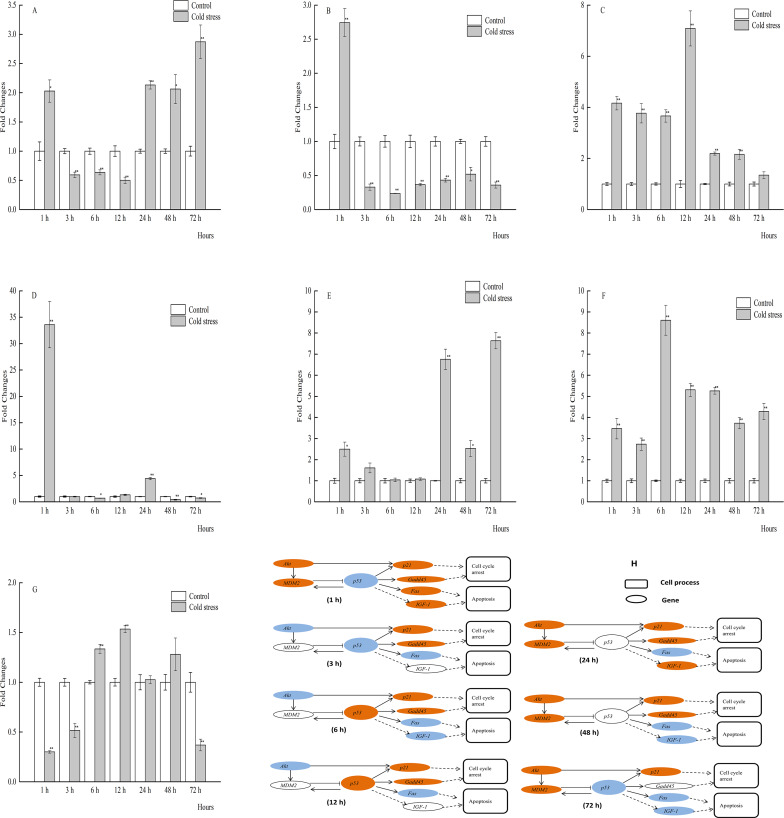
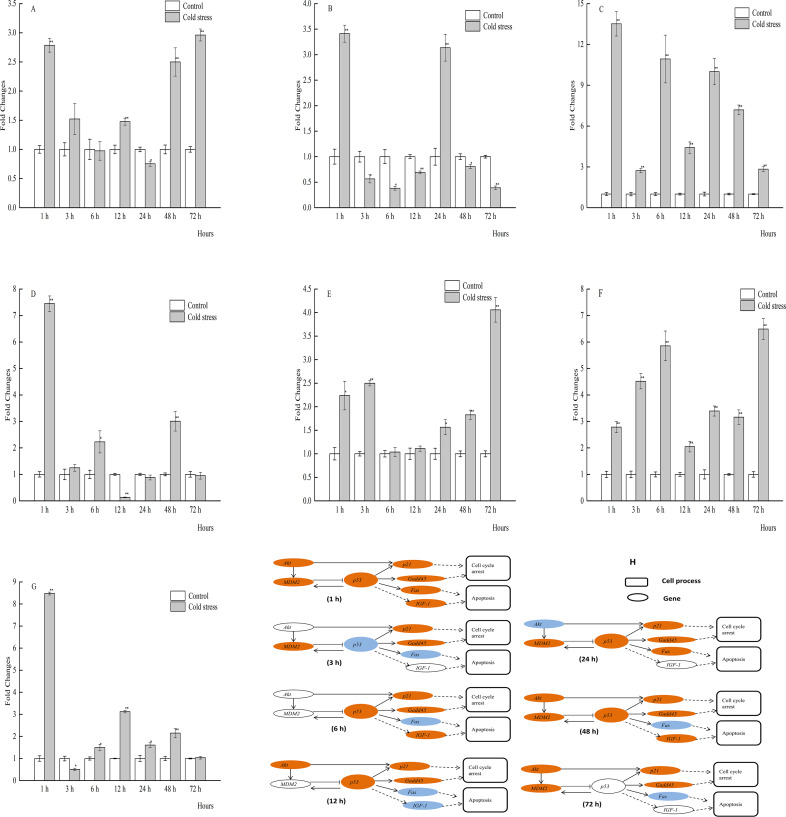
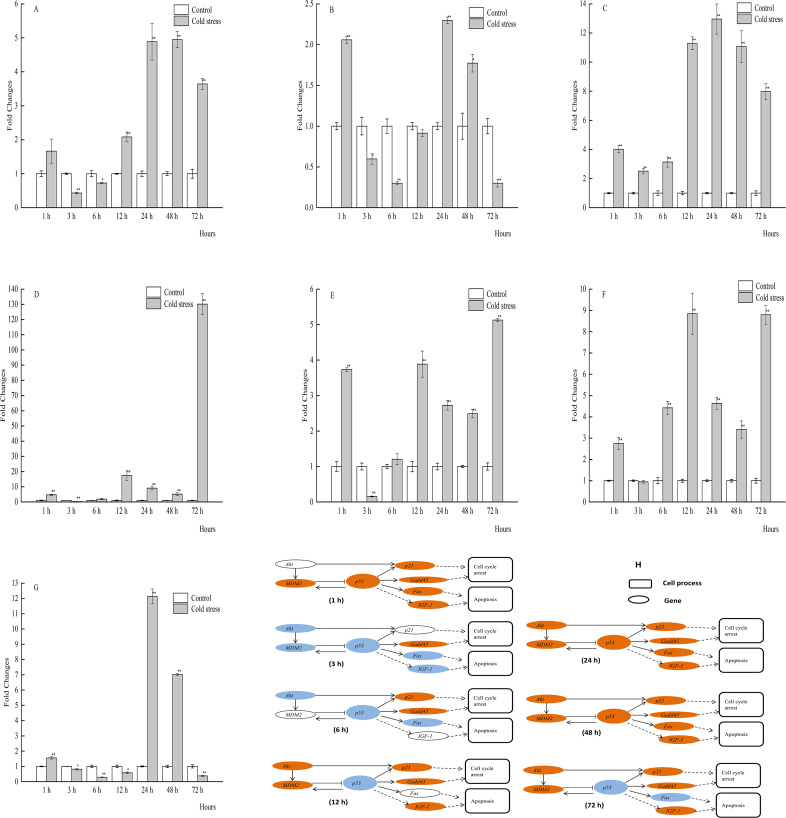
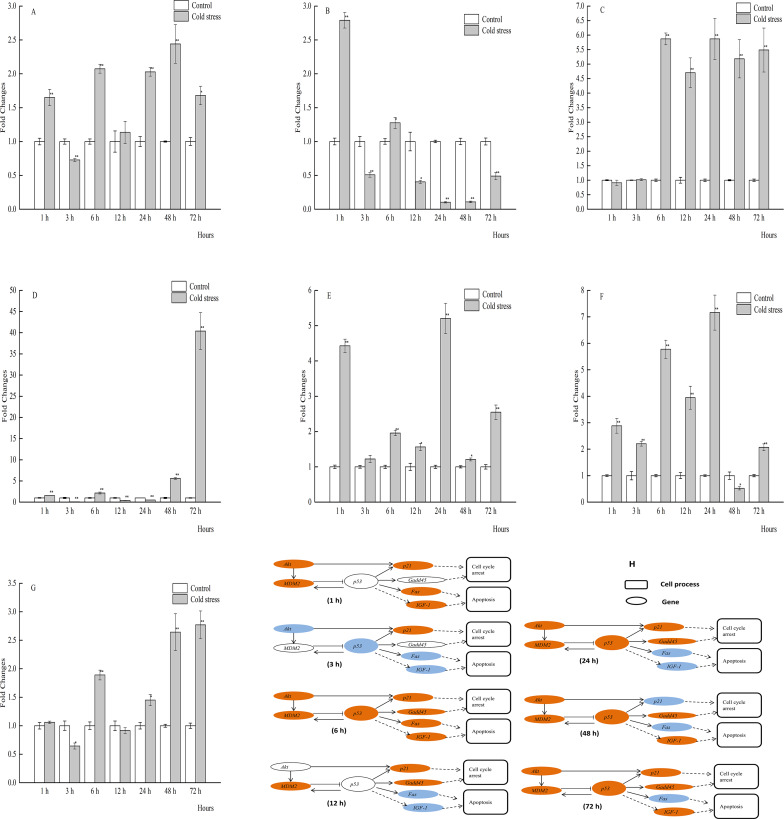
The p53 activation is induced by stressors, such as DNA damage, oxidative stress, and activated oncogenes, and can promote cell cycle arrest, cellular senescence, and apoptosis. The large yellow croaker (Larimichthys crocea) is an important warm temperate marine fish in the Chinese aquiculture industry. However, few studies have investigated the role of p53 in the response of L. crocea to environmental stressors. Therefore, the aim of the present study was to assess the spatiotemporal mRNA expression levels of genes involved in the p53 signaling pathway of the large yellow croaker in response to cold stress. The results showed significant changes in the expression levels of p53, p21, MDM2, IGF-1, Gadd45, Fas, and Akt in various tissues of the large yellow croaker in response to cold stress for different times. As compared to the control group, p53 mRNA expression was upregulated in most of the examined tissues at 24 h with the exception of the gill. In the liver, the expression levels of p53 and Fas were significantly decreased at 12 h, while those of p21, MDM2, IGF-1, Gadd45 were dramatically increased. Akt expression was notably changed in response to cold in several tissues. These results suggested that p53 was potentially a key gene in the large yellow croaker response to cold and possibly other environmental stressors.

Keywords: Cold stress; Gene network; Large yellow croaker; mRNA expression; p53 signaling pathway.


Conflict of interest statement

The authors declare there are no competing interests.

Figures

Figure 1
Figure 1. Putative gene networks in large yellow croaker stressed by 12 h acute cold based on the transcriptome data of previous studies.
Enriched gene networks associated with cell cycle arrest, apoptosis, p53 negative feedback, and DNA repair and damage prevention. Brown indicates up-regulated, blue indicates down-regulated, white indicates no changes. Full names of abbreviated genes are listed in Abbreviation.
Figure 2
Figure 2. qPCR analysis of genes in the liver of large yellow croaker under acute cold stress.
(A) Akt (protein kinase B), (B) Fas (tumor necrosis factor receptor superfamily member 6), (C) Gadd45 (growth arrest and DNA damage-inducible protein), (D) IGF-1 (insulin-like growth factor 1), (E)MDM2 (E3 ubiquitin-protein ligase mdm2), (F) p21 (cyclin-dependent kinase inhibitor 1A), (G) p53 (tumor protein p53); (H) putative gene networks based on qPCR data; orange indicates up-regulated, blue indicates down-regulated, white indicates no changes. The results are expressed as mean fold change ± SD (n = 3 fish per treatment). Significant differences were considered at *0.01 ≤P < 0.05 and **P < 0.01.
Figure 3
Figure 3. qPCR analysis of genes in the muscle of large yellow croaker under acute cold stress.
(A) Akt (protein kinase B), (B) Fas (tumor necrosis factor receptor superfamily member 6), (C) Gadd45 (growth arrest and DNA damage-inducible protein), (D) IGF-1 (insulin-like growth factor 1), (E) MDM2 (E3 ubiquitin-protein ligase mdm2), (F) p21 (cyclin-dependent kinase inhibitor 1A), (G) p53 (tumor protein p53); (H) putative gene networks based on qPCR data; orange indicates up-regulated, blue indicates down-regulated, white indicates no changes. The results are expressed as mean fold change ±SD (n = 3 fish per treatment). Significant differences were considered at *0.01 ≤P < 0.05 and **P < 0.01.
Figure 4
Figure 4. qPCR analysis of genes in the brain of large yellow croaker under acute cold stress.
(A) Akt (protein kinase B), (B) Fas (tumor necrosis factor receptor superfamily member 6), (C) Gadd45 (growth arrest and DNA damage-inducible protein), (D) IGF-1 (insulin-like growth factor 1), (E) MDM2 (E3 ubiquitin-protein ligase mdm2), (F) p21 (cyclin-dependent kinase inhibitor 1A), (G) p53 (tumor protein p53); (H) putative gene networks based on qPCR data; orange indicates up-regulated, blue indicates down-regulated, white indicates no changes. The results are expressed as mean fold change ± SD (n = 3 fish per treatment). Significant differences were considered at *0.01 ≤P < 0.05 and **P < 0.01.
Figure 5
Figure 5. qPCR analysis of genes in the spleen of large yellow croaker under acute cold stress.
(A) Akt (protein kinase B), (B) Fas (tumor necrosis factor receptor superfamily member 6), (C) Gadd45 (growth arrest and DNA damage-inducible protein), (D) IGF-1 (insulin-like growth factor 1), (E) MDM2 (E3 ubiquitin-protein ligase mdm2), (F) p21 (cyclin-dependent kinase inhibitor 1A), (G) p53 (tumor protein p53); (H) putative gene networks based on qPCR data; orange indicates up-regulated, blue indicates down-regulated, white indicates no changes. The results are expressed as mean fold change ± SD (n = 3 fish per treatment). Significant differences were considered at *0.01 ≤P < 0.05 and **P < 0.01.
Figure 6
Figure 6. qPCR analysis of genes in the gill of large yellow croaker under acute cold stress.
(A) Akt (protein kinase B), (B) Fas (tumor necrosis factor receptor superfamily member 6), (C) Gadd45 (growth arrest and DNA damage-inducible protein), (D) IGF-1 (insulin-like growth factor 1), (E) MDM2 (E3 ubiquitin-protein ligase mdm2), (F) p21 (cyclin-dependent kinase inhibitor 1A), (G) p53 (tumor protein p53); (H) putative gene networks based on qPCR data; orange indicates up-regulated, blue indicates down-regulated, white indicates no changes. The results are expressed as mean fold change ± SD (n = 3 fish per treatment). Significant differences were considered at *0.01 ≤P < 0.05 and **P < 0.01.
Figure 7
Figure 7. qPCR analysis of genes in the kidney of large yellow croaker under acute cold stress.
(A) Akt (protein kinase B), (B) Fas (tumor necrosis factor receptor superfamily member 6), (C) Gadd45 (growth arrest and DNA damage-inducible protein), (D) IGF-1 (insulin-like growth factor 1), (E) MDM2 (E3 ubiquitin- protein ligase mdm2), (F) p21 (cyclin- dependent kinase inhibitor 1A), (G) p53 (tumor protein p53); (H) putative gene networks based on qPCR data; orange indicates up-regulated, blue indicates down-regulated, white indicates no changes. The results are expressed as mean fold change ± SD (n = 3 fish per treatment). Significant differences were considered at *0.01 ≤P < 0.05 and **P < 0.01.
Figure 8
Figure 8. qPCR analysis of genes in the intestine of large yellow croaker under acute cold stress.
(A) Akt (protein kinase B), (B) Fas (tumor necrosis factor receptor superfamily member 6), (C) Gadd45 (growth arrest and DNA damage-inducible protein), (D) IGF-1 (insulin-like growth factor 1), (E) MDM2 (E3 ubiquitin-protein ligase mdm2), (F) p21 (cyclin-dependent kinase inhibitor 1A), (G) p53 (tumor protein p53); (H) putative gene networks based on qPCR data; orange indicates up-regulated, blue indicates down-regulated, white indicates no changes. The results are expressed as mean fold change ±SD (n = 3 fish per treatment). Significant differences were considered at *0.01 ≤ P < 0.05 and **P < 0.01.
Figure 9
Figure 9. qPCR analysis of genes in the heart of large yellow croaker under acute cold stress.
(A) Akt (protein kinase B), (B) Fas (tumor necrosis factor receptor superfamily member 6), (C) Gadd45 (growth arrest and DNA damage-inducible protein), (D) IGF-1 (insulin-like growth factor 1), (E) MDM2 (E3 ubiquitin-protein ligase mdm2), (F) p21 (cyclin-dependent kinase inhibitor 1A), (G) p53 (tumor protein p53); (H) putative gene networks based on qPCR data; orange indicates up-regulated, blue indicates down-regulated, white indicates no changes. The results are expressed as mean fold change ±SD (n = 3 fish per treatment). Significant differences were considered at *0.01 ≤P < 0.05 and **P < 0.01.

Similar articles

Cited by

References

    1. Aylon Y, Oren M. The paradox of p53: what, how, and why? Cold Spring Harbor Perspectives in Medicine. 2016;6(10):a026328. doi: 10.1101/cshperspect.a026328. - DOI - PMC - PubMed
    1. Azam N, Vairapandi M, Zhang W, Hoffman B, Liebermann DA. Interaction of CR6 (GADD45 gamma) with proliferating cell nuclear antigen impedes negative growth control. Journal of Biological Chemistry. 2001;276:2766–2774. doi: 10.1074/jbc.M005626200. - DOI - PubMed
    1. Barak Y, Juven T, Haffner R, Oren M. Mdm2 expression is induced by wild type p53 activity. Embo Journal. 1993;12(2):461–468. doi: 10.1002/j.1460-2075.1993.tb05678.x. - DOI - PMC - PubMed
    1. Chen YY. The changes of mRNA expression of MIPS, SCD, CIRP in Pseudosciaena crocea under cold stress in related tissues. Ningbo University; Zhejiang: 2015.
    1. Chen K, Ding YP, Wang JL, Shao BP. Research progress on p53-involved metabolic regulation. Biotechnology Bulletin. 2016;32(11):52–58.