

Proteomic Analysis of Pre-Invasive Serous Lesions of the Endometrium and Fallopian Tube Reveals Their Metastatic Potential
- PMID: 33384952
- PMCID: PMC7771701
- DOI: 10.3389/fonc.2020.523989
Proteomic Analysis of Pre-Invasive Serous Lesions of the Endometrium and Fallopian Tube Reveals Their Metastatic Potential
Abstract
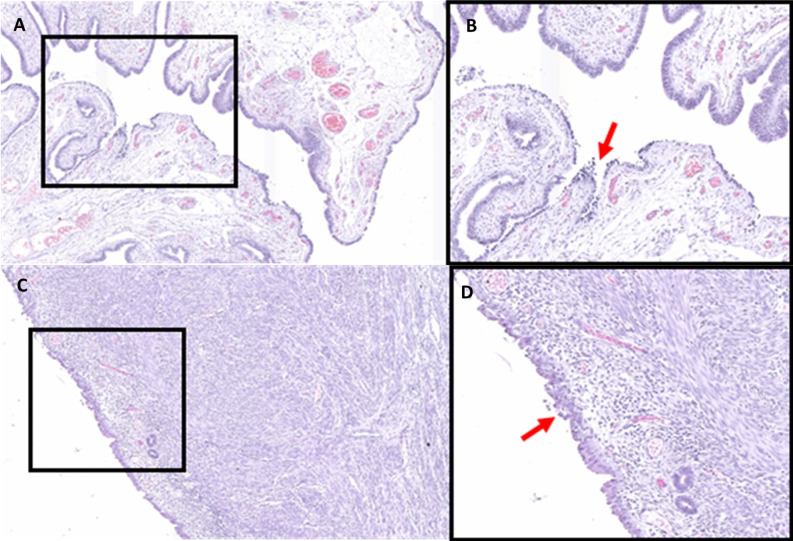
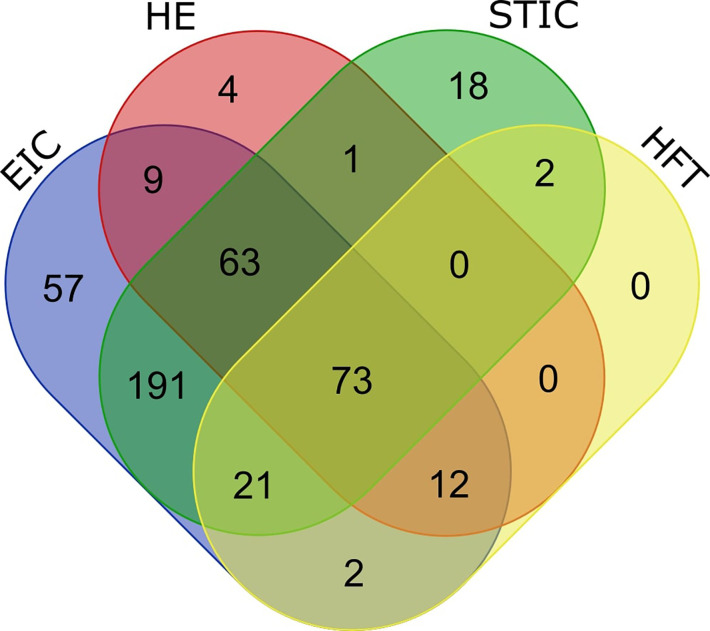
Serous endometrial cancer (SEC) and high grade serous ovarian cancer (HGSOC) are aggressive gynecological malignancies with high rates of metastasis and poor prognosis. Endometrial intraepithelial carcinoma (EIC), the precursor for SEC, and serous tubal intraepithelial carcinoma (STIC), believed to be the precursor lesion for HGSOC, can also be associated with intraabdominal spread. To provide insight into the etiology of these precancerous lesions and to explore the potential molecular mechanisms underlying their metastatic behavior, we performed a proteomic mass spectrometry analysis in a patient with synchronous EIC and STIC. Through histological and molecular identification of precancerous lesions followed by laser capture microdissection, we were able to identify over 450 proteins within the precancerous lesions and adjacent healthy tissue. The proteomic analysis of STIC and EIC showed remarkable overlap in the proteomic patterns, reflecting early neoplastic changes in proliferation, loss of polarity and attachment. Our proteomic analysis showed that both EIC and STIC, despite being regarded as premalignant lesions, have metastatic potential, which correlates with the common presentation of invasive serous gynecological malignancies at advanced stage.
Keywords: endometrial intraepithelial carcinoma; high grade serous ovarian carcinoma; proteomics; serous endometrial carcinoma; serous tubal intraepithelial carcinoma.
Copyright © 2020 Acland, Arentz, Mussared, Whitehead, Hoffmann, Klingler-Hoffmann and Oehler.
Conflict of interest statement
Author FW was employed by the company Clinpath. The remaining authors declare that the research was conducted in the absence of any commercial or financial relationships that could be construed as a potential conflict of interest.
Figures
Similar articles
-
Cell Origins of High-Grade Serous Ovarian Cancer.Cancers (Basel). 2018 Nov 12;10(11):433. doi: 10.3390/cancers10110433. Cancers (Basel). 2018. PMID: 30424539 Free PMC article. Review.
-
Characterization of precursor lesions in the endometrium and fallopian tube epithelium of early-stage uterine serous carcinoma.Int J Gynecol Pathol. 2015 Jan;34(1):57-64. doi: 10.1097/PGP.0000000000000109. Int J Gynecol Pathol. 2015. PMID: 25473754 Free PMC article.
-
[Morphologic changes of fallopian tubal epithelium in ovarian serous tumors].Zhonghua Bing Li Xue Za Zhi. 2012 Jul;41(7):433-7. doi: 10.3760/cma.j.issn.0529-5807.2012.07.001. Zhonghua Bing Li Xue Za Zhi. 2012. PMID: 22932451 Chinese.
-
Serous tubal intraepithelial carcinoma localizes to the tubal-peritoneal junction: a pivotal clue to the site of origin of extrauterine high-grade serous carcinoma (ovarian cancer).Int J Gynecol Pathol. 2015 Mar;34(2):112-20. doi: 10.1097/PGP.0000000000000123. Int J Gynecol Pathol. 2015. PMID: 25675178
-
Precursors and pathogenesis of ovarian carcinoma.Pathology. 2013 Apr;45(3):229-42. doi: 10.1097/PAT.0b013e32835f2264. Pathology. 2013. PMID: 23478230 Review.
Cited by
-
Identification of Potentially Novel Molecular Targets of Endometrial Cancer Using a Non-Biased Proteomic Approach.Cancers (Basel). 2023 Sep 21;15(18):4665. doi: 10.3390/cancers15184665. Cancers (Basel). 2023. PMID: 37760635 Free PMC article.
-
Proteomic Profiling of Fallopian Tube-Derived Extracellular Vesicles Using a Microfluidic Tissue-on-Chip System.Bioengineering (Basel). 2023 Mar 27;10(4):423. doi: 10.3390/bioengineering10040423. Bioengineering (Basel). 2023. PMID: 37106610 Free PMC article.
-
A Protocol for the Acquisition of Comprehensive Proteomics Data from Single Cases Using Formalin-Fixed Paraffin Embedded Sections.Methods Protoc. 2022 Jul 10;5(4):57. doi: 10.3390/mps5040057. Methods Protoc. 2022. PMID: 35893583 Free PMC article.
-
Endometrial cancer diagnostic and prognostic algorithms based on proteomics, metabolomics, and clinical data: a systematic review.Front Oncol. 2023 Apr 6;13:1120178. doi: 10.3389/fonc.2023.1120178. eCollection 2023. Front Oncol. 2023. PMID: 37091170 Free PMC article. Review.
References
LinkOut - more resources
Full Text Sources