. 2020 Dec 15:10:580759.
doi: 10.3389/fonc.2020.580759. eCollection 2020.

Global, Regional, and National Burden of Chronic Myeloid Leukemia, 1990-2017: A Systematic Analysis for the Global Burden of Disease Study 2017

Affiliations

Global, Regional, and National Burden of Chronic Myeloid Leukemia, 1990-2017: A Systematic Analysis for the Global Burden of Disease Study 2017

Qingqing Lin et al. Front Oncol. .

Abstract

Background: With the advent of tyrosine kinase inhibitors (TKIs), the prognosis of chronic myeloid leukemia (CML) seems to have dramatically improved over the last two decades. Accurate information of the global burden of CML is critical for direct health policy and healthcare resource allocation in the era of high-cost TKI therapy.

Objective: This study aimed to evaluate the health burden of CML at global, regional, and national levels from 1990 to 2017.

Methods: We collected data of CML between 1990 and 2017 from the Global Burden of Disease (GBD) study 2017 including, annual incidence, disease-related mortality, and disability-adjusted life-years (DALY), and the corresponding age-standardized rates (ASRs). To summarize the results, countries were categorized by sociodemographic index (SDI) quintiles and 21 GBD regions.

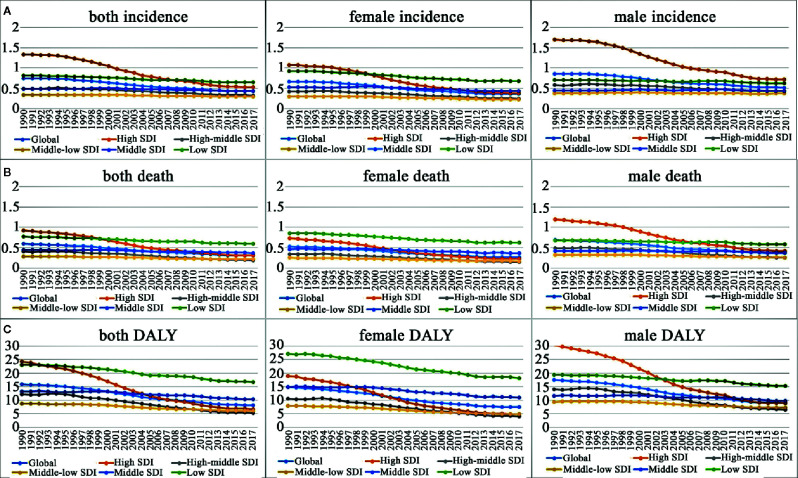
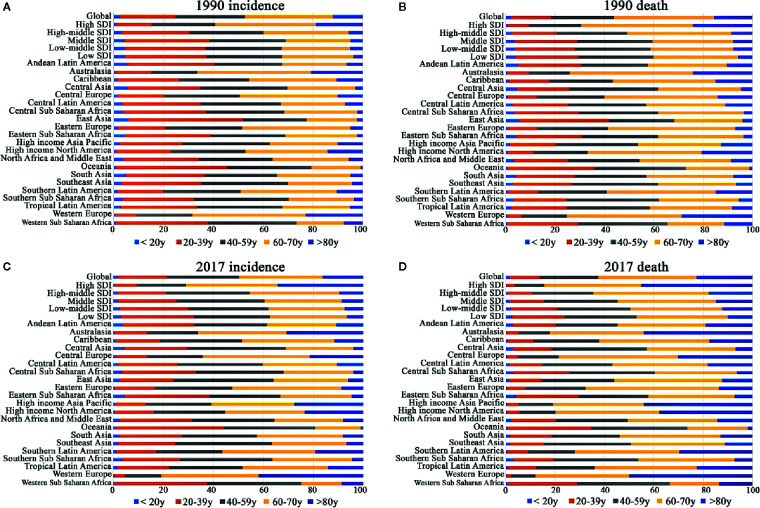
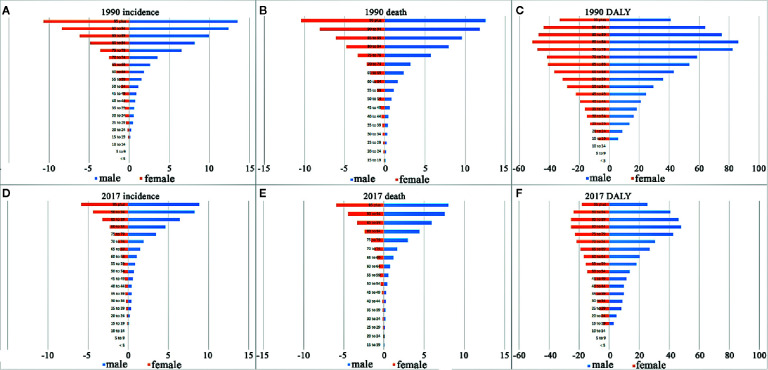
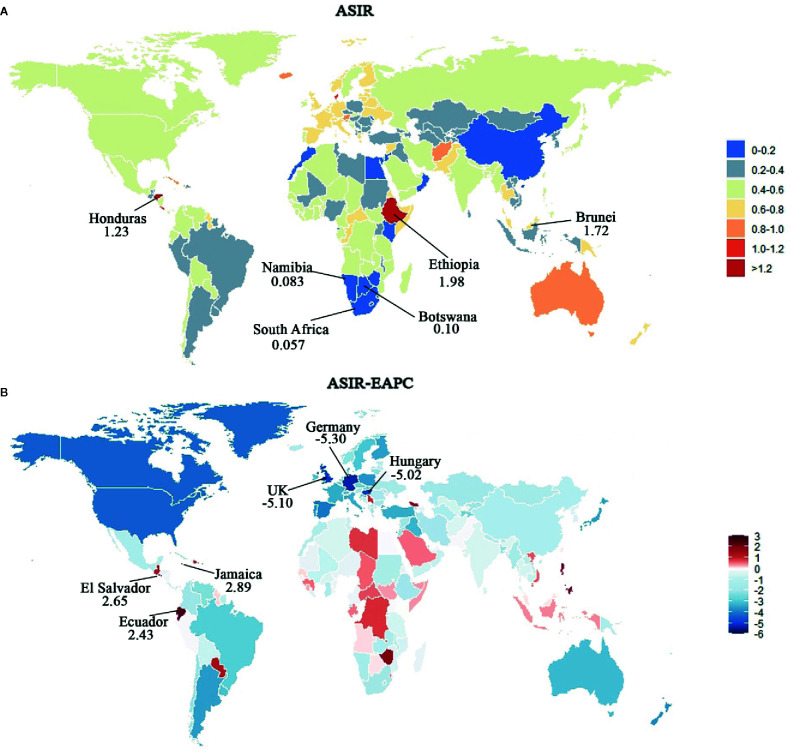
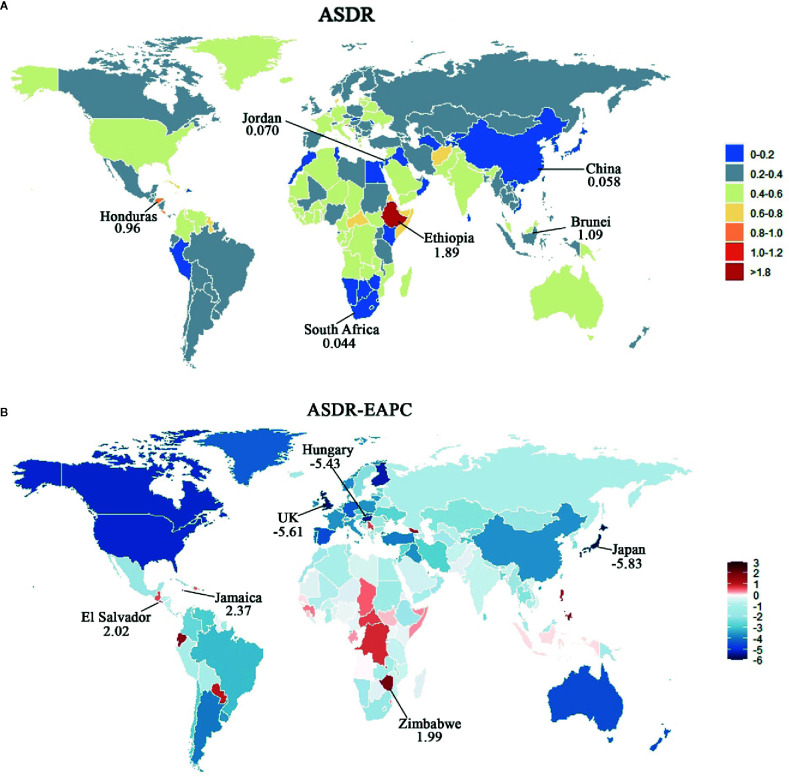
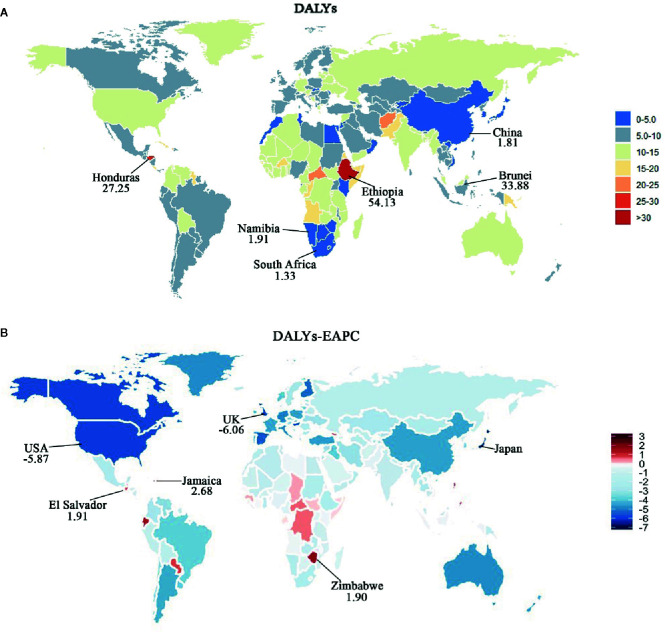
Results: In 2017, an estimated 34,179 [95% Uncertainty Interval (UI), 31,516-36,714) incident cases of CML were recorded, and 24,054 (95%UI, 22,233-26,072) CML-related deaths were reported worldwide. Both, the age-standardized incidence rate (ASIR) and age-standardized death rate (ASDR) steadily decreased from 1990 to 2017, with estimated annual percentage changes (EAPCs) of -2.39 (95%UI, -8.13-3.71) and -2.74 (95%UI, -9.31-4.31), respectively. The global incidence and mortality of CML in males were higher than that in females. The ASRs varied substantially across regions, with the highest burden in Andean Latin America, Central Sub-Saharan Africa, and Southeast Asia. Besides, the ASRs decreased most obviously in the high-SDI regions compared to non-high-SDI regions. Moreover, the lower the SDI, the higher was the proportion of deaths in the younger age groups.

Conclusion: Despite the decreasing trends of ASRs of CML from 1990 to 2017, the health-related burden of CML remains a challenge for the low-SDI regions. These findings highlight that appropriate strategies should be adopted in low-SDI countries to reduce the ASRs of CML.

Keywords: chronic myeloid leukemia; death; disability-adjusted life-years; epidemiology; incidence.


Conflict of interest statement

The authors declare that the research was conducted in the absence of any commercial or financial relationships that could be construed as a potential conflict of interest.

Figures

Figure 1
Figure 1
Change trends in age-standardized incidence, death and DALY rate by gender in different SDI quintiles from 1990 to 2017. (A) Age-standardized incidence rate; (B) age-standardized death rate; (C) age-standardized DALY rate. SDI, socio-demographic index.
Figure 2
Figure 2
The ratio of male to female by age groups in different SDI quintiles in 2017. (A) Global; (B) high SDI; (C) high-middle SDI; (D) middle SDI; (E) low-middle SDI; (F) low SDI.
Figure 3
Figure 3
Proportion of age groups on incidence and death by region in 1990 and 2017. (A) incidence in 1990; (B) incidence in 2017; (C) death in 1990; (D) death in 2017.
Figure 4
Figure 4
The incidence, death, and DALY rates by gender and age groups in 1990 and 2017. (A) Incidence rate in 1990; (B) death rate in 1990; (C) DALY rate in 1990; (D) incidence rate in 2017; (E) death rate in 2017; (F) DALY rate in 2017.
Figure 5
Figure 5
Map of ASIR and corresponding EAPCs by country in 2017 and their relative change trends from 1990 to 2017. (A) ASIR in 2017. Heat gradient represents ASIR from red (highest) to blue (lowest). Top three and bottom three countries with ASIR were annotated with numbers. (B) EAPCs of ASIR from 1990 to 2017. Heat gradient represents the change trends of EAPCs from red (highest) to blue (lowest). Blue indicates a downward trend and Red indicates an upward trend. Top three and bottom three countries with EAPCs were annotated with numbers.
Figure 6
Figure 6
Map of ASDR and corresponding EAPCs by country in 2017 and their relative change trends from 1990 to 2017. (A) ASDR in 2017. Heat gradient represents ASIR from red (highest) to blue (lowest). Top three and bottom three countries with ASDR were annotated with numbers. (B) EAPCs of ASDR from 1990 to 2017. Heat gradient represents the change trends of EAPCs from red (highest) to blue (lowest). Blue indicates a downward trend and red indicates an upward trend. Top three and bottom three countries with EAPCs were annotated with numbers.
Figure 7
Figure 7
Map of age-standardized DALY rate and corresponding EAPCs by country in 2017 and their relative change trends from 1990 to 2017. (A) Age-standardized DALY rate in 2017. Heat gradient represents age-standardized DALY rate from red (highest) to blue (lowest). Top three and bottom three countries with age-standardized DALY rate were annotated with numbers. (B) EAPCs of age-standardized DALY rate from 1990 to 2017. Heat gradient represents the change trends of EAPCs from red (highest) to blue (lowest). Blue indicates a downward trend and Red indicates an upward trend. Top three and bottom three countries with EAPCs were annotated with numbers.

Similar articles

Cited by

References

    1. Miranda-Filho A, Piñeros M, Ferlay J, Soerjomataram I, Monnereau A, Bray F. Epidemiological patterns of leukaemia in 184 countries: a population-based study. Lancet Haematol (2018) 5(1):e14–24. 10.1016/S2352-3026(17)30232-6 - DOI - PubMed
    1. Apperley JF. Chronic myeloid leukaemia. Lancet (2015) 385(9976):1447–59. 10.1016/S0140-6736(13)62120-0 - DOI - PubMed
    1. Hochhaus A, Larson RA, Guilhot F, Radich JP, Branford S, Hughes TP, et al. Long-Term Outcomes of Imatinib Treatment for Chronic Myeloid Leukemia. N Engl J Med (2017) 376(10):917–27. 10.1056/NEJMoa1609324 - DOI - PMC - PubMed
    1. Huang XL, Cortes J, Kantarjian H. Estimations of the increasing prevalence and plateau prevalence of chronic myeloid leukemia in the era of tyrosine kinase inhibitor therapy. Cancer (2012) 118(12):3123–7. 10.1002/cncr.26679 - DOI - PMC - PubMed
    1. Global Burden of Disease Cancer Collaboration Global, Regional, and National Cancer Incidence,Mortality, Years of Life Lost, Years Lived With Disability, and Disability-Adjusted Life-years for 32 Cancer Groups, 1990 to 2015: A Systematic Analysis for the Global Burden of Disease Study. JAMA Oncol (2017) 3(4):524–48. 10.1001/jamaoncol.2016.5688 - DOI - PMC - PubMed

LinkOut - more resources