. 2020 Dec;2(4):zcaa038.
doi: 10.1093/narcan/zcaa038. Epub 2020 Dec 21.

Dual inhibition of DNA-PK and DNA polymerase theta overcomes radiation resistance induced by p53 deficiency

Affiliations

Dual inhibition of DNA-PK and DNA polymerase theta overcomes radiation resistance induced by p53 deficiency

Rashmi J Kumar et al. NAR Cancer. 2020 Dec.

Abstract

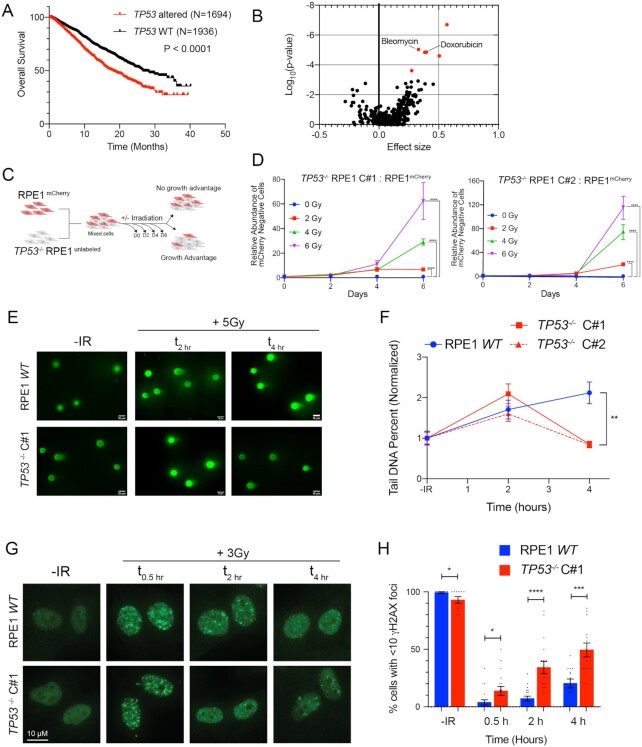
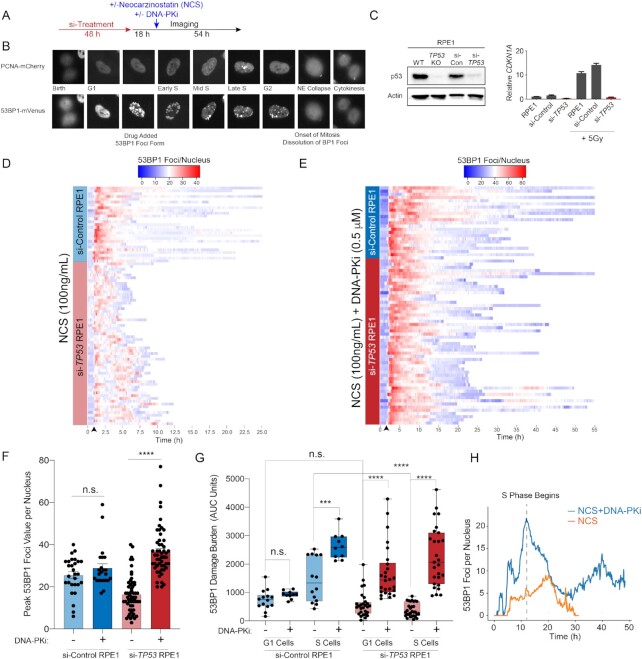
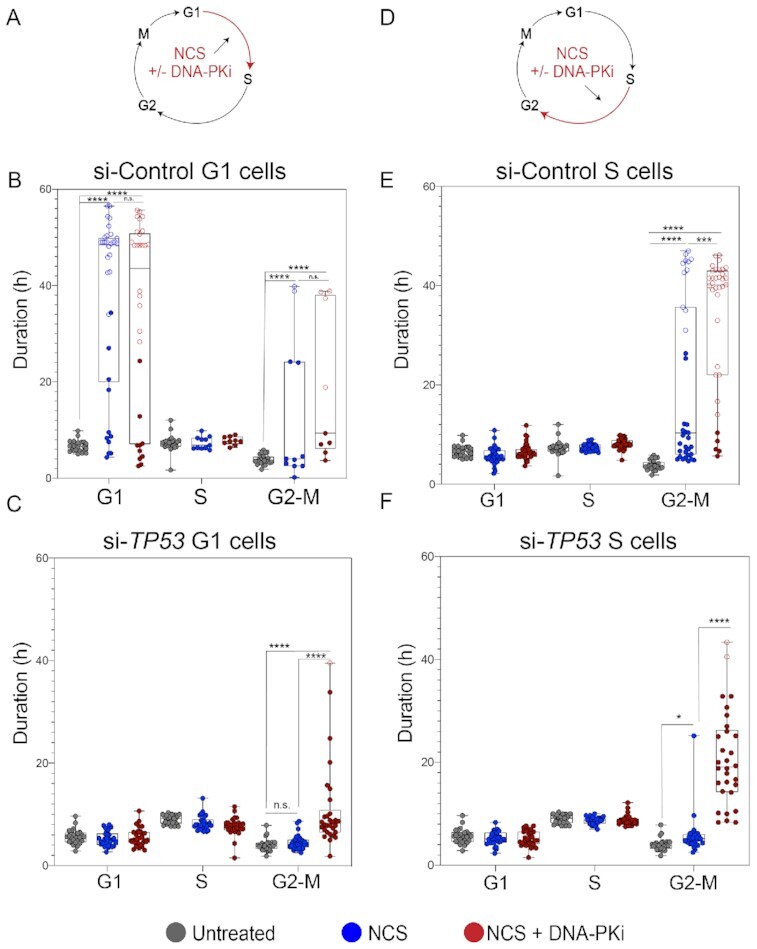
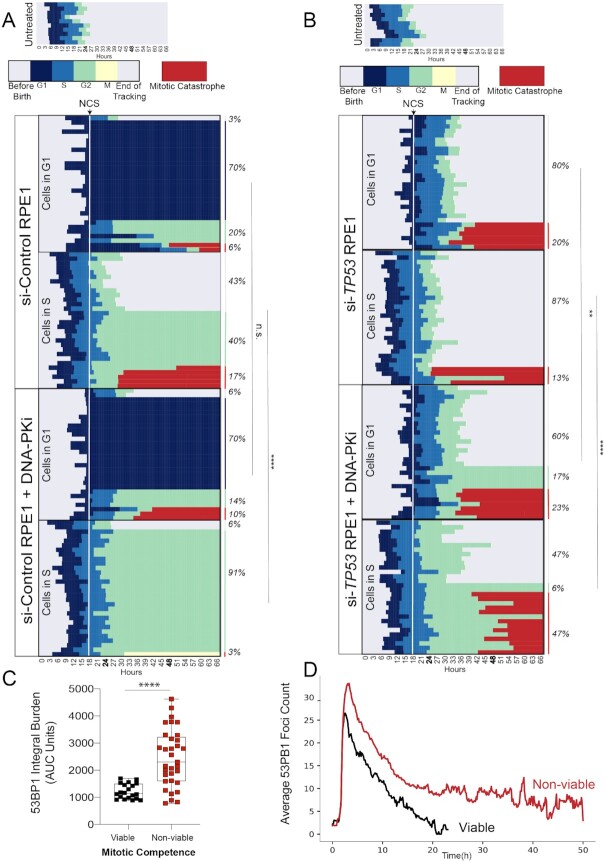
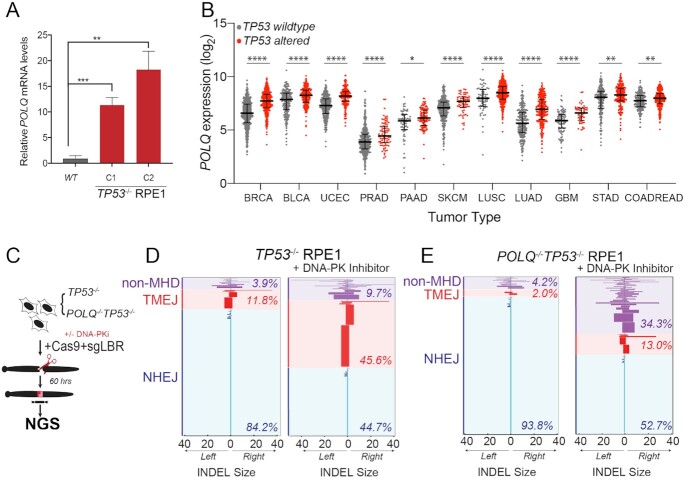
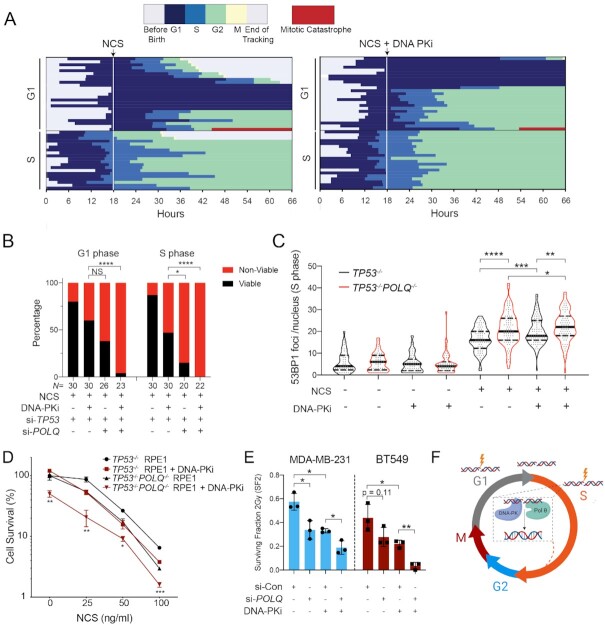
TP53 deficiency in cancer is associated with poor patient outcomes and resistance to DNA damaging therapies. However, the mechanisms underlying treatment resistance in p53-deficient cells remain poorly characterized. Using live cell imaging of DNA double-strand breaks (DSBs) and cell cycle state transitions, we show that p53-deficient cells exhibit accelerated repair of radiomimetic-induced DSBs arising in S phase. Low-dose DNA-dependent protein kinase (DNA-PK) inhibition increases the S-phase DSB burden in p53-deficient cells, resulting in elevated rates of mitotic catastrophe. However, a subset of p53-deficient cells exhibits intrinsic resistance to radiomimetic-induced DSBs despite DNA-PK inhibition. We show that p53-deficient cells under DNA-PK inhibition utilize DNA polymerase theta (Pol θ)-mediated end joining repair to promote their viability in response to therapy-induced DSBs. Pol θ inhibition selectively increases S-phase DSB burden after radiomimetic therapy and promotes prolonged G2 arrest. Dual inhibition of DNA-PK and Pol θ restores radiation sensitivity in p53-deficient cells as well as in p53-mutant breast cancer cell lines. Thus, combination targeting of DNA-PK- and Pol θ-dependent end joining repair represents a promising strategy for overcoming resistance to DNA damaging therapies in p53-deficient cancers.


Figures

Figure 1.
Figure 1.
p53-deficient cells exhibit radioresistance and accelerated resolution of DNA DSBs. (A) Kaplan–Meier overall survival analysis of patients from the MSK-IMPACT pan-cancer cohort, stratified by genetic alterations in the TP53 gene (WT vs. mutations or deep deletions). Data obtained from the cBioportal. P-value calculated using a two-sided log-rank test. (B) Association between TP53 mutation and drug sensitivity from the Genomics of Drug Sensitivity in Cancer database. P-values were calculated using ANOVA and a threshold of P < 10−3 and a false discovery rate threshold of 25% were used to indicate statistically significant associations (labeled in red). (C) Diagram of growth competition assay. mCherry-labeled RPE1 cells were mixed with unlabeled TP53−/− RPE1 (1:1), exposed to IR and grown for 6 days. (D) Relative abundance of unlabeled TP53−/− Clone#1 (left panel) or TP53−/− Clone#2 (right panel) measured by Intellicyte high-throughput cytometry ± standard error of the mean (SEM, n = 6) is shown, normalized to the untreated (0 Gy) cohort at each time point. (E) Representative neutral COMET fluorescence staining for measurement of DNA DSBs in cells with indicated genotypes treated without or with 5 Gy IR evaluated at the indicated time points. (F) Quantification of neutral COMET tail DNA percentage, normalized to the untreated baseline, in RPE1 WT (blue) and two TP53−/− RPE1 cell lines (red). Data shown are mean values (n = 50–150 cells per treatment condition) ± SEM, and are consistent across three independent biological replicates. (G) Representative immunofluorescence images of γH2AX foci in cells with indicated genotypes untreated (no IR) or collected 0.5, 2 and 4 h after IR (3 Gy). (H) Percentage of cells with <10 γH2AX foci at the different time points in RPE1 WT (blue) and TP53/ RPE1 (red). Data shown are mean ± SEM across three independent biological replicates. *P < 0.05, **P < 0.01, ***P < 0.001 and ****P < 0.0001 by two-tailed Student’s t-test.
Figure 2.
Figure 2.
Inhibition of DNA-PK restores DNA damage foci formation in p53-deficient cells. (A) Live cell imaging procedure. Cells transfected twice with 10 nM si-Control or si-TP53 for 48 h prior to imaging. Eighteen hours into imaging, cells are treated with NCS (100 nM), DNA-PKi (0.5 μM NU7441) or both and imaged for a total of 72 h. (B) RPE1 cells expressing the PCNA-mCherry and 53BP1-mVenus reporters. Cell cycle phases delineated by PCNA foci and DNA DSBs are marked by 53BP1 foci. (C) Validation of si-TP53 efficacy by immunoblotting for p53 (left panel) and IR (5 Gy) induced CDKN1A mRNA levels (right panel). (D) Heatmap of 53BP1 foci tracings for single cells tracked from birth to mitosis or end of imaging: for si-Control (n = 30 cells) and si-TP53-treated RPE1 (n = 60 cells) treated with NCS 100 ng/ml. For visualization, cells are aligned to 10 frames prior to drug addition (black arrow). (E) Heatmap of 53BP1 foci tracings for si-Control (n = 25 cells) and si-TP53-treated RPE1 cells (n = 55 cells) treated with 100 ng/ml NCS + 0.5 μM DNA-PKi (NU7441). (F) Peak 53BP1 foci counts for cells treated with 100 ng/ml NCS or NCS + 0.5 μM DNA-PKi. Shown are the mean ± SEM. Significance determined using two-tailed t-test. (G) Area under the curve (AUC) analysis of 53BP1 burden showing integral DNA damage for cells treated with NCS versus NCS and DNA-PKi. Cells are segregated into two groups: cells exposed to drug in G1 versus S phase (n = 25–30 G1 or S cells for si-TP53 cohort; n = 10–15 G1 or S cells for si-Control cohort). Significance determined by two-tailed t-test: ****P < 0.0001, ***P < 0.001 and n.s. = non-significant. (H) Kinetic analysis of 53BP1 foci burden in G1-phase p53-deficient RPE1 upon exposure to NCS without (orange line) or with (blue line) concomitant DNA-PKi (n = 30 cells for each condition). Dashed line = S-phase onset.
Figure 3.
Figure 3.
Checkpoint responses halt p53-proficient cells upon exposure to NCS while p53-deficient cells continue to cell cycle despite NCS exposure. (A) Schematic depicting NCS treatment (100 ng/ml) and/or NCS + 0.5 μM DNA-PKi (NU7441) treatment, and phase of the cell cycle cells exposed to drug (G1). (B) Distribution of cell cycle phase lengths; each colored dot is an individual cell with untreated cells (no NCS) shown in gray, NCS-treated cells shown in blue and NCS + 0.5 μM DNA-PKi-treated cells shown in red for si-Control RPE1 in G1 phase. n = 20 untreated and n = 30 treated cells (for each treatment cohort). Statistical significance was determined by comparing untreated and treated groups at each phase: ****P < 0.0001 and n.s. = non-significant. Open circles indicate arrested cells that did not enter the subsequent phase of cell cycle for remainder of imaging. (C) Distribution of cell cycle phase lengths for si-TP53-treated RPE1 in G1 phase: ****P < 0.0001 and n.s. = non-significant as evaluated by two-tailed t-test. (D) Schematic of drug treatment for cells in S phase. (E) Distribution of cell cycle phase lengths for si-Control treated RPE1 in S phase: ***P < 0.001, ****P < 0.0001 and n.s. = non-significant as evaluated by two-tailed t-test. (F) Distribution of cell cycle phase lengths for si-TP53-treated RPE1 in S phase: ****P < 0.0001 and n.s. = non-significant as evaluated by two-tailed t-test.
Figure 4.
Figure 4.
Inhibition of DNA-PK induces catastrophic mitoses in p53-deficient cells. Horizontal bar plots depicting cell cycle outcomes for si-Control (A) and si-TP53 (B) treated RPE1 cells. Colored bars indicate different phases of the cell cycle; legend shown with no treatment control for comparison. Cells with red bars at the end of mitosis indicate terminal cell cycle event (mitotic catastrophe or apoptosis). The horizontal axis indicates time point during imaging (hours). Individual cells are tracked from birth to completion of mitosis or end of imaging. The upper panels depict cell cycle outcomes for untreated cells. The lower panels depict cells treated with drug (100 ng/ml NCS or 100 ng/ml NCS + 0.5 μM DNA-PKi), with time of drug addition denoted with a white line. Each row is an individual cell (n = 60 cells for each condition). Cells are organized based on cell cycle state at the time of drug addition (G1 versus S), and cell fate outcomes. Event frequency is reported as a percentage on the right. Fisher’s exact two-tailed test was performed between −/+ DNA-PKi cohorts using two outcome groups [viable versus non-viable (arrested cells + mitotic catastrophe outcomes)]: ****P < 0.0001 and n.s. = non-significant. (C) AUC analysis of 53BP1 integral damage burden in viable versus non-viable p53-deficient cells that were treated with NCS and DNA-PKi. Statistical significance was calculated using a two-tailed Mann–Whitney test comparing ranks: ****P < 0.0001. (D) Kinetic analysis of 53BP1 foci burden over time in p53-deficient RPE1 segregated by mitotic viability. The red line corresponds to mean 53BP1 foci burden over time for all p53-deficient cells treated with NCS and DNA-PKi that undergo catastrophic mitoses; black line indicates mean foci burden over time for p53-deficient cells with NCS and DNA-PKi treatment that are viable post-mitosis (n = 20 viable cells and n = 33 non-viable cells).
Figure 5.
Figure 5.
p53-deficient cells utilize alternative end joining pathways in the absence of active DNA-PK. (A) RT-qPCR for POLQ mRNA levels in two TP53−/− RPE1 clones compared to WT RPE1. Significance was determined using two-tailed t-test: ****P < 0.0001 and **P < 0.01. (B) POLQ gene expression depicted as log2 values of TP53 wild-type versus mutant cancers across a subset of TCGA tumor types. Tumor labels follow TCGA labeling format. BRCA: breast cancer; BLCA: B-cell lymphoma; UCEC: uterine cancer; PRAD: prostate cancer; PAAD: pancreatic cancer; SKCM: melanoma; LUSC: lung squamous cell cancer; LUAD: lung adenocarcinoma; GBM: glioblastoma multiforme; STAD: stomach cancer; COADREAD: colorectal cancer. ****P < 0.0001, ***P < 0.001, **P < 0.01 and *P < 0.05, as calculated by one-way ANOVA. (C) Schematic depicting chromosomal break repair assay. TP53−/− and POLQ/TP53−/− RPE1 are segregated into two cohorts (±3 μM DNA-PKi). Cells are electroporated using Cas9-RNP-sgRNA-LBR and evaluated by amplicon next-generation sequencing (NGS) for break repair products at target locus. (D) Horizontal bar chart representation of individual break repair products at LBR locus in (D) TP53−/− RPE1 and (E) TP53/POLQ/ RPE1 by NGS. Position 0 denotes LBR locus cut site, with left and right positions denoting final INDEL size and orientation. Data shown represent an average of three biological replicates.
Figure 6.
Figure 6.
Pol θ promotes resistance to radiomimetic therapy in p53-deficient cells by suppressing S-phase DSBs. (A) Horizontal bar plots depicting cell cycle outcomes for si-TP53 + POLQ RPE1 cells treated with 100 ng/ml NCS (left panel) or 100 ng/ml NCS plus 0.5 μM DNA-PKi (NU7441) (right panel). Each row represents an individual cell, and the cells are organized according to cell cycle state at the time of drug addition (G1 versus S). (B) Analysis of cell fate outcomes categorized as viable (i.e. successful completion of mitosis) versus non-viable (arrest or mitotic catastrophe). Fisher’s exact two-tailed test: *P < 0.05 and ****P < 0.0001. (C) Violin plots of 53BP1 foci counts per nucleus in TP53/ (black) and TP53/POLQ/ (red) RPE1 cells, 4 h after treatment with 100 ng/ml NCS with or without 0.5 μM DNA-PKi. Data shown are for S-phase cells, which were identified by a 30-min EdU pulse at the time of drug addition. The violin plots show the median (solid black line) and quartiles (dashed lines). Statistical significance assessed with Student’s two-tailed t-test: ***P < 0.001 and ****P < 0.0001. (D) Colony forming efficiency assay evaluating TP53−/− and POLQ/TP53−/− RPE1 after treatment with NCS (at 25, 50 and 100 ng/ml) with or without 0.5 μM DNA-PKi. Cell survival is normalized to the untreated control for each genotype, and the bar graph depicts mean ± SEM (n = 3). Statistical significance of TP53/ versus TP53/POLQ/ genotypes assessed with Student’s two-tailed t-test: ***P < 0.001, **P < 0.01 and *P < 0.05. (E) Surviving fraction after 2 Gy IR as determined by the colony forming assay in MDA-MB-231 (left) and BT-549 (right) TP53-mutant breast cancer cell line models. Cells were pretreated with si-Control or si-POLQ for 48 h prior to irradiation without or with DNA-PKi (0.5 μM NU7441). Statistical significance assessed with Student’s two-tailed t-test: *P < 0.05 and **P < 0.01. (F) DNA-PK and Pol θ independently promote repair of therapy-induced S-phase DNA DSBs, which promotes therapeutic resistance in p53-deficient cells.

References

    1. Nigro J.M., Baker S.J., Preisinger A.C., Jessup J.M., Hostetter R., Cleary K., Bigner S.H., Davidson N., Baylin S., Devilee P. et al. . Mutations in the p53 gene occur in diverse human tumour types. Nature. 1989; 342:705–708. - PubMed
    1. Hafner A., Bulyk M.L., Jambhekar A., Lahav G. The multiple mechanisms that regulate p53 activity and cell fate. Nat. Rev. Mol. Cell Biol. 2019; 20:199–210. - PubMed
    1. Kastenhuber E.R., Lowe S.W. Putting p53 in context. Cell. 2017; 170:1062–1078. - PMC - PubMed
    1. Donehower L.A., Soussi T., Korkut A., Liu Y., Schultz A., Cardenas M., Li X., Babur O., Hsu T.K., Lichtarge O. et al. . Integrated analysis of TP53 gene and pathway alterations in the cancer genome atlas. Cell Rep. 2019; 28:1370–1384. - PMC - PubMed
    1. Miller L.D., Smeds J., George J., Vega V.B., Vergara L., Ploner A., Pawitan Y., Hall P., Klaar S., Liu E.T. et al. . An expression signature for p53 status in human breast cancer predicts mutation status, transcriptional effects, and patient survival. Proc. Natl Acad. Sci. U.S.A. 2005; 102:13550–13555. - PMC - PubMed