. 2021 Feb;141(2):193-215.
doi: 10.1007/s00401-020-02253-4. Epub 2021 Jan 1.

In vitro amplification of pathogenic tau conserves disease-specific bioactive characteristics

Affiliations

In vitro amplification of pathogenic tau conserves disease-specific bioactive characteristics

Hong Xu et al. Acta Neuropathol. 2021 Feb.

Abstract

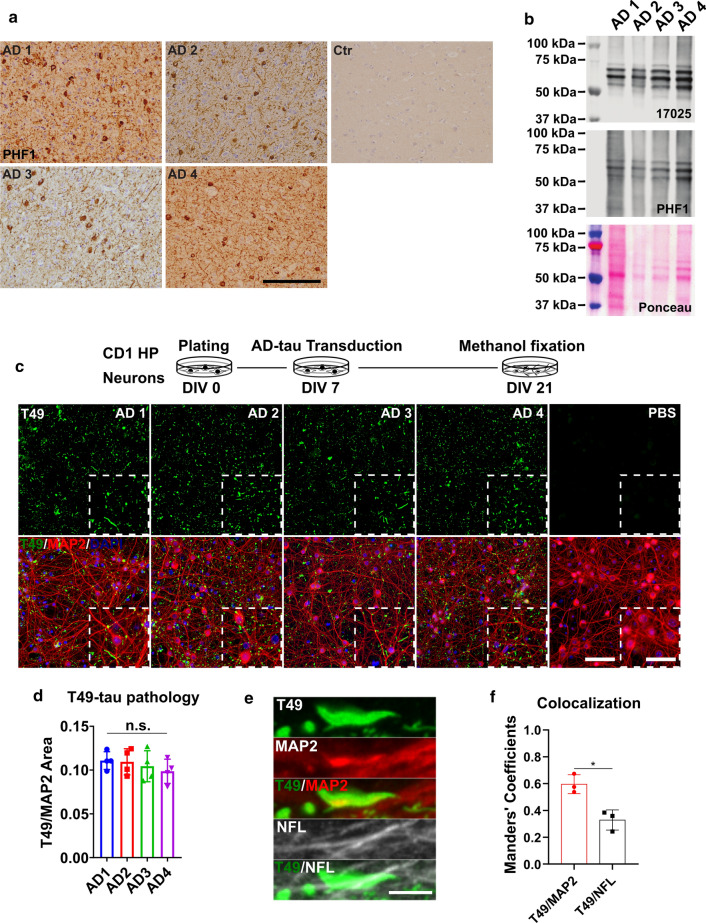
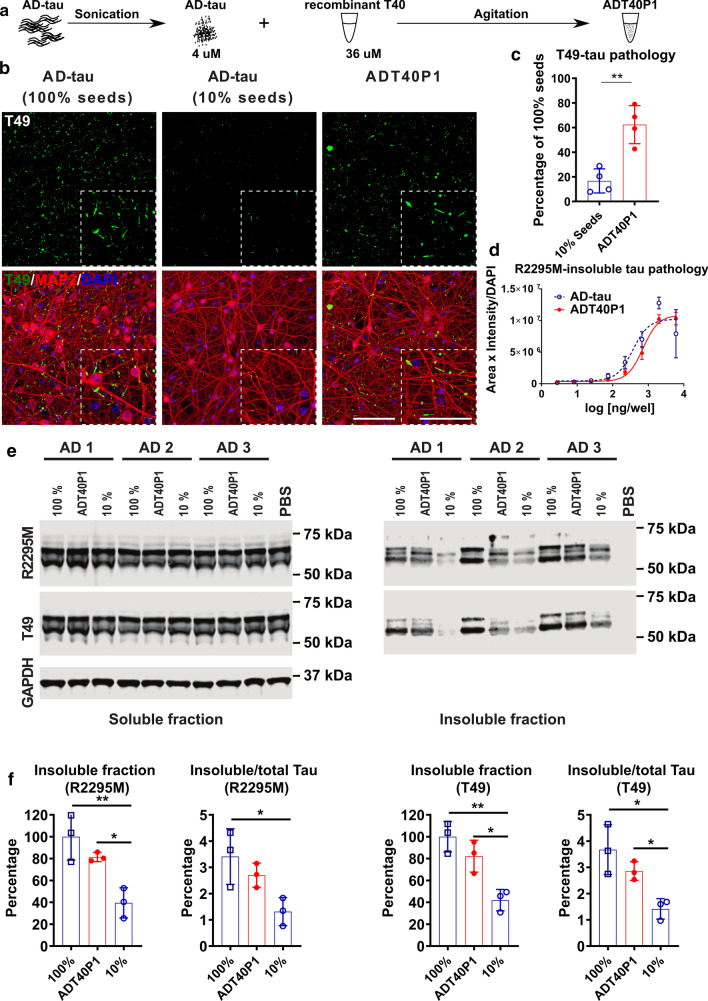
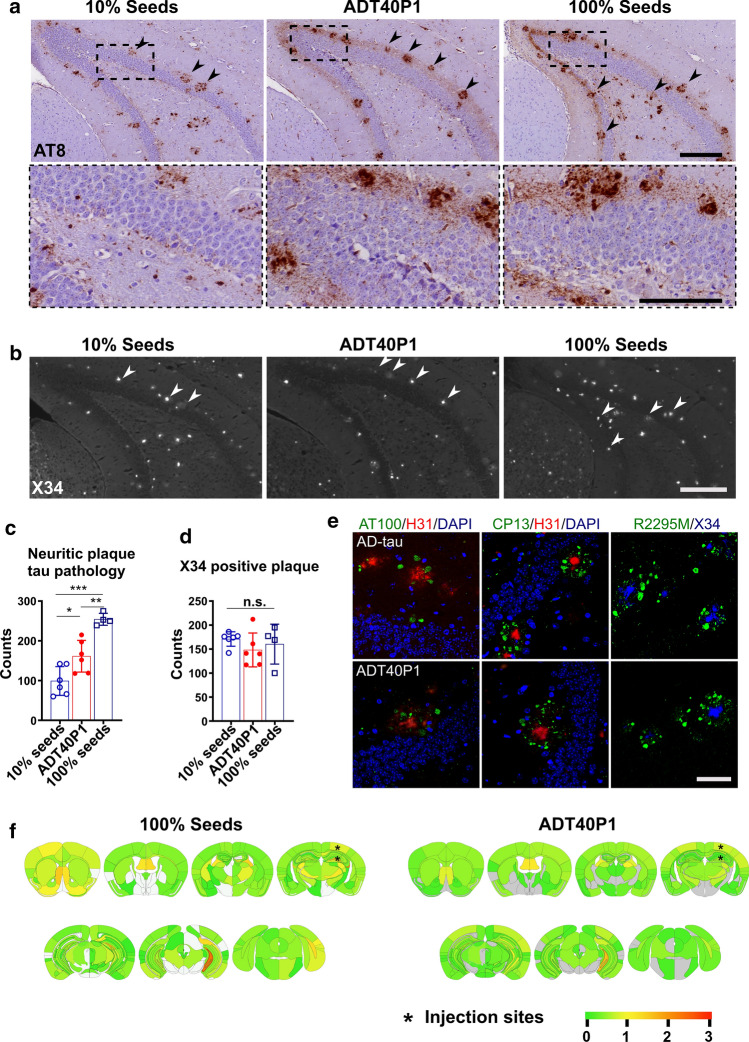
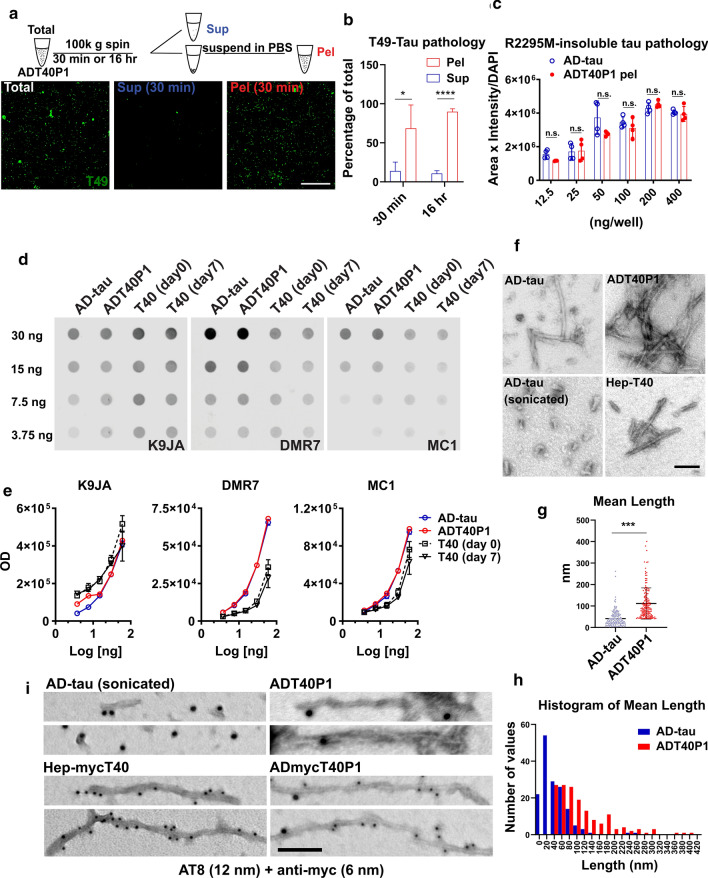
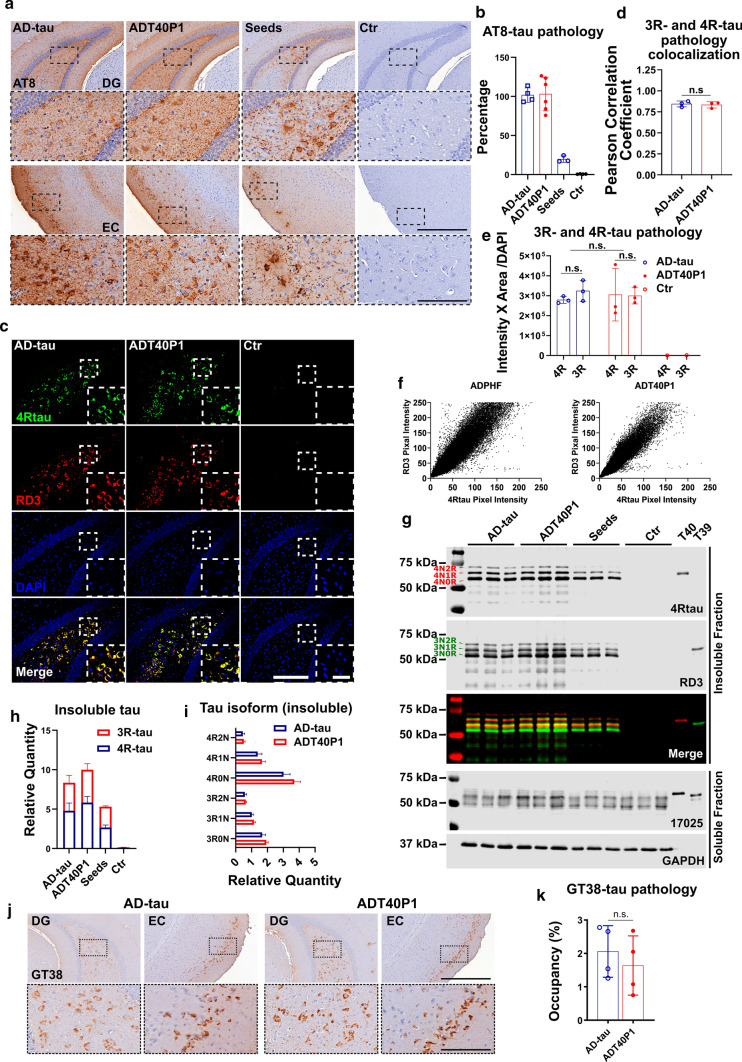
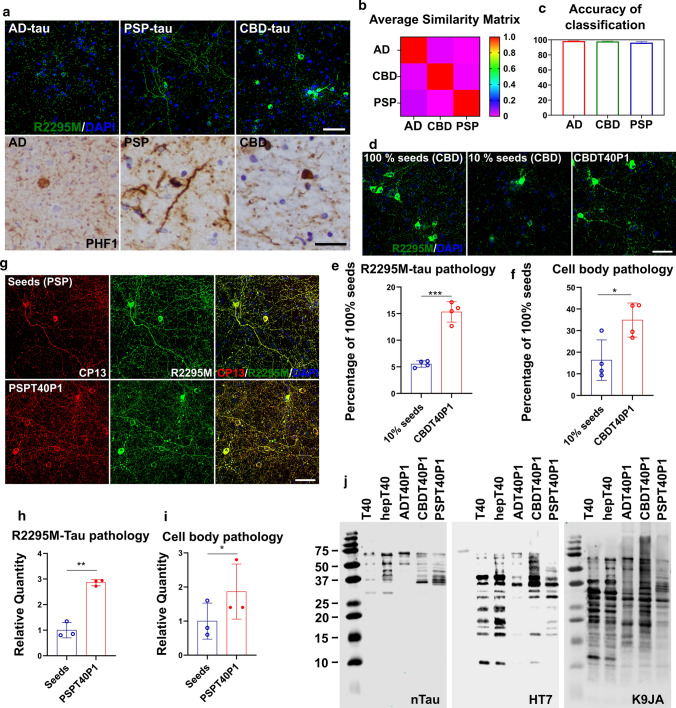
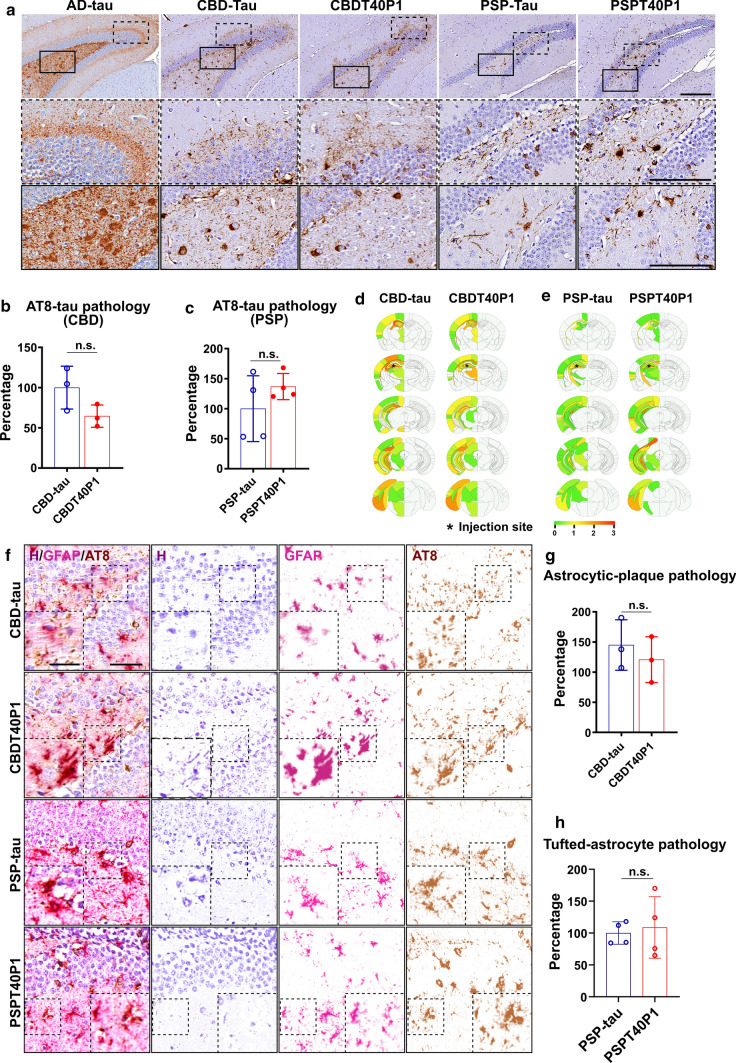
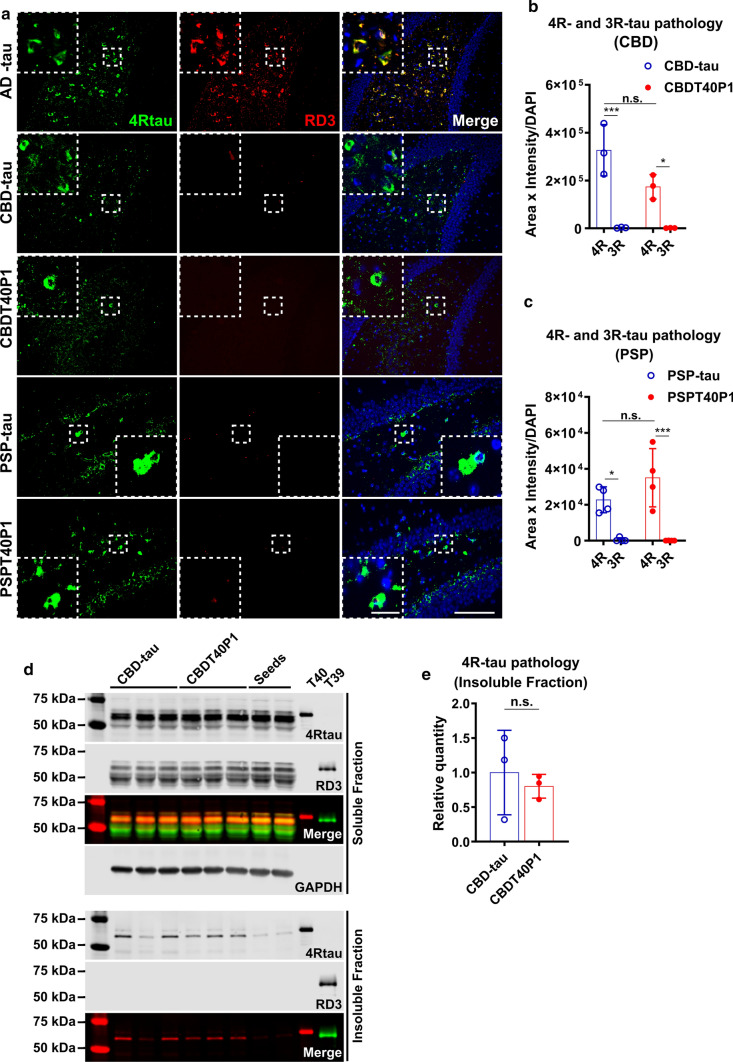
The microtubule-associated protein tau (tau) forms hyperphosphorylated aggregates in the brains of tauopathy patients that can be pathologically and biochemically defined as distinct tau strains. Recent studies show that these tau strains exhibit strain-specific biological activities, also referred to as pathogenicities, in the tau spreading models. Currently, the specific pathogenicity of human-derived tau strains cannot be fully recapitulated by synthetic tau preformed fibrils (pffs), which are generated from recombinant tau protein. Reproducing disease-relevant tau pathology in cell and animal models necessitates the use of human brain-derived tau seeds. However, the availability of human-derived tau is extremely limited. Generation of tau variants that can mimic the pathogenicity of human-derived tau seeds would significantly extend the scale of experimental design within the field of tauopathy research. Previous studies have demonstrated that in vitro seeding reactions can amplify the beta-sheet structure of tau protein from a minute quantity of human-derived tau. However, whether the strain-specific pathogenicities of the original, human-derived tau seeds are conserved in the amplified tau strains has yet to be experimentally validated. Here, we used biochemically enriched brain-derived tau seeds from Alzheimer's disease (AD), corticobasal degeneration (CBD) and progressive supranuclear palsy (PSP) patient brains with a modified seeding protocol to template the recruitment of recombinant 2N4R (T40) tau in vitro. We quantitatively interrogated efficacy of the amplification reactions and the pathogenic fidelity of the amplified material to the original tau seeds using recently developed sporadic tau spreading models. Our data suggest that different tau strains can be faithfully amplified in vitro from tau isolated from different tauopathy brains and that the amplified tau variants retain their strain-dependent pathogenic characteristics.

Keywords: in vitro seeding; tau spreading; tau strains; tauopathy.


Figures

Fig. 1
Fig. 1
Insoluble tau from different AD cases exhibits consistent seeding abilities in WT mouse primary neurons. a Immunohistochemistry (IHC) of frontal cortex sections from different AD patient brains and non-tau pathology control using the PHF1 anti-phosphorylated-tau antibody; scale bar = 500 µm. b Immunoblot of sarkosyl-insoluble AD-tau probed with a total tau (17,025) and a phospho-tau (PHF1) antibody; ponceau staining shows total protein in the samples. c Immunocytochemistry (ICC) of AD-tau-induced mouse tau pathology in CD1 mouse primary hippocampal neuron cultures revealed by a mouse tau-specific antibody (T49) with concomitant staining of cell nuclei (DAPI) and neuronal dendrites (MAP2 antibody); scale bar = 100 µm and 25 µm (inset). The schematic diagram shows the experimental paradigm for the neuron culture-based activity assay. d Quantification of T49-mouse tau pathology from c. T49-postive area was normalized to the MAP2 positive area; n.s. nonsignificant for all groups; one-way ANOVA followed by Tukey post hoc test; n = 4. e Representative images of T49-positive tau pathology shows the relative location of AD-tau induced mouse tau pathology in dendrites (MAP2) and axons (NFL); scale bar = 5 µm. f Colocalization of T49/MAP2 and T49/NFL from e; n = 3
Fig. 2
Fig. 2
ADT40P1 exhibited pathogenicity in WT neuron culture. a Schematic representation of the steps necessary to generate ADT40P1. b ICC of AD-tau or ADT40P1-induced mouse tau pathology visualized using a mouse tau-specific antibody (R2295M) on WT mouse neuron cultures; 100% seeds represents the maximum amount of pathology induced by ADT40P1 if 100% of T40 is fibrillized during amplification; 10% seeds represents the minimum amount of pathology induced by the seeds alone if no T40 is fibrillized during amplification; scale bar = 100 µm and 25 µm (inset). c Quantification of T49-positive tau pathology from b; T49-positive area was normalized to MAP2 area; pathological % of tau seeding activity was set as 100%; **P < 0.01 unpaired t test; n = 4. d Dose–response curve of ADT40P1- and AD-tau-induced mouse tau pathology in WT neuron cultures visualized using a mouse tau-specific antibody (R2295M); R2295M area was multiplied by intensity and then normalized to DAPI counts; EC50: AD-tau = 368.4; ADT40P1 = 714.1; n = 4. e Immunoblots of soluble and insoluble tau fractions extracted from the WT neurons treated with ADT40P1, 100% AD-tau seeds, or 10% AD-tau seeds. Blots were probed with two mouse tau-specific antibodies (T49 and R2295M), while GAPDH was used as an internal loading control. f Optical density quantification of e; normalized to 100% AD-tau control; *P < 0.05, **P < 0.01, one-way ANOVA followed by Tukey post hoc test; n = 3
Fig. 3
Fig. 3
ADT40P1 is pathogenic in vivo. a IHC of 6-month-old 5xFAD mouse brain sections. Mice injected with the same concentration of tau for 100% seeds control (100% AD-tau), 10% seeds control (10% AD-tau + 90% T40, no agitation) and ADT40P1. Mice were killed at 1-month post-injection and brains were probed with the AT8 antibody for phospho-tau; upper panel scale bar = 200 µm; low panel scale bar = 100 µm; arrow heads show amyloid-beta plaque adjacent to neuritic plaque tau pathology. b X34 staining of sections adjacent to those in a; arrow heads show neuritic plaque tau pathology associated amyloid-beta plaques in stained by the amyloid histochemical dye X34; scale bar = 200 µm. c Quantification of AT8 tau pathology from a; *P < 0.05 10% seeds vs ADT40P1, **P < 0.01 ADT40P1 vs 100% seeds, ***P < 0.001 100% seeds vs 10% seeds, one-way ANOVA followed by Tukey post hoc test; n = 6 for 10% seeds and ADT40P1 groups, n = 4 for 100% seeds control. d Quantification of X34-positive amyloid-beta plaques from b; n.s. nonsignificant, one-way ANOVA followed by Tukey post hoc test; n = 6 for 10% seeds and ADT40P1 groups, n = 4 for 100% seeds control. e Immunofluorescence staining (IF) of neuritic plaque tau pathology visualized using phosphor-tau (AT100/CP13) and mouse tau antibodies (R2295M) together with anti-amyloid beta (1–42) H31L21 antibody and X34 dye; scale bar = 50 µm. f Heat map of AT8-positive pathology distribution from a; 100% AD seeds vs ADT40P1. Gray represents no pathology. Low to high tau pathology score is represented as a gradient of green to red hues
Fig. 4
Fig. 4
ADT40P1 shares biochemical features with AD-tau. a IHC of WT neurons treated with biochemically separated soluble and insoluble ADT40P1; mouse tau pathology was visualized using T49 antibody; sup = supernatant, pel = pellet; scale bar = 100 µm. b Quantification of T49 tau pathology from a; T49-positive area was normalized to MAP2 area; total ADT40P1 activity level was set as 100%; *P < 0.05, ***P < 0.001, unpaired t test; n = 4. c Quantification of R2295M-positive tau pathology induced by AD-tau and pellet fraction of ADT40P1 at 6 different doses in neuron culture model; R2295M-positive area was normalized to MAP2 area; n.s. nonsignificant; two-way ANOVA followed by Tukey post hoc test; n = 4. d Dot blot of ADT40P1 and controls probed for total tau (K9JA pAb) and pathological the conformation of tau (DMR7 and MC1 antibodies). e Optical density quantification of d; n = 4. f Transmission EM of AD-tau (before and after sonication)-, ADT40P1- and heparin-induced tau pffs (hep-T40); scale bar = 100 nm. g Quantification of the length of filaments from f; ***P < 0.001, unpaired t test; n = 156. h Histogram of length of filaments shown in g. i Immuno-EM of ADT40P1, AD-tau, ADmycT40P1 (AD-tau seeded myc-T40), and hep-mycT40 (heparin-induced mycT40 pffs) using AT8 (12 nm colloidal gold beads) and anti-myc (6 nm colloidal gold beads) antibodies; scale bar = 50 nm
Fig. 5
Fig. 5
ADT40P1 and AD-tau recruit 3R and 4R tau isoforms in vivo. a IHC of 6hTau mouse brains injected with AD-tau or ADT40P1 at 3-month post-injection; Seed controls were used to demonstrate the amount of tau pathology induced by AD-tau in the ADT40P1 reaction mixture; controls (Ctr) show noninjected age-matched 6hTau mice; AT8 was used to visualize hypophosphorylated tau aggregates; representative images show the ipsilateral dentate gyrus (DG) and entorhinal cortex (EC); Scale bar = 500 µm and 125 µm (inset). b Quantification of AT8 tau pathology from a; AD-tau was set as 100%; n.s. nonsignificant AD-tau vs ADT40P1; one-way ANOVA followed by Tukey post hoc test; n ≥ 3. c IF of sections of 6hTau mouse brains injected with AD-tau or ADT40P1 in the hippocampus at 3-month post-injection time; Brain sections were costained for 3R- (RD3) and 4R-tau (4Rtau) isoforms; Scale bar = 200 µm and 50 µm (inset). d Colocalization of 3R- and 4R-tau immunoreactivity from c; n.s. nonsignificant; unpaired t test; n = 3. e Quantification of 3R- and 4R-tau pathology from c; n.s. nonsignificant; two-way ANOVA followed by Tukey post hoc test; n = 3. f Scatter plot of 3R- and 4R-tau positive signals from c. g Immunoblots of Triton-soluble and sarkosyl-insoluble fractions of ADT40P1- and AD-tau-injected 6hTau mouse brains; blots were probed with RD3 and 4Rtau antibodies for tau isoforms, K9JA probed for total tau, and GAPDH was used as an internal control for loading error; T39 = recombinant 2N3R tau. h Quantification of insoluble 3R- and 4R tau from g; n = 3. l Quantification of each isoform of tau from g; n = 3. j IHC of 6hTau mouse brains injected with AD-tau or ADT40P1 at 3-month post-injection; AD-tau pathology was visualized by the conformational antibody GT38. k Quantification of GT38-positive tau pathology from j; n = 4; n.s. nonsignificant AD-tau vs ADT40P1; unpaired t test
Fig. 6
Fig. 6
Fidelity of in vitro amplification is maintained among different tau strains. a Upper panel: ICC of AD-tau-, CBD-tau- or PSP-tau-treated WT mouse neurons reveals distinct patterns of mouse tau pathology visualized using a mouse tau-specific antibody (R2295M); scale bar = 50 µm; lower panel: IHC of AD, CBD, PSP patient brain sections stained with PHF1 anti-phospho-tau antibody; Scale bar = 50 µm. b The average similarity matrix generated by WND-CHARM software based on morphological patterns of mouse tau pathology induced by AD-tau, CBD-tau, PSP-tau in WT neurons. c The accuracy of pretrained WND-CHARM software in the differentiation of mouse tau pathology induced by AD-tau, CB-tau, and PSP-tau in WT mouse neurons. d ICC of neurons treated with CBD-tau seeded T40 (CBDT40P1) and controls; Scale bar = 50 µm. e Quantification of R2295M-tau pathology in d; ***P < 0.001; unpaired t test; n = 4. f Cell body pathology count of d; *P < 0.05; unpaired t test; n = 4. g ICC of neurons treated with PSP-tau seeded T40 (PSPT40P1) and controls; Scale bar = 50 µm. h Quantification of R2295M-tau pathology in g; **P < 0.01; unpaired t test; n = 3. i Cell body tau pathology count in g; *P < 0.01; unpaired t test; n = 3. j Immunoblots of proteinase K digestion products of ADT40P1, CBDT40P1, and PSPT40P1 with a C-terminal Tau antibody (K9JA), proline-rich domain tau antibody (HT7) and N-terminal Tau antibody (nTau)
Fig. 7
Fig. 7
CBD and PSP strain pathogenicities are recapitulated in vivo. a IHC of AD-tau, CBD-tau, CBDT40P1, PSP-tau, and PSPT40P1-injected 6htau mouse brain sections show NFTs and astrocytic tau pathologies visualized using the AT8 antibody; Scale bar = 250 µm and 125 µm (inset). b Quantification of total tau pathology from CBD-tau- and CBDT40P1-inculated 6htau mouse in a; n.s. nonsignificant; unpaired t test; n = 3. c Quantification of total tau pathology from PSP-tau- and PSPT40P1-inculated 6htau mouse in a; n.s. nonsignificant; unpaired t test; n = 4. d Heat map shows the distribution of total tau pathology in the CBD-tau- and CBDT40P-injected 6hTau mouse brains; n = 3. e Heat map shows the distribution of total tau pathology in the PSP-tau- and PSPT40P1-injected 6hTau mouse brains; n = 4. f Double-IHC of CBD-tau, CBDT40P1, PSP-tau, and PSPT40P1-injected 6htau mouse brain reveals astrocytic plaques (AT8) and astrocytes (GFAP) in the CBD-tau- and CBDT40P1-injected 6hTau mouse brains; brain sections were costained with an anti-GFAP antibody, anti-phospho-tau antibody (AT8) and hematoxylin (H); colors were deconvoluted to show their relative distributions; insets highlight astrocytic plaques and tufted astrocytes; scale bar = 100 µm and 50 µm (inset). g Quantification of astrocytic-plaque pathology in CBD-tau- and CBDT40P1-injected 6htau mouse brains; n.s. nonsignificant; unpaired t test; n = 3. h Quantification of tufted astrocyte pathology in PSP-tau- and PSPT40P1-injected 6htau mouse brains; n.s. nonsignificant; unpaired t test; n = 4
Fig. 8
Fig. 8
Strain-dependent isoform recruitment abilities are conserved in CBDT40P1 and PSPT40P1. a IF of AD-tau-, CBD-tau-, CBDT40P1-, PSP-, and PSPT40P1-injected 6hTau mouse brain sections costained with 4RTau antibody for 4R-tau and RD3 antibodies for 3R-tau; Scale bar = 100 µm and 20 µm (inset). b Quantification of 4R and 3R-tau pathology from CBD- and CBDT40P1-injected 6hTau mouse brain sections; *P < 0.05, ***P < 0.001; two-way ANOVA followed by Tukey post hoc test; n = 3. c Quantification of 4R and 3R-tau pathology from PSP- and PSPT40P1-injected 6hTau mouse brain sections; *P < 0.05, ***P < 0.001; two-way ANOVA followed by Tukey post hoc test; n = 4. d Immunoblots of Triton-soluble and sarkosyl-insoluble fractions of CBD-tau- and CBDT40P1-injected 6hTau mouse brains; Blots were probed with RD3 and 4Rtau antibodies for tau isoforms, and GAPDH was used as an internal loading control; e quantification of d; n.s. nonsignificant; unpaired t test; n = 3.

References

    1. Biancalana M, Koide S. Molecular mechanism of Thioflavin-T binding to amyloid fibrils. Biochim Biophys Acta. 2010;1804:1405–1412. doi: 10.1016/j.bbapap.2010.04.001. - DOI - PMC - PubMed
    1. Dixit R, Ross JL, Goldman YE, Holzbaur EL. Differential regulation of dynein and kinesin motor proteins by tau. Science. 2008;319:1086–1089. doi: 10.1126/science.1152993. - DOI - PMC - PubMed
    1. Falcon B, Zhang W, Murzin AG, Murshudov G, Garringer HJ, Vidal R, et al. Structures of filaments from Pick's disease reveal a novel tau protein fold. Nature. 2018;561:137–140. doi: 10.1038/s41586-018-0454-y. - DOI - PMC - PubMed
    1. Falcon B, Zivanov J, Zhang W, Murzin AG, Garringer HJ, Vidal R, et al. Novel tau filament fold in chronic traumatic encephalopathy encloses hydrophobic molecules. Nature. 2019;568:420–423. doi: 10.1038/s41586-019-1026-5. - DOI - PMC - PubMed
    1. Fichou Y, Lin Y, Rauch JN, Vigers M, Zeng Z, Srivastava M, et al. Cofactors are essential constituents of stable and seeding-active tau fibrils. Proc Natl Acad Sci USA. 2018;115:13234–13239. doi: 10.1073/pnas.1810058115. - DOI - PMC - PubMed

Publication types

LinkOut - more resources