

Toward a unified analysis of cerebellum maturation and aging across the entire lifespan: A MRI analysis
- PMID: 33385303
- PMCID: PMC7927303
- DOI: 10.1002/hbm.25293
Toward a unified analysis of cerebellum maturation and aging across the entire lifespan: A MRI analysis
Abstract
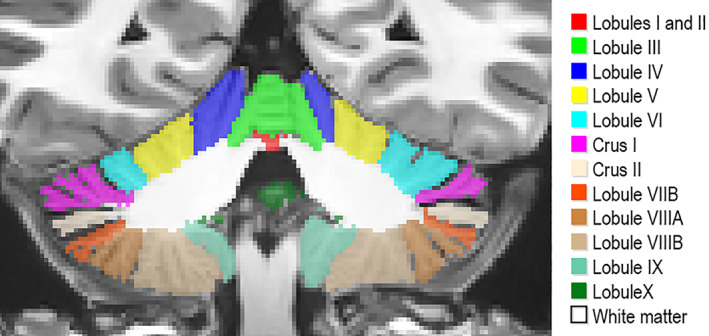
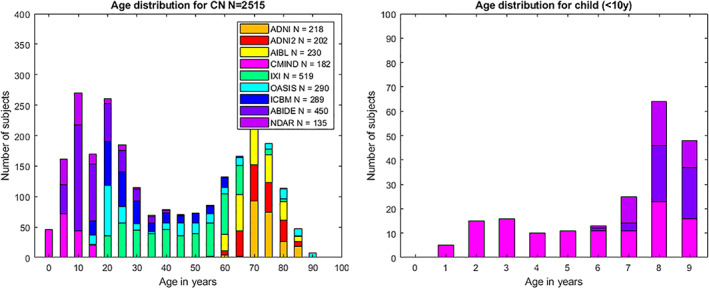
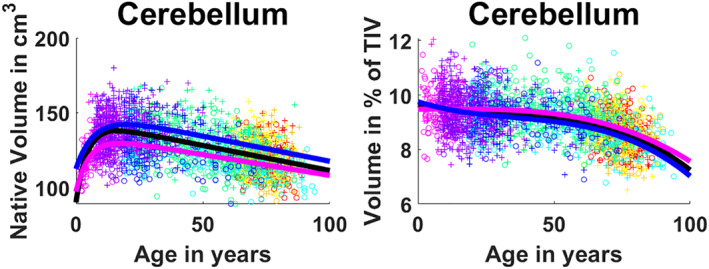
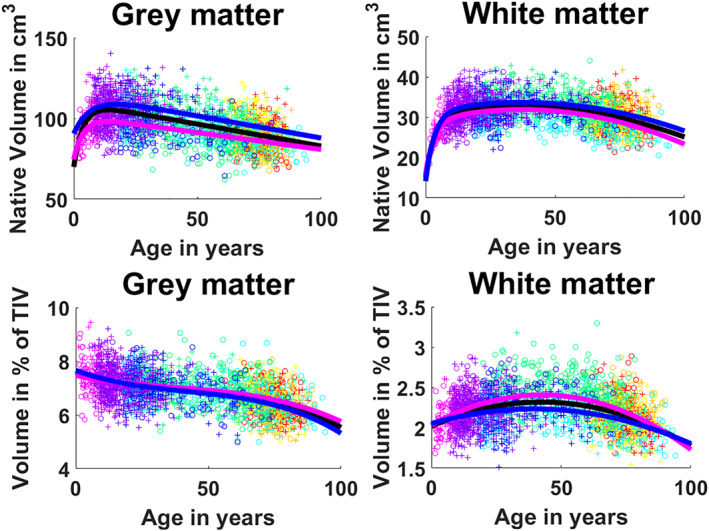
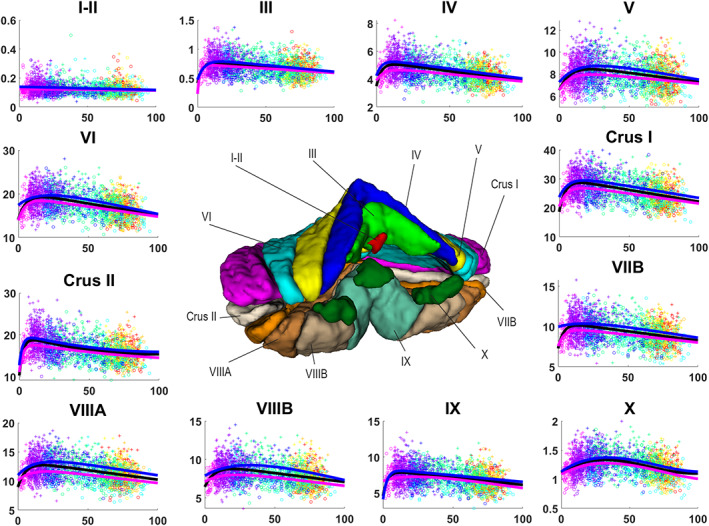
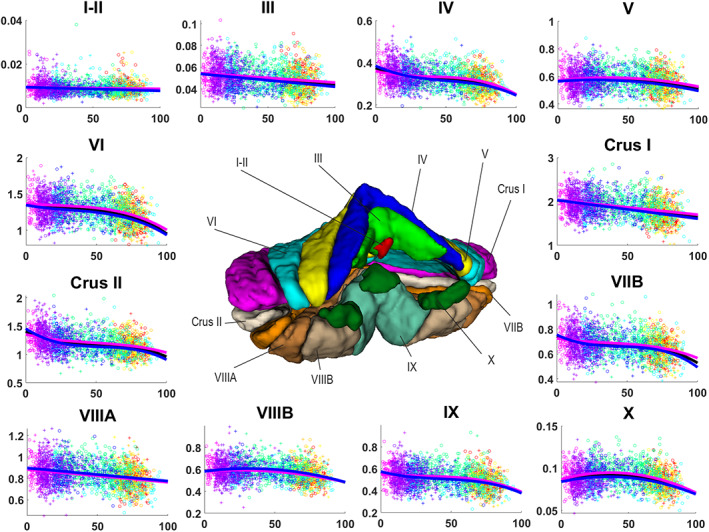
Previous literature about the structural characterization of the human cerebellum is related to the context of a specific pathology or focused in a restricted age range. In fact, studies about the cerebellum maturation across the lifespan are scarce and most of them considered the cerebellum as a whole without investigating each lobule. This lack of study can be explained by the lack of both accurate segmentation methods and data availability. Fortunately, during the last years, several cerebellum segmentation methods have been developed and many databases comprising subjects of different ages have been made publically available. This fact opens an opportunity window to obtain a more extensive analysis of the cerebellum maturation and aging. In this study, we have used a recent state-of-the-art cerebellum segmentation method called CERES and a large data set (N = 2,831 images) from healthy controls covering the entire lifespan to provide a model for 12 cerebellum structures (i.e., lobules I-II, III, IV, VI, Crus I, Crus II, VIIB, VIIIA, VIIIB, IX, and X). We found that lobules have generally an evolution that follows a trajectory composed by a fast growth and a slow degeneration having sometimes a plateau for absolute volumes, and a decreasing tendency (faster in early ages) for normalized volumes. Special consideration is dedicated to Crus II, where slow degeneration appears to stabilize in elder ages for absolute volumes, and to lobule X, which does not present any fast growth during childhood in absolute volumes and shows a slow growth for normalized volumes.
Keywords: MRI segmentation; aging; cerebellum trajectory; lifespan; maturation; patch-based processing.
© 2020 The Authors. Human Brain Mapping published by Wiley Periodicals LLC.
Figures
References
-
- Asman, A. J. and Landman, B. A. (2012). Muti‐atlas segmentation using non‐local STAPLE. MICCAI Workshop on Multi‐Atlas Lebling, 87–90.
-
- Avants, B. B. , Tustison, N. , & Song, G. (2009). Advanced normalization tools (ANTS). Insight Journal.
-
- Balsters, J. H. , Whelan, C. D. , Robertson, I. H. , & Ramnani, N. (2013). Cerebellum and cognition: Evidence for the encoding of higher order rules. Cerebral Cortex, 23(6), 1433–1443. - PubMed
-
- Barnes, C. , Shechtman, E. , Finkelstein, A. , & Goldman, D. B. (2009). PatchMatch: A randomized correspondence algorithm for structural image editing. ACM Transactions on Graphics, 28(3), 1–11.
Publication types
MeSH terms
LinkOut - more resources
Full Text Sources
Other Literature Sources
Medical
