. 2021 Jan 11;39(1):54-67.e9.
doi: 10.1016/j.ccell.2020.12.001. Epub 2020 Dec 31.

Integrin αvβ6-TGFβ-SOX4 Pathway Drives Immune Evasion in Triple-Negative Breast Cancer

Affiliations

Integrin αvβ6-TGFβ-SOX4 Pathway Drives Immune Evasion in Triple-Negative Breast Cancer

Archis Bagati et al. Cancer Cell. .

Abstract

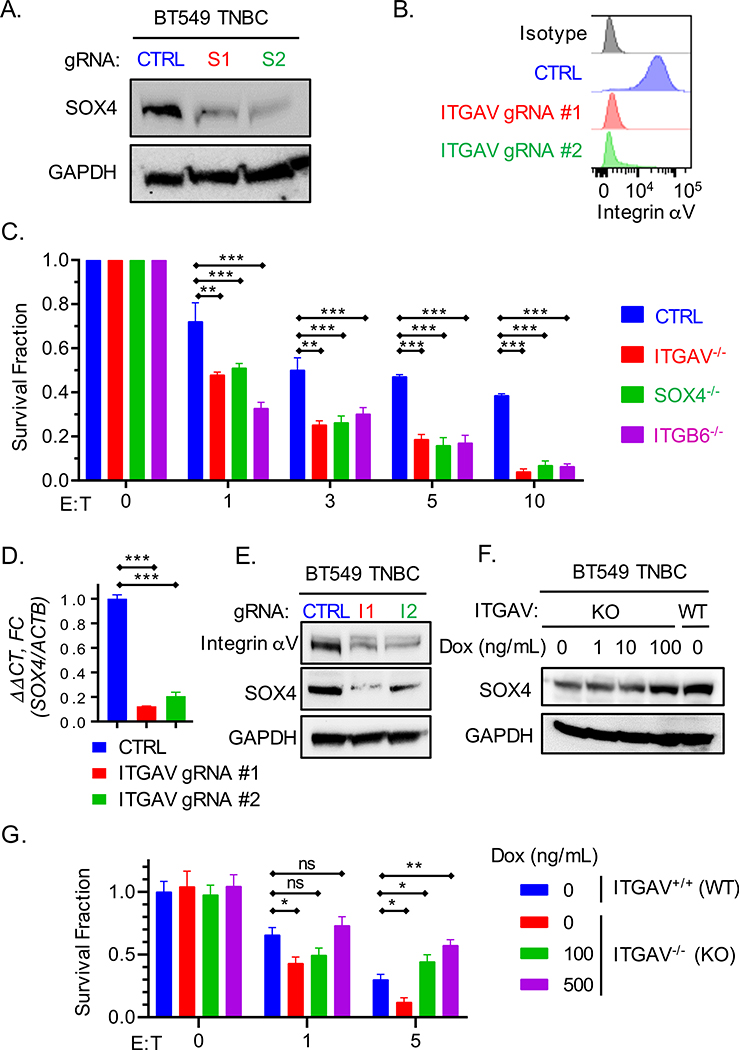
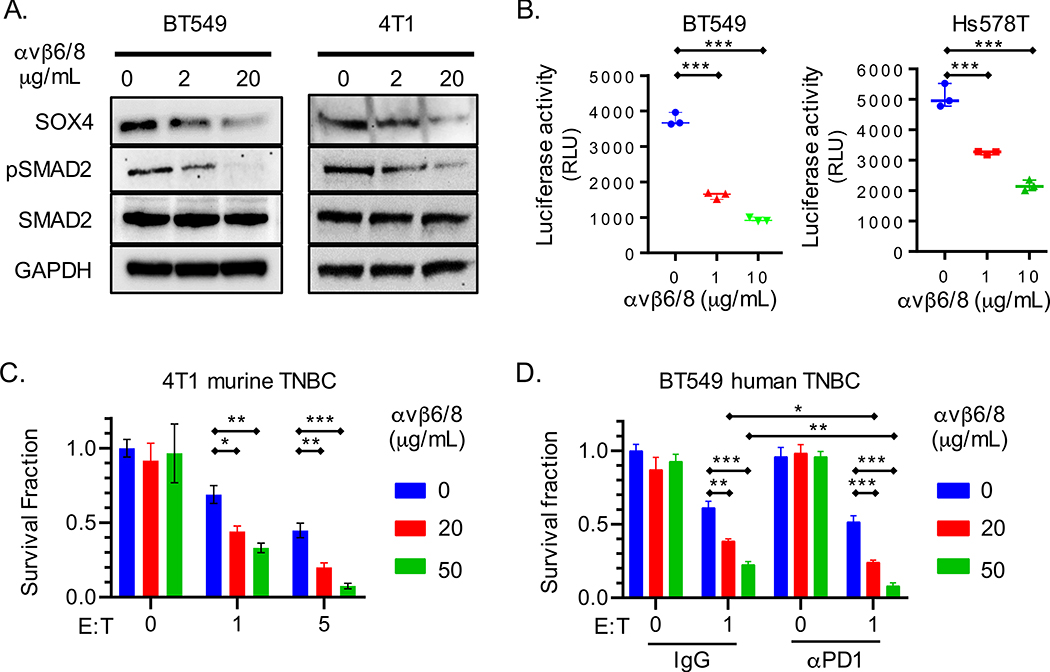
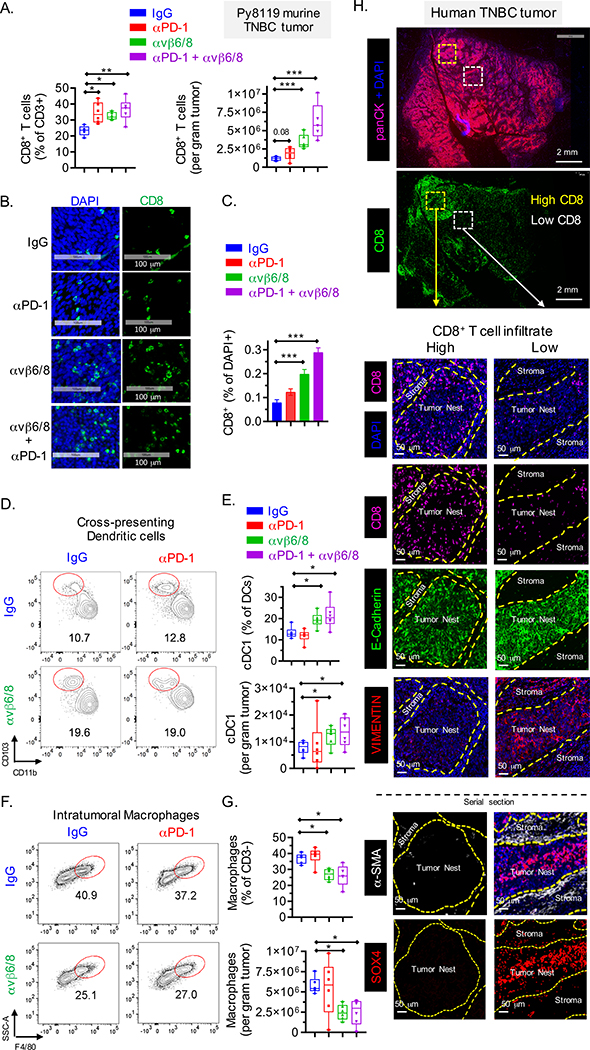
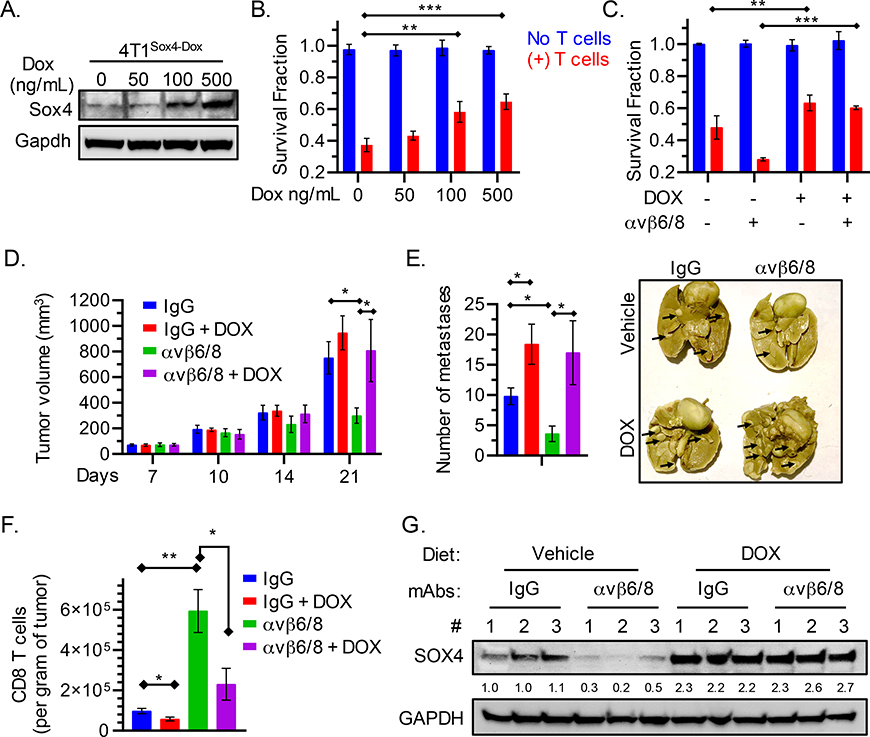
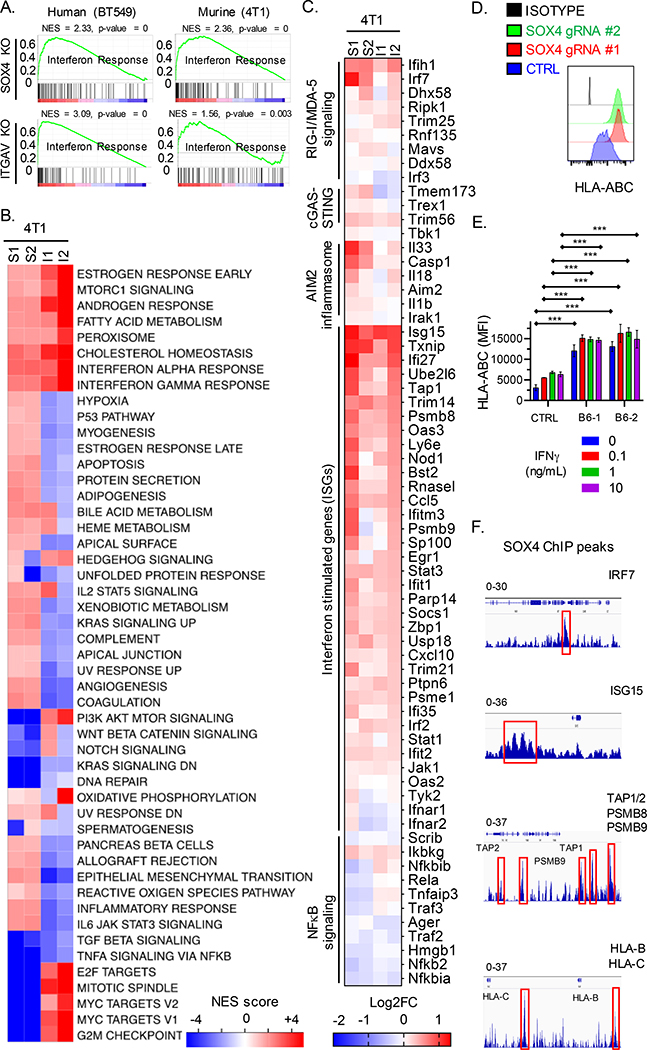
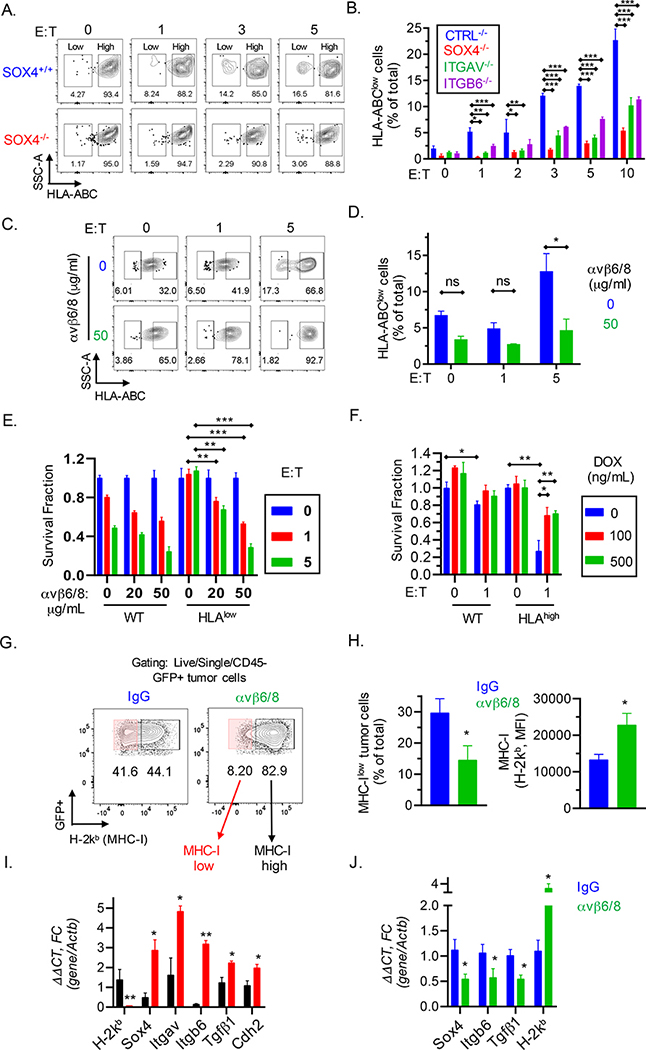
Cancer immunotherapy shows limited efficacy against many solid tumors that originate from epithelial tissues, including triple-negative breast cancer (TNBC). We identify the SOX4 transcription factor as an important resistance mechanism to T cell-mediated cytotoxicity for TNBC cells. Mechanistic studies demonstrate that inactivation of SOX4 in tumor cells increases the expression of genes in a number of innate and adaptive immune pathways important for protective tumor immunity. Expression of SOX4 is regulated by the integrin αvβ6 receptor on the surface of tumor cells, which activates TGFβ from a latent precursor. An integrin αvβ6/8-blocking monoclonal antibody (mAb) inhibits SOX4 expression and sensitizes TNBC cells to cytotoxic T cells. This integrin mAb induces a substantial survival benefit in highly metastatic murine TNBC models poorly responsive to PD-1 blockade. Targeting of the integrin αvβ6-TGFβ-SOX4 pathway therefore provides therapeutic opportunities for TNBC and other highly aggressive human cancers of epithelial origin.

Keywords: SOX4 transcription factor; TGFβ; cancer immunotherapy; cytotoxic T cells; integrin αvβ6; therapy resistance.


Conflict of interest statement

Declaration of Interests K.W.W. serves on the scientific advisory board of TCR2 Therapeutics, T-Scan Therapeutics, SQZ Biotech, and Nextechinvest, and he receives sponsored research funding from Novartis. He is a co-founder of Immunitas Therapeutics, a biotech company. D.D. consults for Novartis and is on the advisory board for Oncology Analytics, Inc.

Figures

Fig. 1.
Fig. 1.. Inactivation of SOX4 or ITGAV genes sensitizes tumor cells to cytotoxic T cells.
(A) Immunoblot showing SOX4 protein expression by human BT549 TNBC cells edited using two SOX4 gRNAs (S1, S2) or a control gRNA (CTRL). (B) Cell surface expression of integrin αv in BT549 TNBC cells edited with two ITGAV gRNAs (ITGAV gRNA#1 and #2) or a control gRNA (CTRL). (C) T cell cytotoxicity assay with human BT549 TNBC cells edited with SOX4, ITGAV, ITGB6 or control gRNAs. Human T cells expressing a NY-ESO-1 specific TCR were co-cultured for 24 h with tumor cells at the indicated E:T ratios. Data represent the mean of surviving tumor cell fraction after 24 h of co-culture for two independent gRNAs +/− SEM; data are shown relative to condition without T cells (E:T = 0). (D) RT-qPCR analysis of SOX4 mRNA levels in BT549 cells edited with ITGAV or control gRNAs represented as mean ± S.E.M. (E) Immunoblot showing SOX4 protein levels in human BT549 TNBC cells edited with two ITGAV targeting gRNAs (I1, I2) or a control gRNA (CTRL). (F-G) Impact of doxycycline-inducible SOX4 expression in ITGAV KO BT549 tumor cells on resistance to cytotoxic T cells. (F) Immunoblot showing levels of SOX4 and GAPDH proteins in ITGAV+/+ (WT) or ITGAV−/− (KO) BT549 human TNBC cells containing a doxycycline (DOX) inducible SOX4 cDNA construct. Cells were treated with the indicated concentration of doxycycline for 48 h. (G) T cell cytotoxicity assay with ITGAV WT or KO BT549 TNBC cells co-cultured with human NY-ESO-1 specific CD8+ T cells at indicated E:T ratios following pre-treatment with the indicated concentrations of doxycycline for 48 h. Data in (C, D, and G) are representative of at least two independent experiments with technical triplicates and summarized as mean ± S.E.M. Data in [A, B, E, F] were repeated at least three times with consistent results. To determine statistical significance, a two way ANOVA with Dunnett’s [C] or Tukey’s [G] post hoc test or an unpaired Student t-test [D] was used. ***P < 0.001; **P < 0.01; *P < 0.05; n.s., not significant. See also Figure S1.
Fig. 2.
Fig. 2.. An integrin αvβ6/8 mAb inhibits SOX4 expression and sensitizes TNBC cells to cytotoxic T cells.
(A) Immunoblot for indicated proteins in human (BT549) or murine (4T1) TNBC cells lines treated with integrin αvβ6/8 blocking mAb for 72 h. (B) Luciferase-based TGFβ reporter assay with human BT549 and Hs578T TNBC cell lines. HepG2-TGFβ reporter cells were co-cultured for 24 h with human TNBC cells that had been pre-treated with indicated concentrations of integrin αvβ6/8 mAb for 72 h. Data are represented as relative luciferase units (RLU). (C) T cell cytotoxicity assay with GFP+ murine 4T1 TNBC cells. Tumor cells were co-cultured for 48 h with GFP-specific CD8+ T cells (JEDI T cells) at indicated E:T ratios. Tumor cells were pre-treated with indicated concentrations of integrin αvβ6/8 mAb for 72 h prior to co-culture. (D) T cell cytotoxicity assay with human BT549 TNBC and human CD8+ T cells that expressed a NY-ESO-1 TCR. Tumor cells were pre-treated with indicated concentrations of control IgG or integrin αvβ6/8 mAb for 72 h; control IgG or PD-1 mAbs were added to co-cultures (20 μg/ml). Y-axis shows number of surviving tumor cells after 24 h of co-culture. Data are summarized as mean ± S.E.M and are representative of at least two independent experiments with technical triplicates. A one-way [B] or two-way [C and D] ANOVA with Dunnett’s post hoc test was used to determine statistical significance, ***P < 0.001; **P < 0.01; *P < 0.05. See also Figure S2.
Fig. 3.
Fig. 3.. Efficacy of integrin αvβ6/8 mAb in metastatic murine TNBC models resistant to PD-1 blockade.
(A) Py8119GFP+ TNBC (n=10 mice/group) or (B) 4T1 TNBC (n=12 mice/group) primary tumor volume shown at indicated time points. Mice with similar tumor burden were treated with indicated antibodies (IP, 0.2 mg/dose, twice weekly) until tumor volume in any group reached 1000 mm3. To deplete CD8+ T cells, mice were treated with anti-CD8β antibodies (0.1 mg/dose) on days −1, 1, and weekly thereafter. (C-D) Kaplan-Meier analysis of survival for mice described in (A) and (B), respectively. (E) Primary tumor volume shown at indicated time points for Py8119 model following monotherapy with integrin αvβ6 or isotype control mAbs; in the indicated groups CD8+ T cells (CD8β mAb) and/or NK cells (NK1.1 mAb) were also depleted by administration of the respective antibodies (0.1 mg/dose) on days −1, 1, and weekly thereafter. (F) Number of 4T1 lung surface metastases in mice treated as described in (A) following staining with picric acid for 24 h. (G) Representative images of 4T1 lung surface metastases on day 24 following tumor inoculation. Data are summarized as mean ± SD of tumor volume and are an average of two independent experiments. To determine statistical significance, a two way [A, B, and E] or a one-way [F] ANOVA with Dunnett’s post hoc test and Kaplan-Meier log-rank (Mantel-Cox) test [C and D] were used. ***P < 0.001; **P < 0.01; *P < 0.05; n.s., not significant. See also Figure S3.
Fig. 4.
Fig. 4.. Analysis of tumor microenvironment in murine and human TNBC.
(A) Quantification of tumor infiltrating CD8+ T cells, represented as percentage of CD3+ cells (left) and per gram of tumor (right) in Py8119 TNBC tumors (n=6) treated with indicated mAbs (FACS analysis 22 days following tumor inoculation). (B-C) Representative images showing CD8+ T cell infiltration into Py8119 TNBC tumors (n=6) (B) and quantification of CD8+ cells as percentage of DAPI+ cells (C). (D-E) Contour plot showing migratory cross-presenting DCs, defined as CD45+/CD3/F4/80/CD11c+/MHC-IIhigh/CD103+/CD11b cells (D) and quantification of these cells as percentage of DCs (CD45+/CD3/F4/80/CD11c+/MHC-IIhigh) and total count (E). (F-G) Contour plot showing intra-tumoral F4/80+ macrophages, defined as CD45+/CD3/Gr1/CD11b+/MHC-II+/F4/80+ cells (F) and quantification of these cells as percentage of CD45+ CD3 cells (top) and per gram of tumor (bottom) (G). (H) Human TNBC tumor sections stained with indicated markers. Serial sections were stained with DAPI and antibodies specific for CD8, E-cadherin and vimentin (panel #1) and DAPI, SOX4 and αSMA (panel #2). Data are summarized as mean ± SD. Data in [B, C] is an average of two independent experiments and data in [A, D, E, F and G] are representative of at least two independent experiments. For box plots, dots denote all individual values, horizontal lines denote median values, boxes extend from 25th - 75th percentile of each group’s distribution, and no data points were excluded. An unpaired Student’s t-test was used to determine statistical significance, ***P < 0.001; **P < 0.01; *P < 0.05. See also Figure S4 and S5.
Fig. 5.
Fig. 5.. Relevance of SOX4 to the efficacy of integrin αvβ6/8 mAb treatment.
(A) Immunoblot showing levels of SOX4 and GAPDH proteins in GFP+ 4T1 murine TNBC cells containing a doxycycline (DOX) inducible Sox4 cDNA construct (4T1Sox4-Dox). Cells were treated with the indicated concentrations of doxycycline for 48 h. (B) Cells from (A) were co-cultured with murine GFP-specific CD8+ T cells (red) (E:T = 1:1), and the fraction of surviving cells was quantified (Y-axis) after 24 h of co-culture. (C) 4T1Sox4-Dox tumor cells were treated with either DOX (500 ng/mL) alone or in combination with integrin αvβ6/8 mAb for 48 h followed by co-culture with murine GFP specific CD8+ T cells (red) for 18 h. (D) 4T1Sox4-Dox TNBC (n=10 mice/group) primary tumor volume shown at indicated time points. Mice with similar tumor burden were fed either a regular diet or a doxycycline-containing diet (625 ppm, Envigo Teklad) starting on day 7 to induce the expression of SOX4 in tumor cells. Mice receiving either diet also received monotherapy with integrin αvβ6/8 or isotype control mAbs (IP, 0.25 mg/dose, twice weekly) until tumor volume in any group reached 1000 mm3. Data are summarized as mean ± SD of tumor volume. (E) Number of lung surface metastases in mice treated as described in (D) following staining with picric acid for 24 h. Summary of number of lung surface metastases (left) and representative images (right) on day 21 following tumor inoculation. (F) Quantification of tumor-infiltrating CD8+ T cells per gram of tumor (right) following treatment as described in (D) on day 21 following tumor inoculation. (G) Immunoblot showing levels of SOX4 and GAPDH proteins in 4T1Sox4-Dox tumors (n=3 per group) derived from mice treated as described in (D) on day 21. Numbers represent relative quantification of SOX4 to GAPDH, normalized to the average expression in vehicle and IgG treated controls. Data in [A, B, C and G] are representative of at least two independent experiments with technical triplicates and summarized as mean ± SEM [B, C]. Data in [D, E, F] are an average of two independent experiments and summarized as mean ± SD. To determine statistical significance, a one way ANOVA with Dunnett’s [B-E] post hoc test or an unpaired Student t-test [F] was used. ***P < 0.001; **P < 0.01; *P < 0.05; n.s., not significant.
Fig. 6.
Fig. 6.. SOX4 regulates multiple innate and adaptive immune genes to inhibit T cell-mediated tumor immunity.
(A) GSEA analysis for gene sets associated with an interferon response in human (BT549, left) and murine (4T1, right) TNBC cells edited with SOX4 (top) or ITGAV (bottom) gRNAs compared to control edited cells. (B) GSEA results are summarized as the normalized enrichment score (NES) in Sox4 (S1, S2) or Itgav (I1, I2) deficient 4T1 TNBC cells as compared to control edited counterparts. (C) Heat map showing RNA-seq data for indicated genes from 4T1 TNBC cells edited with either two Sox4 (S1, S2) or two Itgav (I1, I2) gRNAs. Gene expression is shown relative to control edited 4T1 cells (log2FC, color scale). (D) Surface HLA-ABC protein levels on BT549 cells edited with two different SOX4 gRNAs or a control gRNA (CTRL); isotype control antibody staining is shown in black. (E) Surface HLA-ABC protein levels on BT549 cells edited with two different ITGB6 (B6–1, B6–2) or control gRNAs, followed by stimulation with indicated concentrations of IFNγ for 24 h. (F) ChIP-seq with SOX4 mAb in human BT549 TNBC cells. SOX4 specific peaks (red boxes) at the indicated gene loci relative to reference genome Hg19 analyzed using the IGV viewer (IGV, Broad Institute). The data range is shown on top for each indicated gene. Data in [A-C] represent an average of triplicates of two independent gRNAs for each gene knockout. Data in [D, E] are representative of at least two independent experiments with technical triplicates. Data in [F] was assessed using biological triplicates each composed of technical duplicates. A two-way ANOVA with Dunnett’s post hoc test was used to determine significance in [D and E]. Data are summarized as mean ± S.E.M, *** P < 0.001; **P < 0.01; *P < 0.05; n.s., not significant. See also Figure S6, Table S1, and S2.
Fig. 7.
Fig. 7.. Inactivation of SOX4 gene inhibits emergence of MHC class I deficient TNBC cells during selection by cytotoxic T cells.
(A) Contour plots showing enrichment of HLA-ABC low/negative populations following a 24 h co-culture of SOX4+/+ or SOX4−/− BT549 human TNBC cells with human T cells expressing a NY-ESO-1 TCR at the indicated E:T ratios. (B) Quantification of HLA-ABC low/negative cells for indicated gene edited BT549 tumor populations following co-culture with CD8+ T cells as described in (A). Data are summarized as mean ± S.E.M. (C-D) BT549 tumor cells were pretreated with indicated concentrations of integrin αvβ6/8 mAb for 72 h and then co-cultured with CD8+ T cells. Contour (C) and summary (D) plots of HLA-ABC low/negative BT549 TNBC cells following co-culture with CD8+ T cells for 24 h at indicated E:T ratios. Isotype control Ab was used to define MHC-I negative populations. (E) Human BT549 TNBC cells expressing wild-type (WT) or low levels of HLA-ABC (HLAlow) were sorted and then pre-treated with indicated concentrations of integrin αvβ6/8 mAb followed by co-culture with NY-ESO-1 specific CD8+ T cells at the indicated E:T ratios. (F) BT549 TNBC cells were transduced with a doxycycline inducible SOX4 cDNA construct followed by FACS-based enrichment of HLA-ABChigh cells; tumor cells were then pre-treated for 48 h with the indicated concentrations (ng/ml) of doxycycline (DOX). Numbers of surviving wild-type (WT) or HLA-ABChigh tumor cells were quantified after co-culture with CD8+ T cells for 24 h. (G-J) Characterization of emergence of MHC class I deficient TNBC cells in vivo. (G) Contour plots showing expression of MHC-I (H-2Kb) in Py8119 tumors derived from mice treated with either control IgG Abs or integrin αvβ6/8 mAbs. (H) Quantification of MHC-Ilow (H-2Kb) cells shown in (G), represented as a percentage of total cells (left) or as MFI (right). (I) mRNA levels of indicated genes relative to β-actin in sorted MHC-Ihigh (black) and MHC-Ilow (red) murine TNBC cells derived from isotype control IgG treated tumors as shown in (G) or (J) in whole tumors from mice treated as described in (G). Data in [A-D, G-J] are representative of at least two independent experiments. Data in [E, F] are representative of three independent experiments. A two-way ANOVA with Dunnett’s post hoc test [B, D, E, and F] and an unpaired Student t-test [H-J] were used to determine significance, ***P < 0.001; **P < 0.01; *P < 0.05; n.s., not significant. See also Figure S7.

References

    1. Adams S, Gray RJ, Demaria S, Goldstein L, Perez EA, Shulman LN, Martino S, Wang M, Jones VE, Saphner TJ, et al. (2014). Prognostic value of tumor-infiltrating lymphocytes in triple-negative breast cancers from two phase III randomized adjuvant breast cancer trials: ECOG 2197 and ECOG 1199. J Clin Oncol 32, 2959–2966. - PMC - PubMed
    1. Agudo J, Ruzo A, Park ES, Sweeney R, Kana V, Wu M, Zhao Y, Egli D, Merad M, and Brown BD (2015). GFP-specific CD8 T cells enable targeted cell depletion and visualization of T-cell interactions. Nat Biotechnol 33, 1287–1292. - PMC - PubMed
    1. Aluwihare P, Mu Z, Zhao Z, Yu D, Weinreb PH, Horan GS, Violette SM, and Munger JS (2009). Mice that lack activity of alphavbeta6- and alphavbeta8-integrins reproduce the abnormalities of Tgfb1- and Tgfb3-null mice. Journal of cell science 122, 227–232. - PMC - PubMed
    1. Bandyopadhyay A, and Raghavan S (2009). Defining the role of integrin alphavbeta6 in cancer. Curr Drug Targets 10, 645–652. - PMC - PubMed
    1. Chen J, Ju HL, Yuan XY, Wang TJ, and Lai BQ (2016). SOX4 is a potential prognostic factor in human cancers: a systematic review and meta-analysis. Clin Transl Oncol 18, 65–72. - PubMed

Publication types

MeSH terms