

Quantification of gastric mucosal microcirculation as a surrogate marker of portal hypertension by spatially resolved subdiffuse reflectance spectroscopy in diagnosis of cirrhosis: a proof-of-concept study
- PMID: 33385462
- PMCID: PMC8546777
- DOI: 10.1016/j.gie.2020.12.037
Quantification of gastric mucosal microcirculation as a surrogate marker of portal hypertension by spatially resolved subdiffuse reflectance spectroscopy in diagnosis of cirrhosis: a proof-of-concept study
Abstract
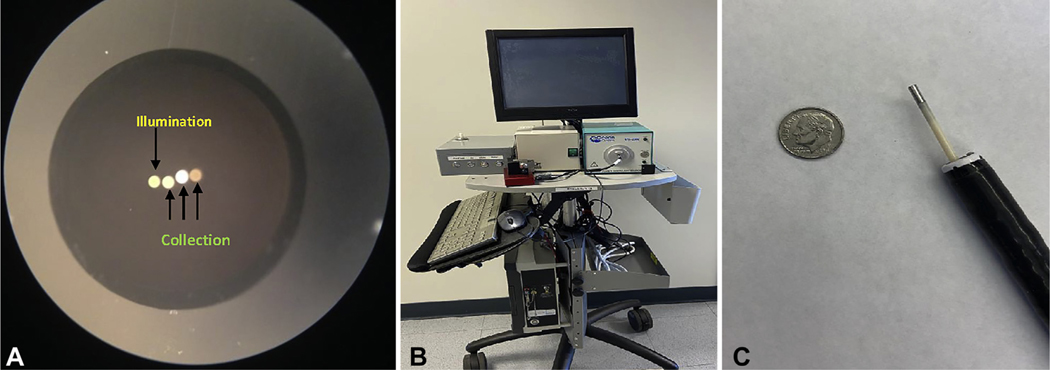
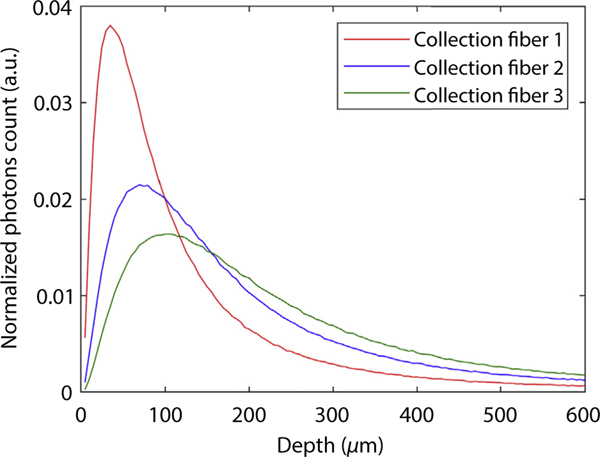
Background and aims: Portal pressure can be used to identify patients with chronic liver disease who have progressed to cirrhosis. Portal pressure can also provide accurate prognostication for patients with cirrhosis. However, there are no practical means for assessment of portal pressure. Although it is well established that the gastric mucosal blood supply increases in patients with cirrhosis, this has been difficult to quantify reproducibly. Our group has developed a novel spectroscopic technology called spatially resolved subdiffuse reflectance spectroscopy (SRSRS), which enables quantification of mucosal microcirculation. We aim to ascertain if quantification of the gastric mucosal microcirculation with SRSRS correlates with clinical evidence of portal hypertension.
Methods: Patients undergoing EGD for clinical indications had 10 measurements taken in the endoscopically normal gastric fundus via SRSRS probe to assess the microcirculation. Cases were defined as patients with cirrhosis (n = 18), and controls were those without evidence of liver disease (n = 18); this was corroborated with transient elastography.
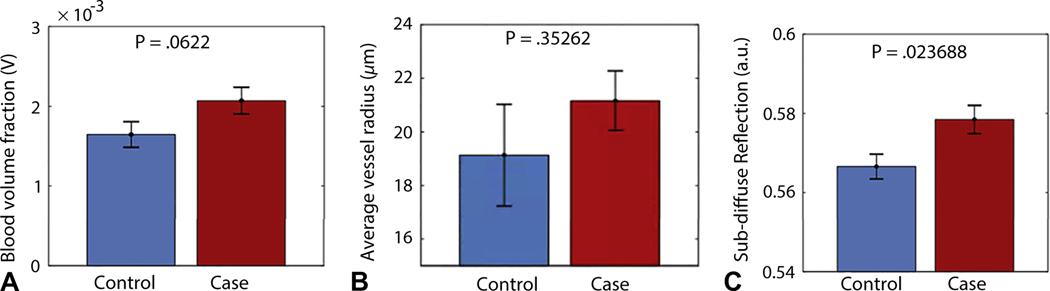
Results: The blood volume fraction (P = .06) and subdiffuse reflectance (P = .02) from a shallow depth in the gastric fundus were higher in patients with cirrhosis than those without. These markers were combined to yield an overall optical marker that can differentiate patients with cirrhosis from controls with a sensitivity of 72% and specificity of 94% (area under receiver operating curve, 0.82).
Conclusions: Spectroscopic quantification of gastric fundal mucosal microcirculation is a promising surrogate of clinical correlates of portal hypertension. This approach may represent a less-intrusive surrogate biomarker for liver disease prognostication and potentially response to therapy.
Copyright © 2021 American Society for Gastrointestinal Endoscopy. Published by Elsevier Inc. All rights reserved.
Figures

Similar articles
-
[Correlation between gastric microcirculation and mucosal injury after surgical therapy of esophageal varices].Nihon Geka Gakkai Zasshi. 1990 Jan;91(1):101-13. Nihon Geka Gakkai Zasshi. 1990. PMID: 2314375 Japanese.
-
Measurement of gastric intramucosal pH in patients with cirrhosis and portal hypertensive gastropathy.Gastroenterol Clin Biol. 1994;18(11):969-74. Gastroenterol Clin Biol. 1994. PMID: 7705585
-
Dynamic CT of portal hypertensive gastropathy: significance of transient gastric perfusion defect sign.Clin Radiol. 2008 Jul;63(7):783-90. doi: 10.1016/j.crad.2008.02.003. Epub 2008 Apr 18. Clin Radiol. 2008. PMID: 18555036
-
Does portal hypertension contribute to the pathogenesis of gastric ulcer associated with liver cirrhosis?J Gastroenterol. 2000;35(2):79-86. doi: 10.1007/s005350050018. J Gastroenterol. 2000. PMID: 10680661 Review.
-
[Gastrointestinal lesions in liver cirrhosis].Nihon Rinsho. 1998 Sep;56(9):2387-90. Nihon Rinsho. 1998. PMID: 9780725 Review. Japanese.
Cited by
-
Application of Ultrasound Elastography in Assessing Portal Hypertension.Diagnostics (Basel). 2022 Sep 29;12(10):2373. doi: 10.3390/diagnostics12102373. Diagnostics (Basel). 2022. PMID: 36292062 Free PMC article. Review.
References
-
- QuickStats: Death rates for chronic liver disease and cirrhosis, by sex and age group: National Vital Statistics System, United States, 2000 and 2015. MMWR Morb Mortal Wkly Rep 2017;66:1031. - PubMed
-
- Beste LA, Leipertz SL, Green PK, et al. Trends in burden of cirrhosis and hepatocellular carcinoma by underlying liver disease in US veterans, 2001–2013. Gastroenterology 2015;149:1471–82.e5; quiz e17–18. - PubMed
-
- Garcia-Tsao G, Abraldes JG, Berzigotti A, et al. Portal hypertensive bleeding in cirrhosis: risk stratification, diagnosis, and management: 2016 practice guidance by the American Association for the study of liver diseases. Hepatology 2017;65:310–35. - PubMed
MeSH terms
Substances
Grants and funding
LinkOut - more resources
Full Text Sources
