

Site-Level Variation in the Characteristics and Care of Infants With Neonatal Opioid Withdrawal
- PMID: 33386337
- PMCID: PMC7780957
- DOI: 10.1542/peds.2020-008839
Site-Level Variation in the Characteristics and Care of Infants With Neonatal Opioid Withdrawal
Abstract
Background and objectives: Variation in pediatric medical care is common and contributes to differences in patient outcomes. Site-to-site variation in the characteristics and care of infants with neonatal opioid withdrawal syndrome (NOWS) has yet to be quantified. Our objective was to describe site-to-site variation in maternal-infant characteristics, infant management, and outcomes for infants with NOWS.
Methods: Cross-sectional study of 1377 infants born between July 1, 2016, and June 30, 2017, who were ≥36 weeks' gestation, with NOWS (evidence of opioid exposure and NOWS scoring within the first 120 hours of life) born at or transferred to 1 of 30 participating hospitals nationwide. Site-to-site variation for each parameter within the 3 domains was measured as the range of individual site-level means, medians, or proportions.
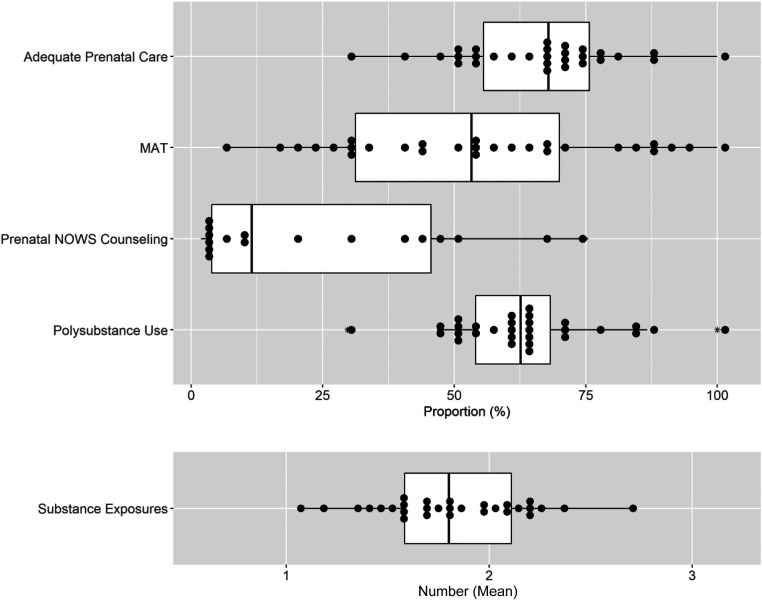
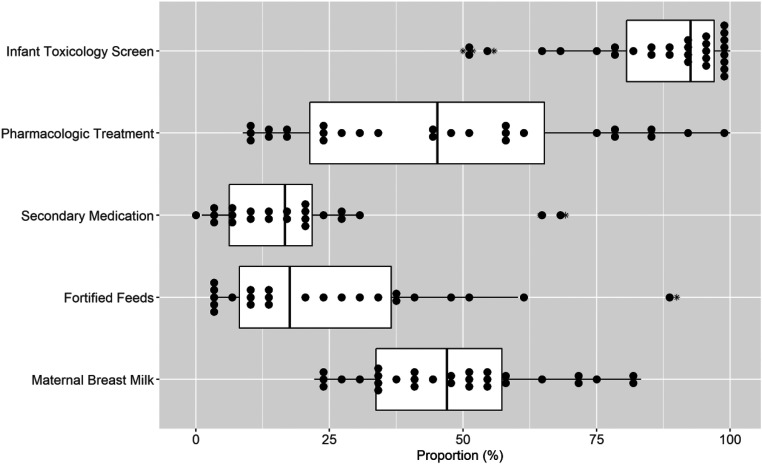
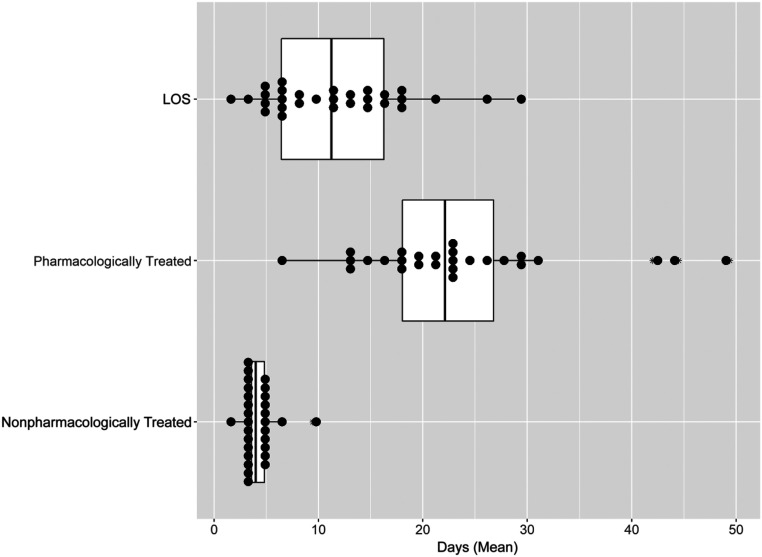
Results: Sites varied widely in the proportion of infants whose mothers received adequate prenatal care (31.3%-100%), medication-assisted treatment (5.9%-100%), and prenatal counseling (1.9%-75.5%). Sites varied in the proportion of infants with toxicology screening (50%-100%) and proportion of infants receiving pharmacologic therapy (6.7%-100%), secondary medications (1.1%-69.2%), and nonpharmacologic interventions including fortified feeds (2.9%-90%) and maternal breast milk (22.2%-83.3%). The mean length of stay varied across sites (2-28.8 days), as did the proportion of infants discharged with their parents (33.3%-91.1%).
Conclusions: Considerable site-to-site variation exists in all 3 domains. The magnitude of the observed variation makes it unlikely that all infants are receiving efficient and effective care for NOWS. This variation should be considered in future clinical trial development, practice implementation, and policy development.
Copyright © 2021 by the American Academy of Pediatrics.
Conflict of interest statement
POTENTIAL CONFLICT OF INTEREST: The authors have indicated they have no potential conflicts of interest to disclose.
Figures
Comment in
-
It Is Time to ACT NOW to Improve Quality for Opioid-Exposed Infants.Pediatrics. 2021 Jan;147(1):e2020028340. doi: 10.1542/peds.2020-028340. Epub 2020 Dec 21. Pediatrics. 2021. PMID: 33386340 No abstract available.
References
-
- Patrick SW, Schumacher RE, Benneyworth BD, Krans EE, McAllister JM, Davis MM. Neonatal abstinence syndrome and associated health care expenditures: United States, 2000-2009. JAMA. 2012;307(18):1934–1940 - PubMed
-
- Clark ME, Cummings BM, Kuhlthau K, Frassica N, Noviski N. Impact of pediatric intensive care unit admission on family financial status and productivity: a pilot study. J Intensive Care Med. 2019;34(11–12):973–977 - PubMed
-
- Tolia VN, Patrick SW, Bennett MM, et al. Increasing incidence of the neonatal abstinence syndrome in U.S. neonatal ICUs. N Engl J Med. 2015;372(22):2118–2126 - PubMed
Publication types
MeSH terms
Substances
Grants and funding
- UG1 OD024945/OD/NIH HHS/United States
- U2C OD023375/OD/NIH HHS/United States
- UG1 OD024943/OD/NIH HHS/United States
- UG1 HD027853/HD/NICHD NIH HHS/United States
- UG1 OD024947/OD/NIH HHS/United States
- UG1 OD024958/OD/NIH HHS/United States
- UG1 HD090907/HD/NICHD NIH HHS/United States
- UG1 OD024942/OD/NIH HHS/United States
- UG1 OD024946/OD/NIH HHS/United States
- U10 HD036790/HD/NICHD NIH HHS/United States
- UG1 HD068278/HD/NICHD NIH HHS/United States
- UG1 OD024953/OD/NIH HHS/United States
- UG1 OD024950/OD/NIH HHS/United States
- UG1 OD024952/OD/NIH HHS/United States
- U10 HD027904/HD/NICHD NIH HHS/United States
- UG1 OD024951/OD/NIH HHS/United States
- UG1 OD024948/OD/NIH HHS/United States
- UG1 OD024959/OD/NIH HHS/United States
- U24 OD024957/OD/NIH HHS/United States
- UG1 OD024954/OD/NIH HHS/United States
- UG1 OD024944/OD/NIH HHS/United States
- UG1 HD021364/HD/NICHD NIH HHS/United States
- UG1 OD024956/OD/NIH HHS/United States
- UG1 OD024949/OD/NIH HHS/United States
- UG1 OD024955/OD/NIH HHS/United States
- U10 HD053089/HD/NICHD NIH HHS/United States
LinkOut - more resources
Full Text Sources
Medical
