. 2021 Mar;226(2):481-499.
doi: 10.1007/s00429-020-02194-4. Epub 2021 Jan 2.

Optimization and evaluation of fluorescence in situ hybridization chain reaction in cleared fresh-frozen brain tissues

Affiliations

Optimization and evaluation of fluorescence in situ hybridization chain reaction in cleared fresh-frozen brain tissues

Vivek Kumar et al. Brain Struct Funct. 2021 Mar.

Abstract

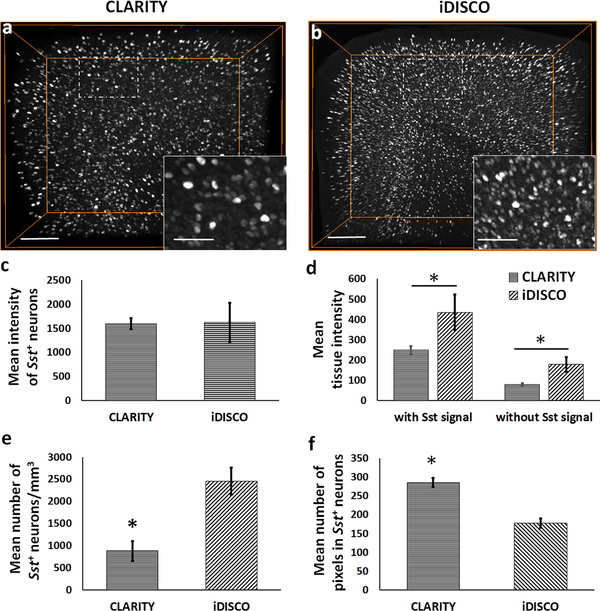
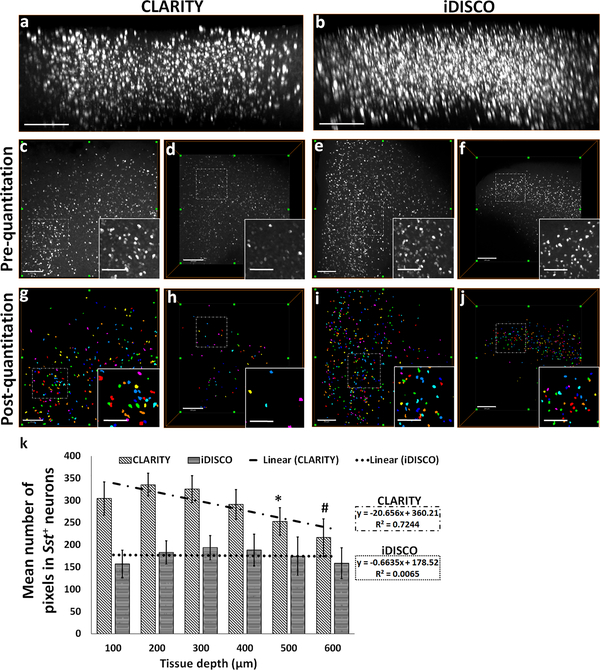
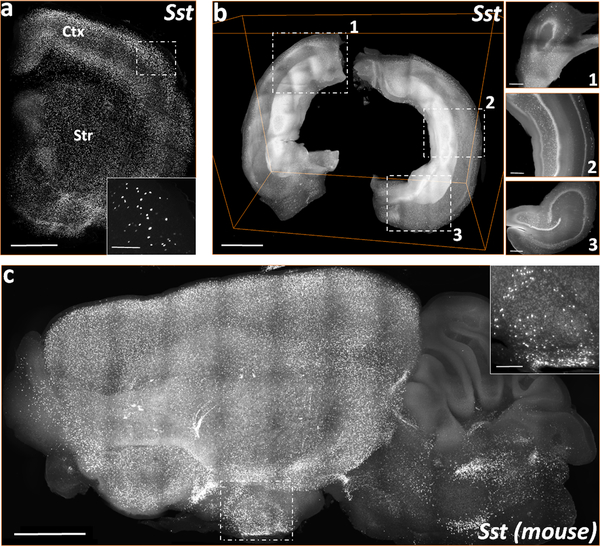
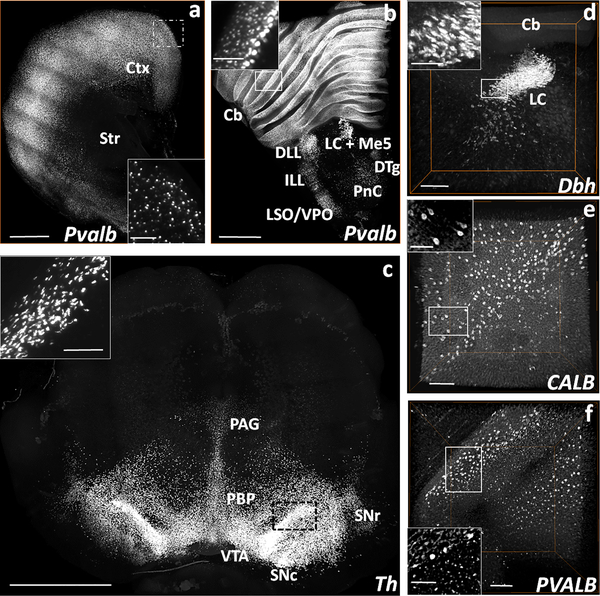
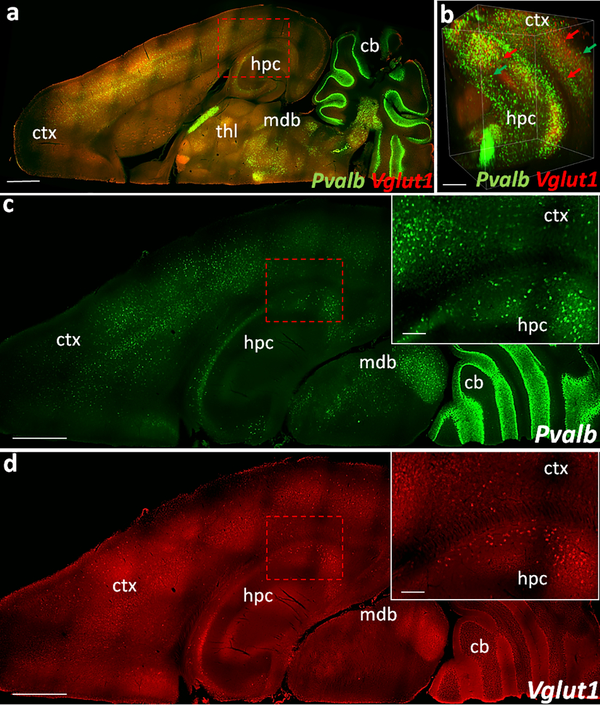
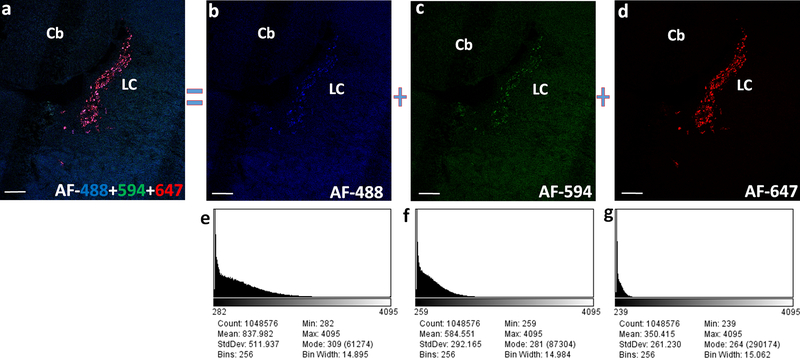
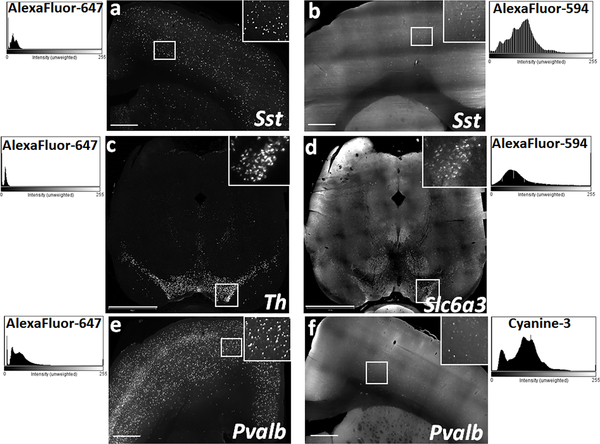
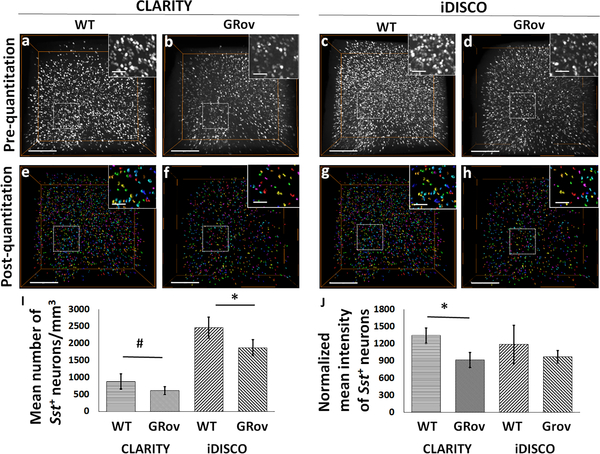
Transcript labeling in intact tissues using in situ hybridization chain reaction has potential to provide vital spatiotemporal information for molecular characterization of heterogeneous neuronal populations. However, large tissue labeling in non-perfused or fresh-frozen rodent and postmortem human samples, which provide more flexible utilization than perfused tissues, is largely unexplored. In the present study, we optimized the combination of in situ hybridization chain reaction in fresh-frozen rodent brains and then evaluated the uniformity of neuronal labeling between two clearing methods, CLARITY and iDISCO+. We found that CLARITY yielded higher signal-to-noise ratios but more limited imaging depth and required longer clearing times, whereas, iDISCO+ resulted in better tissue clearing, greater imaging depth and a more uniform labeling of larger samples. Based on these results, we used iDISCO+-cleared fresh-frozen rodent brains to further validate this combination and map the expression of a few genes of interest pertaining to mood disorders. We then examined the potential of in situ hybridization chain reaction to label transcripts in cleared postmortem human brain tissues. The combination failed to produce adequate mRNA labeling in postmortem human cortical slices but produced visually adequate labeling in the cerebellum tissues. We next, investigated the multiplexing ability of in situ hybridization chain reaction in cleared tissues which revealed inconsistent fluorescence output depending upon the fluorophore conjugated to the hairpins. Finally, we applied our optimized protocol to assess the effect of glucocorticoid receptor overexpression on basal somatostatin expression in the mouse cortex. The constitutive glucocorticoid receptor overexpression resulted in lower number density of somatostatin-expressing neurons compared to wild type. Overall, the combination of in situ hybridization chain reaction with clearing methods, especially iDISCO+, may find broad application in the transcript analysis in rodent studies, but its limited use in postmortem human tissues can be improved by further optimizations.

Keywords: CLARITY; Fluorescence in situ hybridization; Fresh-frozen brain; Hybridization chain reaction; Postmortem human brain; iDISCO+.


Figures

Fig. 1.
Fig. 1.. Quantitative differences in the HCR FISH signal (Sst transcript expression) between CLARITY and iDISCO+.
(a-b) 3D volume-rendered images of representative CLARITY and iDISCO+ samples, respectively, showing the observed differences in the detected neuronal density and mean tissue intensity. (c) Bar-diagram shows comparable mean intensity of the detected Sst+ neurons in the acquired cortical ROI between CLARITY and iDISCO+. (d) Mean background tissue intensity, with or without including the Sst signal, and (e) mean number of Sst+ neurons per unit volume were significantly lower in CLARITY samples as compared to the iDISCO+ samples, for consistent cortical ROIs. (f) Bar-diagram shows a significantly higher mean number of pixels in the detected Sst+ neurons in CLARITY images vs. iDISCO+. *p< 0.05. Scale bars- 200 μm (Insets-75 μm).
Fig. 2.
Fig. 2.. Attenuation of the HCR FISH signal in CLARITY samples measured as a function of z-depth.
xz-plane view of 3D rendered confocal microscope-acquired volumes of (a) CLARITY and (b) iDISCO+ showing greater attenuation of HCR FISH signal with depth. Representative xy-plane images at 100 μm z-depth: CLARITY- (c) pre-quantitation, (g) post-quantitation, iDISCO+- (e) pre-quantitation, (i) post-quantitation, respectively. Representative xy-plane images at 500 μm z-depth: CLARITY- (d) pre-quantitation, (h) post-quantitation, iDISCO+- (f) pre-quantitation, (j) post-quantitation, respectively. (k) Bar-diagram shows mean number of pixels in the detected neurons as a function of increasing z-depth (100 to 600 μm) in CLARITY and iDISCO+ samples. Following the thresholding and quantitation, each neuron is identified and assigned a unique index and displayed using a cyclic colormap so that cells in close proximity are more likely to be shown in a different color. For CLARITY samples, *p<0.05 for comparisons between 100/200/300 vs. 500 μm and #p<0.05 for 100/200/300/400 vs. 600 μm. Scale bar- (a-b) 300 μm; (c-j) 250 μm (Inset bars-100 μm).
Fig. 3.
Fig. 3.. 3D visualizations of COLM acquired stacks of Sst mRNA labeling in the rodent brain cleared using iDISCO+.
(a) A representative stack of rat forebrain hemi-slice corresponding to a 2 mm thick region between bregma = 2.00 mm and 0.00 mm, rostro-caudally. (b) Volume rendering of an intact rat hippocampus. Inset, xy-plane views of 1) dorsal, 2) medio-lateral, and 3) ventral hippocampus. (c) 3D volume rendering of a mouse left hemisphere (~4 mm thick, sagittal view). Scale bars (μm) - (a) 300 (Inset-100); (b-c) 250 (Inset-100); (d) 500 (Inset-200); (e) 1000 (Inset-300); (f) 1000 (Inset-200).
Fig. 4.
Fig. 4.. Volume rendered visualizations of Pvalb, Dbh, and Th mRNA expressing neurons in the rat brain, and CALB+ and PVALB+ neurons in the postmortem human cerebellum following HCR FISH and iDISCO+.
(a) COLM-acquired volume of Pvalb expressing neurons in a 2 mm thick rat cortex (Ctx) and striatum (Str) hemi-slice between bregma = 2.00 mm and 0.00 mm. (b) COLM-acquired image of Pvalb expression pattern in a 2 mm rat brainstem hemi-slice between bregma = −8.44 mm and −10.44 mm. (c) COLM-acquired image of Th expression in a 2.5 mm thick rat mid-brain volume between bregma = −4.40 mm and −6.90 mm. (d) Confocal microscope-acquired image stack of Dbh expression in the locus coeruleus (LC) of rat brainstem hemi-slice between bregma = −9.72 mm and −10.32 mm. (e) CALB and (f) PVALB expression in the postmortem human cerebellum of a control subject (#2292) acquired on confocal microscope (1200 μm deep stacks). Cb- cerebellum, DTg- dorsal tegmental nucleus, ILL/DLL- intermediate/dorsal lateral lemniscus, LC+Me5- locus coeruleus + mesencephalic trigeminal nucleus, PnC- caudal pontine reticular nucleus, LSO/VPO- lateral/ventral superior olive, PAG- periaqueductal gray, PBP- parabrachial pigmented nucleus of the VTA, SNc/r- substantia nigra compacta/reticulata, VTA-ventral tegmental area. Scale bars (μm) - (a-b) 1000 (Inset-400); (c) 500 (Inset-100); (d) 1000 (Inset-200); (e-f) 500 (Inset-250).
Fig. 5.
Fig. 5.. 3D visualization of COLM acquired dual HCR labeling in iDISCO+ tissue.
(a) Dorsal view of a representative mouse hemisphere showing Pvalb (green, AF-647) and Vglut1 (red, AF-594) labeling in down-sampled image volume (b) Volume rendered view showing cellular resolution in ventral hippocampus and cortex (parts of lateral entorhinal cortex) in an extracted sub-volume. (c-d) Dorsal views of a different z-plane than (a) showing Pvalb and Vglut1 FISH signal. Insets, zoomed-in view. Images are pseudocolored for the overlaying purpose. Scale bars (μm) - (a) 1500; (b) 300; (c-d) 1000 (Inset-200).
Fig. 6.
Fig. 6.. Fluorophore based differences in the fluorescence output imaged using confocal microscope.
(a) Dbh expression in the rat locus coeruleus (LC) following multiplexed HCR FISH using a set of common mRNA binding probes and 3 different hairpins AF-488, AF-594 and AF-647. Relatively weak fluorescence and high background recorded with the use of AF-488 (b) and AF-594 (c) tagged DNA hairpins in comparison to the strong fluorescence with low background following the use of hairpins conjugated with AF-647 (d). Screenshots of the histogram (e-g) for their respective z-projection images (b-d), generated in the ImageJ software depict the poor S/N ratio resulting from the use of AF-448 and AF-594 compared to a better S/N ratio from the use of AF-647. Images are pseudocolored for the overlaying purpose. Scale bars- 200 μm.
Fig. 7.
Fig. 7.. Fluorophore based differences in the quality of fluorescence output imaged using light sheet microscope.
Representative xy-plane images of Sst labeled neurons in rat cortical slices using DNA hairpins conjugated with (a) AF-647 and (b) AF-594. Representative xy-plane images of rat mid-brain slices following multiplexed HCR FISH for two abundantly expressed genes in the substantia nigra and ventral tegmental area - (c) Th, detected with AF-647 and (d) Dat (Slc6a3) detected with AF-594. Comparison of the Pvalb signal in rat cortical tissue using DNA hairpins conjugated with (e) AF-647 and (f) Cy3. ImageJ generated histograms on the respective sides, show consistently high S/N ratio achieved with the use of AF-647 in comparison to the low S/N ratio with AF-594 or Cy3. Scale bars- (a, b, e, f) 500 μm; (c-d) 1200 μm.
Fig. 8.
Fig. 8.. GR overexpression negatively affects the expression of Sst in the analyzed cortical ROI of mice.
3D volume-rendered confocal images show qualitative visualization of Sst+ neuronal density in CLARITY- (a) WT, (b) GRov; and iDISCO+-(c) WT, (d) GRov. Surface-rendered images show post-quantitation volume density of Sst+ neurons in CLARITY- (e) WT, (f) GRov; and iDISCO+-(g) WT, (h) GRov. (i) Bar-diagram shows the significant difference in the number of Sst+ neurons between WT and GRov samples processed through CLARITY (cWT vs. cGRov) or iDISCO+ (iWT vs. iGRov). (j) Bar-diagram shows significant difference in the normalized mean intensity of Sst+ neurons between cWT and cGRov. #p=0.051; *p<0.05. Scale bars-300 μm (Inset bars-100 μm).

References

    1. Azaripour A, Lagerweij T, Scharfbillig C, Jadczak AE, Willershausen B, Van Noorden CJF (2016) A survey of clearing techniques for 3D imaging of tissues with special reference to connective tissue. Prog Histochem Cytochem 51:9–23. doi: 10.1016/J.PROGHI.2016.04.001 - DOI - PubMed
    1. Biesemeier A, Schraermeyer U, Eibl O (2011) Chemical composition of melanosomes, lipofuscin and melanolipofuscin granules of human RPE tissues. Exp Eye Res 93:29–39. doi: 10.1016/j.exer.2011.04.004 - DOI - PubMed
    1. Bria A, Iannello G (2012) TeraStitcher - A tool for fast automatic 3D-stitching of teravoxel-sized microscopy images. BMC Bioinformatics 13:316. doi: 10.1186/1471-2105-13-316 - DOI - PMC - PubMed
    1. Choi HMT, Beck VA, Pierce NA (2014) Next-Generation in Situ Hybridization Chain Reaction: Higher Gain, Lower Cost, Greater Durability. ACS Nano 8:4284–4294. doi: 10.1021/nn405717p - DOI - PMC - PubMed
    1. Choi HMT, Chang JY, Trinh LA, Padilla JE, Fraser SE, Pierce NA (2010) Programmable in situ amplification for multiplexed imaging of mRNA expression. Nat Biotechnol 28:1208–1212. doi: 10.1038/nbt.1692 - DOI - PMC - PubMed

LinkOut - more resources