. 2021 Feb 19;433(4):166790.
doi: 10.1016/j.jmb.2020.166790. Epub 2020 Dec 31.

An Eight Amino Acid Segment Controls Oligomerization and Preferred Conformation of the two Non-visual Arrestins

Affiliations

An Eight Amino Acid Segment Controls Oligomerization and Preferred Conformation of the two Non-visual Arrestins

Qiuyan Chen et al. J Mol Biol. .

Abstract

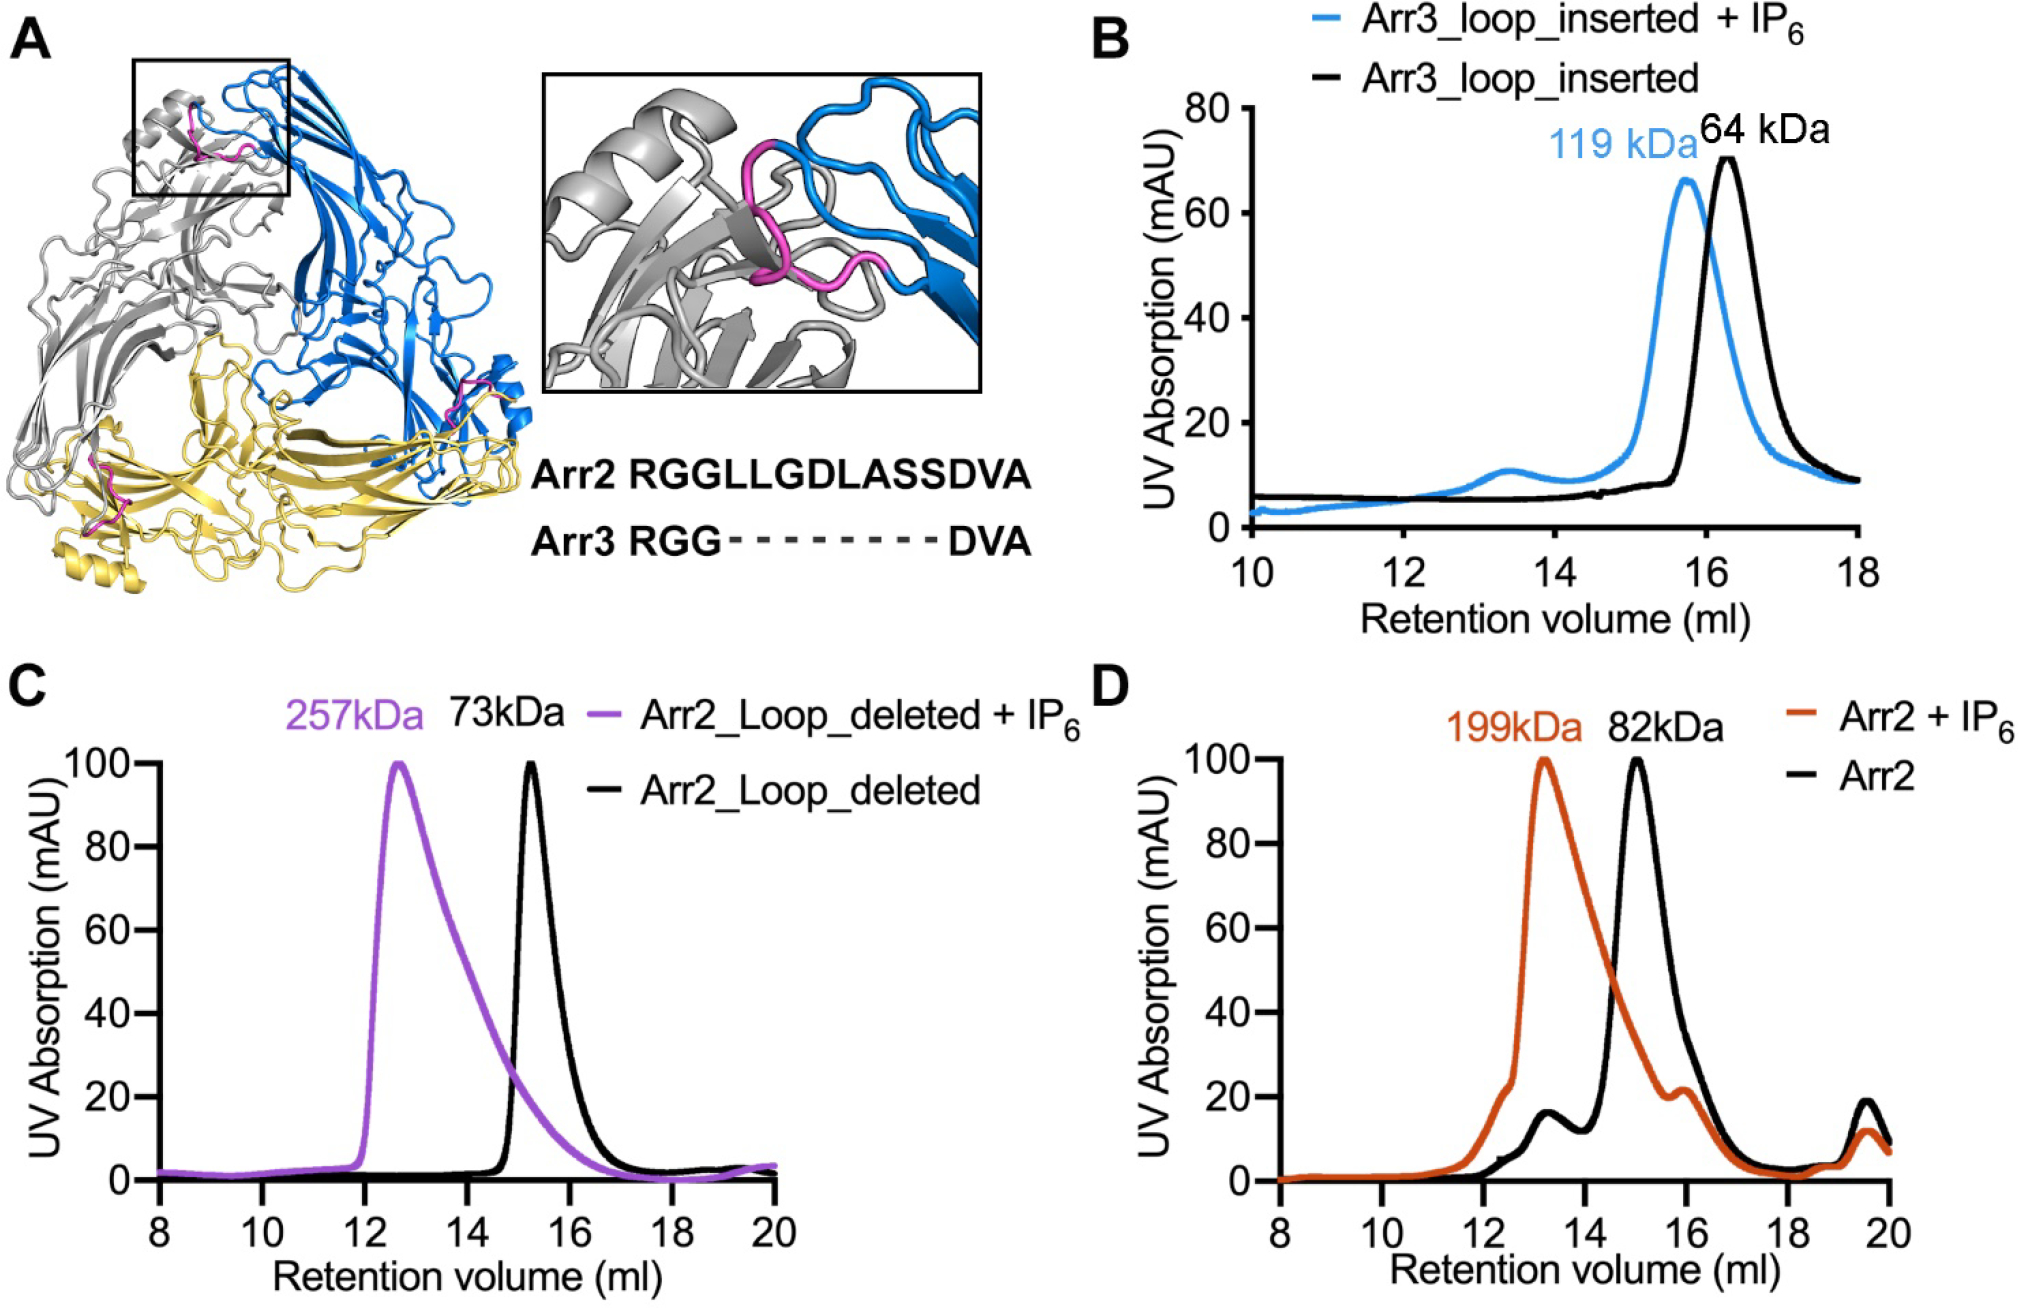
G protein coupled receptors signal through G proteins or arrestins. A long-standing mystery in the field is why vertebrates have two non-visual arrestins, arrestin-2 and arrestin-3. These isoforms are ~75% identical and 85% similar; each binds numerous receptors, and appear to have many redundant functions, as demonstrated by studies of knockout mice. We previously showed that arrestin-3 can be activated by inositol-hexakisphosphate (IP6). IP6 interacts with the receptor-binding surface of arrestin-3, induces arrestin-3 oligomerization, and this oligomer stabilizes the active conformation of arrestin-3. Here, we compared the impact of IP6 on oligomerization and conformational equilibrium of the highly homologous arrestin-2 and arrestin-3 and found that these two isoforms are regulated differently. In the presence of IP6, arrestin-2 forms "infinite" chains, where each promoter remains in the basal conformation. In contrast, full length and truncated arrestin-3 form trimers and higher-order oligomers in the presence of IP6; we showed previously that trimeric state induces arrestin-3 activation (Chen et al., 2017). Thus, in response to IP6, the two non-visual arrestins oligomerize in different ways in distinct conformations. We identified an insertion of eight residues that is conserved across arrestin-2 homologs, but absent in arrestin-3 that likely accounts for the differences in the IP6 effect. Because IP6 is ubiquitously present in cells, this suggests physiological consequences, including differences in arrestin-2/3 trafficking and JNK3 activation. The functional differences between two non-visual arrestins are in part determined by distinct modes of their oligomerization. The mode of oligomerization might regulate the function of other signaling proteins.

Keywords: IP(6); isoforms; oligomer; signaling protein; structure.


Conflict of interest statement

Declaration of Competing Interest The authors declare that they have no known competing financial interests or personal relationships that could have appeared to influence the work reported in this paper.

Figures

Figure 1.
Figure 1.. Comparison of arrestin structures.
A. Active arrestin-3 structure determined in the presence of IP6. B. Basal arrestin-2 structure in the presence of IP6. C. Arrestin-2 with human V2 vasopressin receptor-derived phosphopeptide V2Rpp. D. Arrestin-1 bound to rhodopsin with a C tail replaced with V2Rpp. E. Arrestin-2 in complex with β1-adrenergic receptor with the C-terminal tail replaced with V2Rpp. F. Arrestin-2 in complex with M2 muscarinic receptor with C-terminal tail replaced with V2Rpp. Arrestin C-tail in B is colored deep teal, yellow sticks represent the residues involved in interaction with phosphates and blue dashed lines represent H-bonds.
Figure 2.
Figure 2.. IP6 mediates the oligomerization of arrestin-2 but does not trigger the release of its C tail.
A. One site on the N-domain (position 12) and another site on the C-tail (position 392) were selected for spin labeling to report the distance between the N-domain and C-tail of arrestin-2. The locations of these two sites are shown in basal arrestin-2 (PDB entry 1G4M). B. Plot of the probability of the distances between these two spin labels for 100 μM labeled arrestin-2 (black line), 100 μM labeled arrestin-2 with100 μM IP6 (blue line) or 20 μM labeled, 80 μM unlabeled arrestin-2 with100 μM IP6 (orange line). C. The MALLS data showing that arrestin-2 average molecular weight as the function of arrestin-2 concentration in the presence and absence of 100 μM of IP6.
Figure 3.
Figure 3.. The solution structure of arrestin-2 oligomer in the presence of IP6.
A. IP6 bridges adjacent arrestin-2 monomers to form a chain-like oligomer in the structure of arrestin-2 crystal soaked with IP6 (PDB entry 1ZSH). The buried interface between two adjacent protomers is ~600 Å2. B. Sites selected for spin labeling are shown as spheres on the crystal structure of basal arrestin-2 (PDB entry 1G4M). The sites with inter-subunit distances shorter than 50 Å (L68, V70, L71, L73, V167, Y238, T246), as measured by DEER spectroscopy in the presence of IP6, are colored blue, and the ones with inter-subunit distance longer than 50Å (L33, K49, V81, I158, S234, C269) are colored pink. C. For each mutant, background-corrected X-band DEER spectroscopy dipolar evolution data for arrestin-2 in the presence of excess IP6 are shown. The gray dots represent the data and the black lines indicate the fits to the data that yield distance distributions for each site tested. Distances longer than 50 Å cannot be precisely determined from the dipolar evolution data (see Table 1). The upper dataset (green) for L71R1 was collected in the absence of IP6; no distances were observed.
Figure 4.
Figure 4.. The solution structure of arrestin-3 oligomers in the presence of IP6.
A, B. SEC-MALLS data of purified full-length arrestin-3 in the absence and presence of 100 μM IP6 at the protein concentration of 5.75 μM or 45 μM. Light scattering signals are shown as peaks and the molecular weight as horizontal lines. C. The MALLS data showing that average molecular weight of full-length arrestin-3 as the function of its concentration in the presence and absence of 100 μM of IP6. D. The Kratky plot of full-length arrestin-3 at 45 μM in the absence of IP6. E. The Kratky plot of full-length arrestin-3 at 45 μM in the presence of 100 μM IP6. F. The Kratky plot of arrestin-3-(1–393) at 45 μM in the presence of 100 μM IP6. G. The pair distance distribution analysis of full-length arrestin-3 at 45 μM in the absence of IP6. H. The pair distance distribution analysis of full-length arrestin-3 at 45 μM in the presence of 100 μM IP6. I. The pair distance distribution analysis of arrestin-3-(1–393) at 45 μM in the presence of 100 μM IP6. J. The bead model reconstruction of full-length arrestin-3 at 45 μM in the absence of IP6. The crystal structure of monomeric arrestin-3-(1–393) (PDB entry 3P2D) is docked into the bead model. K. The bead model reconstruction of full-length arrestin-3 at 45 μM in the presence of 100 μM IP6. L. The bead model reconstruction of arrestin-3-(1–393) at 45 μM in the presence of 100 μM IP6. The crystal structure of trimeric arrestin-3-(1–393) in the presence of IP6 (PDB entry 5TV1) is docked into the bead model.
Figure 5.
Figure 5.. The solution structure of arrestin-3 oligomers in the presence of IP6.
A. Sites selected for spin labeling are shown as spheres on crystal structure of basal arrestin-3 (PDB entry 3P2D). The sites with inter-subunit distances shorter than 50 Å (D68, K313), as measured by DEER spectroscopy in the presence of IP6, are colored blue, and the ones with inter-subunit distance longer than 50 Å (K34, F88, Q122, T188, M193, T222, L278) are colored pink. B. For each mutant, background-corrected Q-band DEER spectroscopy dipolar evolution data for arrestin-3 in the presence of excess IP6 are shown. The gray dots represent the data and the black lines indicate the fits to the data that yield distance distributions for each site tested. The dataset (green) for T188R1 was collected in the absence of IP6 and it shows distances different from the ones in the presence of IP6. Distances longer than the upper limits determined by the data collection time are shown as dotted lines.
Figure. 6.
Figure. 6.. An extended loop in arrestin-2 likely accounts for the differences in oligomerization of arrestin-2 and -3.
A. Modeling of arrestin-2 monomer structure (PDB entry 1G4M) into the arrestin-3 trimeric structure (PDB entry 5TV1). The steric clash at the interface is enlarged in the black rectangular box with the extended loop colored magenta. The sequence alignment of this loop between arrestin-2 and -3 is shown. B-D. SEC is employed to assess the oligomerization of the arrestin-3 loop insertion mutant (B), the arrestin-2 loop deletion mutant (C) and the arrestin-2 wild-type (D). B. In the absence of IP6, the loop insertion mutant runs as a monomer with the average molecular weight 64 ± 6 kDa; In the presence of IP6, the loop insertion mutant runs as a dimer with the average molecular weight 119 ± 3 kDa. C. In the absence of IP6, the arrestin-2 loop deletion mutant runs as a monomer with the average molecular weight 73 ± 0.6 kDa; In the presence of IP6, the loop insertion mutant runs as a likely trimer with the average molecular weight 257 ± 17 kDa. D. In the absence of IP6, the arrestin-2 wild-type runs as a monomer with the average molecular weight 82 ± 0.5 kDa; In the presence of IP6, the loop insertion mutant runs with the average molecular weight 199 ± 8 kDa, which does not reflect the heterogenous arrestin-2 chain-like oligomers. This is likely due to that the standard curve for SEC molecular weight estimation was generated with globular proteins.

Similar articles

Cited by

References

    1. Chen Q, Perry NA, Vishnivetskiy SA, Berndt S, Gilbert NC, Zhuo Y, Singh PK, Tholen J, Ohi MD, Gurevich EV, Brautigam CA, Klug KS, Gurevich VV & Iverson TM (2017). Structural basis of arrestin-3 activation and signaling. Nat Commun 8, 1427. - PMC - PubMed
    1. Wilden U (1995). Duration and amplitude of the light-induced cGMP hydrolysis in vertebrate photoreceptors are regulated by multiple phosphorylation of rhodopsin and by arrestin binding. Biochemistry 34, 1446–54. - PubMed
    1. Krupnick JG, Gurevich VV & Benovic JL (1997). Mechanism of quenching of phototransduction. Binding competition between arrestin and transducin for phosphorhodopsin. J Biol Chem 272, 18125–31. - PubMed
    1. Goodman OB Jr., Krupnick JG, Santini F, Gurevich VV, Penn RB, Gagnon AW, Keen JH & Benovic JL (1996). Beta-arrestin acts as a clathrin adaptor in endocytosis of the beta2-adrenergic receptor. Nature 383, 447–50. - PubMed
    1. Laporte SA, Oakley RH, Zhang J, Holt JA, Ferguson s. S. G., Caron MG & Barak LS (1999). The 2-adrenergic receptor/arrestin complex recruits the clathrin adaptor AP-2 during endocytosis. Proc Nat Acad Sci USA 96, 3712–3717. - PMC - PubMed

Publication types

LinkOut - more resources