. 2021 Apr;160(5):1694-1708.e3.
doi: 10.1053/j.gastro.2020.12.059. Epub 2021 Jan 1.

Colonic Epithelial-Derived Selenoprotein P Is the Source for Antioxidant-Mediated Protection in Colitis-Associated Cancer

Affiliations

Colonic Epithelial-Derived Selenoprotein P Is the Source for Antioxidant-Mediated Protection in Colitis-Associated Cancer

Sarah P Short et al. Gastroenterology. 2021 Apr.

Abstract

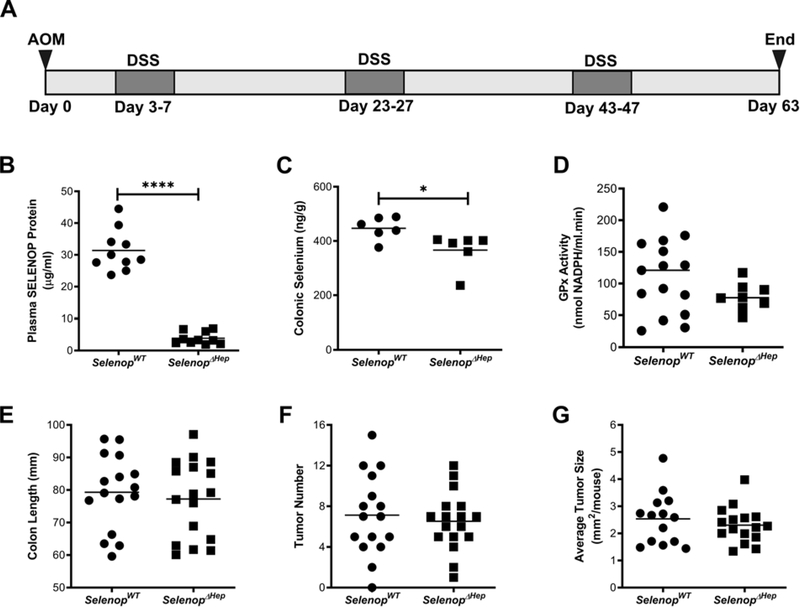
Background & aims: Patients with inflammatory bowel disease (IBD) demonstrate nutritional selenium deficiencies and are at greater risk of developing colon cancer. Previously, we determined that global reduction of the secreted antioxidant selenium-containing protein, selenoprotein P (SELENOP), substantially increased tumor development in an experimental colitis-associated cancer (CAC) model. We next sought to delineate tissue-specific contributions of SELENOP to intestinal inflammatory carcinogenesis and define clinical context.

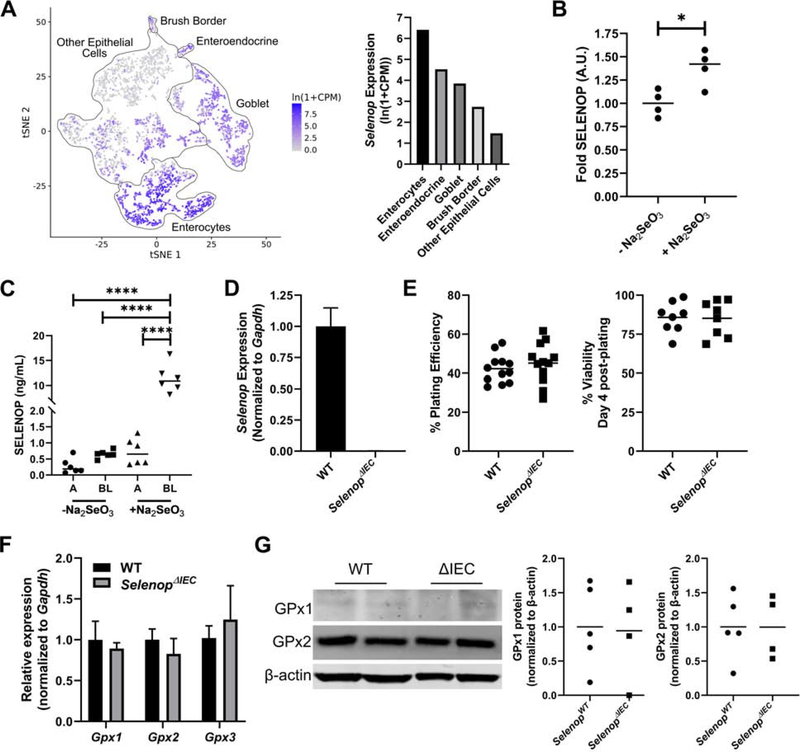
Methods: Selenop floxed mice crossed with Cre driver lines to delete Selenop from the liver, myeloid lineages, or intestinal epithelium were placed on an azoxymethane/dextran sodium sulfate experimental CAC protocol. SELENOP loss was assessed in human ulcerative colitis (UC) organoids, and expression was queried in human and adult UC samples.

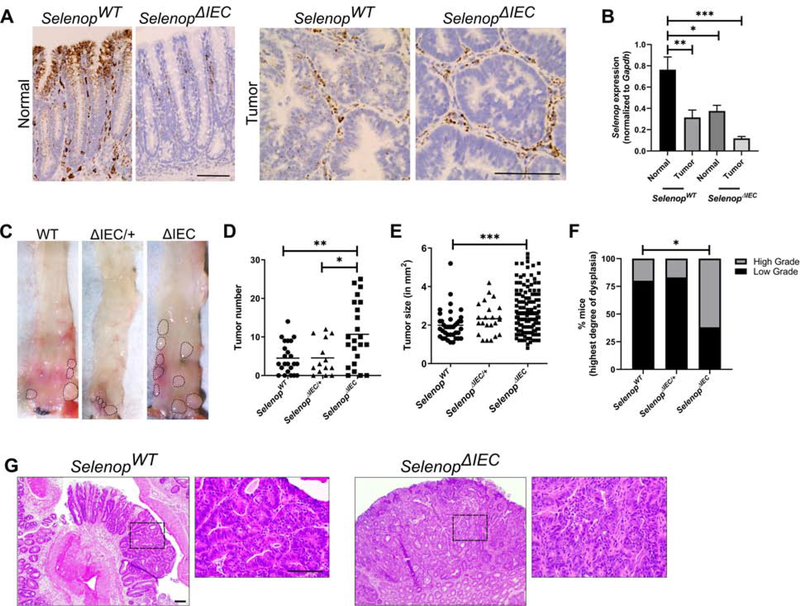
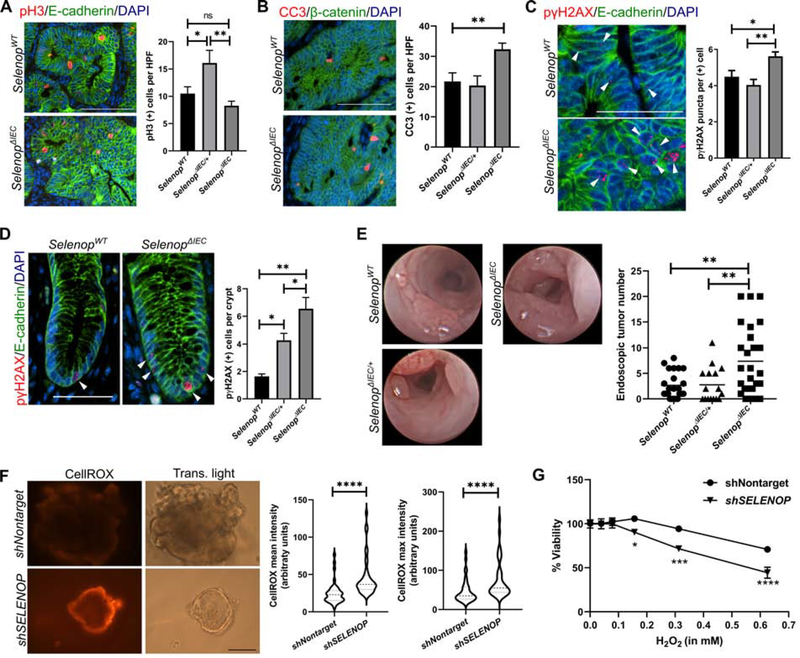
Results: Although large sources of SELENOP, both liver- and myeloid-specific Selenop deletion failed to modify azoxymethane/dextran sodium sulfate-mediated tumorigenesis. Instead, epithelial-specific deletion increased CAC tumorigenesis, likely due to elevated oxidative stress with a resulting increase in genomic instability and augmented tumor initiation. SELENOP was down-regulated in UC colon biopsies and levels were inversely correlated with endoscopic disease severity and tissue S100A8 (calprotectin) gene expression.

Conclusions: Although global selenium status is typically assessed by measuring liver-derived plasma SELENOP levels, our results indicate that the peripheral SELENOP pool is dispensable for CAC. Colonic epithelial SELENOP is the main contributor to local antioxidant capabilities. Thus, colonic SELENOP is the most informative means to assess selenium levels and activity in IBD patients and may serve as a novel biomarker for UC disease severity and identify patients most predisposed to CAC development.

Keywords: Colitis-Associated Cancer; Reactive Oxygen Species; Selenium; Selenoproteins.


Conflict of interest statement

Disclosures: The authors declare no competing interest.

Figures

Figure 1.
Figure 1.. Liver-specific loss of SELENOP does not modify inflammatory tumorigenesis.
(A) Cohorts of SelenopWT and SelenopΔHep mice were placed on an AOM/DSS inflammatory colitis protocol consisting of 3 cycles of 4-day DSS treatment followed by 16 days of recovery. (B) Total SELENOP protein was assessed from plasma of SelenopWT and SelenopΔHep mice (n=10/genotype). (C) Total selenium (n=6/genotype) and (D) GPx activity (n=15 SelenopWT and n=8 SelenopΔHep) measured from non-tumor colonic tissue. (E) Colon length, (F) gross tumor number, and (G) gross tumor size (n=16 SelenopWT and 17 SelenopΔHep). Tumor size was measured with calipers and numbers represent tumor length × tumor width averaged per mouse. *P<0.05, ****P<0.0001, Student’s t test.
Figure 2.
Figure 2.. SELENOP is expressed in colonic macrophages and modifies migration.
(A) Selenop mRNA was detected by RNAscope. Negative control probe shown on left. Inset areas marked by dotted lines. Scale bar = 50μm. (B) qPCR of Selenop expression in BMDM (n=3) and whole colon tissue (n=3) as compared to liver (n=4) and brain tissue (n=4). Selenop levels were normalized to Gapdh and represented as fold change over liver expression. (C) Representative image (left) and quantification (right) of multiplex RNAscope for Selenop (green) and Cd68 (red) in murine colon tissue. Results represented as percent co-labeled Selenop (+) stromal cells per high powered field (n=15). Scale bar = 25μm. (D) Selenop expression was assessed by qPCR in BMDM established from SelenopWT, SelenopΔMye/+, and SelenopΔMye mice (n=2/genotype with 3 technical replicates). (E) BMDM were plated on transwell filters and allowed to migrate over 72 hours. Representative images (left) and quantification (right). For quantification, the number of migrated cells was assessed over 5 low power images per well and combined to yield the number of migrated cells. Results are combined data points from 3 independent experiments, each containing 3 technical replicates, represented as fold change over SelenopWT. (F) qPCR analysis of matrix-associated genes, biglycan/Bgn, transgelin/Tagln, and tissue inhibitor of metalloproteinases 3/Timp3 and (G) Gpx1 and Gpx3 (n=4/genotype with 3 technical replicates). (H) GPx1 protein assessed from BMDM. Representative results (left) and quantification normalized to tubulin and represented as fold change over SelenopWT (right) (n=5 SelenopWT, 4 SelenopΔMye/+, and 5 SelenopΔMye). *P<0.05, **P<0.01, ****P<0.0001, Student’s t test (C) or one-way ANOVA with Tukey’s multiple comparisons test (D-H). For all qPCR analysis, results were normalized to Gapdh and represented as fold change over SelenopWT.
Figure 3.
Figure 3.. Inflammatory tumorigenesis is not altered by myeloid-specific Selenop knockout.
(A) Selenop RNAscope in SelenopWT and SelenopΔMye mice. Scale bar = 50μm. (B) Cohorts of SelenopWT (n=23), SelenopΔMye/+ (n=25) and SelenopΔMye (n=29) mice were placed on the AOM/DSS protocol. Tumor incidence, (C) gross tumor number, and (D) gross tumor size as measured with calipers and shown as tumor length × width (n=91 SelenopWT, 126 SelenopΔMye/+, and 121 SelenopΔMye tumors). (E) Non-tumor AOM/DSS tissues were stained with F4/80 to label macrophages, and infiltrated cells were quantified per crypt. (F) Tumor sections were stained for F4/80 to label macrophages or (G) Ly6B.2 to label neutrophils. Intratumoral immune cells were quantified per high powered field (HPF). (H) Quantification of histologic injury scores accounting for depth and percent of colonic involvement (n=7 SelenopWT, 8 SelenopΔMye/+, and 8 SelenopΔMye mice). n≥24 fields for all imaging studies. **P<0.01, one-way way ANOVA with Tukey’s multiple comparisons test.
Figure 4.
Figure 4.. SELENOP is expressed in intestinal epithelial cells but its loss does not modify baseline intestinal cell homeostasis.
(A) Selenop expression queried from the Tabula Muris public single cell sequencing data set. tSNE plot with outlines of intestinal cell populations (left) and mean Selenop expression levels of each cell population (right). (B) Human patient-derived colonoids were treated overnight with 0.5μM sodium selenite (Na2SeO3) and SELENOP was detected from concentrated culture media. n=2 independent colonoid lines, run in duplicate. (C) Caco-2 BBe1 cells were polarized on transwell filters and SELENOP was measured from apical (A) and basolateral (BL) medias with and without overnight stimulation with 0.5μM sodium selenite. n=2 independent experiments, run in triplicate. (D) Organoids were established from colonic tissue of SelenopWT and SelenopΔIEC mice and Selenop expression was queried by qPCR. (E) Plating efficiency as calculated by dividing the numbers of colonoids formed by number of crypts plated (left) and viability of established colonoids at day 4 post-plating (right). (F) Colonoid Gpx1, Gpx2, and GPx3 mRNA expression quantified via qPCR. Results were normalized to Gapdh and represented as fold change over SelenopWT. (G) Colonoid GPx1 and GPx2 protein expression with β-actin provided as loading control (left) and quantification following normalization (right). n≥3 independent colonoid lines/genotype for D-G. *P<0.05, ****P<0.0001, one-way ANOVA with Tukey’s multiple comparisons test (B, C) or Student’s t test (E-G).
Figure 5.
Figure 5.. Epithelial-specific Selenop loss augments inflammatory tumorigenesis.
(A) Cohorts of SelenopWT (n=23), SelenopΔIEC/+ (n=15), and SelenopΔIEC (n=23) mice were placed on the AOM/DSS inflammatory tumorigenesis protocol. Selenop mRNA expression was detected in adjacent non-tumor (left) and tumor tissues (right) by RNAScope. (B) Selenop qPCR (n=6 non-tumor and 5 tumor samples/genotype with 3 technical replicates). (C) Gross tumor images, (D) tumor number, and (E) tumor size as measured with calipers and represented as length × width. (F) Degree of tumor dysplasia as assessed by pathologist. Data represented as percentage of mice with at least one tumor showing high-grade dysplasia (n=14 SelenopWT, 11 SelenopΔIEC/+, and 16 SelenopΔIEC samples). (G) Representative hematoxylin and eosin stained images. Area of enlargement noted by dotted lines. Scale bar = 50μm. *P<0.05, **P<0.01, ***P<0.001, one-way ANOVA with Tukey’s multiple comparisons test (B, D, E) or chi-squared test (F, WT vs. ΔIEC).
Figure 6.
Figure 6.. Epithelial Selenop loss increases DNA damage and tumor initiation.
(A) Representative images (left) and quantification (right) of proliferative tumor cells by staining for phospho-histone H3 (pH3, red). Cells were co-labeled with E-cadherin (green) and DAPI (blue). (B) Representative images (left) and quantification (right) of intratumoral apoptosis by staining for cleaved caspase 3 (CC3, red) co-labeled with β-catenin (green) and DAPI (blue). n=29 SelenopWT, 8 SelenopΔIEC/+, and 35 SelenopΔIEC HPFs for A and B. Scale bar = 50μm. (C) Representative images (arrowheads, left) and quantification (right) of intratumoral DNA damage by staining for phospho-γH2AX (pγH2AX, red) co-labeled with E-cadherin (green) and DAPI (blue). Quantification is represented as number of staining puncta per positive cell (n>200 cells/genotype). Scale bar = 25μm. (D) Representative images (arrowheads, left) and quantification (right) of phospho-γH2AX staining in adjacent non-tumor tissue represented as positive cells per crypt (n=74 SelenopWT, 28 SelenopΔIEC/+, and 65 SelenopΔIEC crypts). Scale bar = 25μm. (E) Representative endoscopy stills (left) and quantification (right) of tumor number after the second DSS cycle (n=19 SelenopWT, 16 SelenopΔIEC/+, and 27 SelenopΔIEC). (F) SELENOP knockdown (shSELENOP) and control (shNontarget) human UC organoids were stained with CellROX Orange to detect ROS. Representative images (left) and quantification (right) of mean and maximum intensities by ImageJ, represented as arbitrary units (n=3 independent experiments, 39 images total). Scale bar = 50μm. (G) Nontargeted and shSELENOP UC organoids were treated overnight with H2O2. Viability was assessed after 24 hours by CellTiter-Blue and normalized to pre-treatment readings (n=2 independent experiments with 3 technical replicates). *P<0.05, **P<0.01, ***P<0.001, ****P<0.0001, one-way ANOVA with Tukey’s multiple comparisons test (A-E), Student’s t test (F), or two-way ANOVA (G).
Figure 7.
Figure 7.. SELENOP is reduced in human UC and is inversely associated with disease severity.
(A) Expression of SELENOP and other antioxidant selenoproteins queried from the PROTECT cohort. (B) Log-transformed SELENOP expression stratified by clinical severity scores (n=20 control, 54 mild UC, and 152 moderate-severe UC samples). (C) Log-transformed SELENOP expression in transcripts per million (TPM) correlated to log-transformed expression of a component of the inflammatory marker calprotectin, S100A8. (D) SELENOP expression was visualized by RNAscope in resected normal (n=6) and UC colonic tissues (n=5). Staining intensity was scored from 0–4 in both epithelial and myeloid populations. Quantification and (E) representative images. Dotted lines = inset area, red arrowheads = differentiated epithelium, blue arrowheads = myeloid cells, scale bars = 100μm. (F) SELENOP expression was visualized by RNAscope in a TMA containing UC tissues without active disease (uninvolved, n=8) or colitis with no dysplasia (colitis, n=51), low-grade dysplasia (LGD, n=74), high-grade dysplasia (HGD, n=24), and cancer (CAC, n=28). Staining was scored separately in epithelial (left) and myeloid populations (right). *P<0.05, **P<0.01, ****P<0.0001, one-way ANOVA followed by post-test for linear trend (B), Pearson’s correlation coefficient (C), Mann-Whitney test (D) or one-way ANOVA with Tukey’s multiple comparisons test (F). For F, * = significance vs. normal, § = significance vs. colitis, and # = significance vs. LGD.

References

    1. Short SP, Pilat JM, Williams CS. Roles for selenium and selenoprotein P in the development, progression, and prevention of intestinal disease. Free Radic Biol Med 2018;127:26–35. - PMC - PubMed
    1. Baum MK, Shor-Posner G, Lai S, et al. High risk of HIV-related mortality is associated with selenium deficiency. J Acquir Immune Defic Syndr Hum Retrovirol 1997;15:370–4. - PubMed
    1. Gladyshev VN, Stadtman TC, Hatfield DL, et al. Levels of major selenoproteins in T cells decrease during HIV infection and low molecular mass selenium compounds increase. Proc Natl Acad Sci U S A 1999;96:835–9. - PMC - PubMed
    1. Beck MA, Williams-Toone D, Levander OA. Coxsackievirus B3-resistant mice become susceptible in Se/vitamin E deficiency. Free Radic Biol Med 2003;34:1263–70. - PubMed
    1. Beck MA, Shi Q, Morris VC, et al. Rapid genomic evolution of a non-virulent coxsackievirus B3 in selenium-deficient mice results in selection of identical virulent isolates. Nat Med 1995;1:433–6. - PubMed

Publication types

MeSH terms

Supplementary concepts

LinkOut - more resources