Time in Range from Continuous Glucose Monitoring: A Novel Metric for Glycemic Control
- PMID: 33389957
- PMCID: PMC7801761
- DOI: 10.4093/dmj.2020.0257
Time in Range from Continuous Glucose Monitoring: A Novel Metric for Glycemic Control
Erratum in
-
Time in Range from Continuous Glucose Monitoring: A Novel Metric for Glycemic Control.Diabetes Metab J. 2021 Sep;45(5):795. doi: 10.4093/dmj.2021.0256. Epub 2021 Sep 30. Diabetes Metab J. 2021. PMID: 34610725 Free PMC article. No abstract available.
Abstract
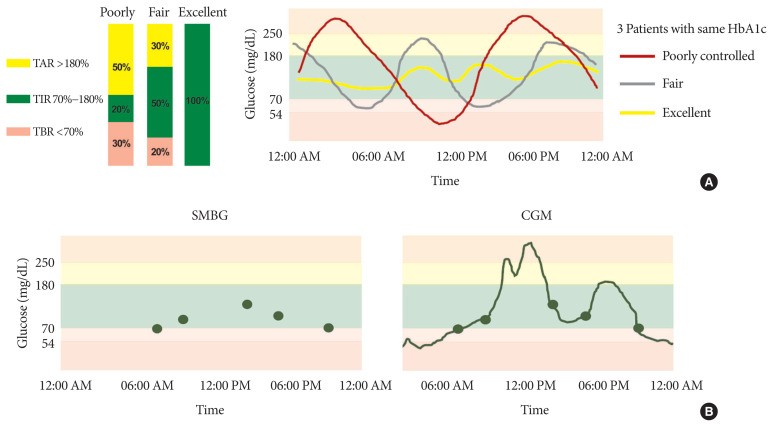
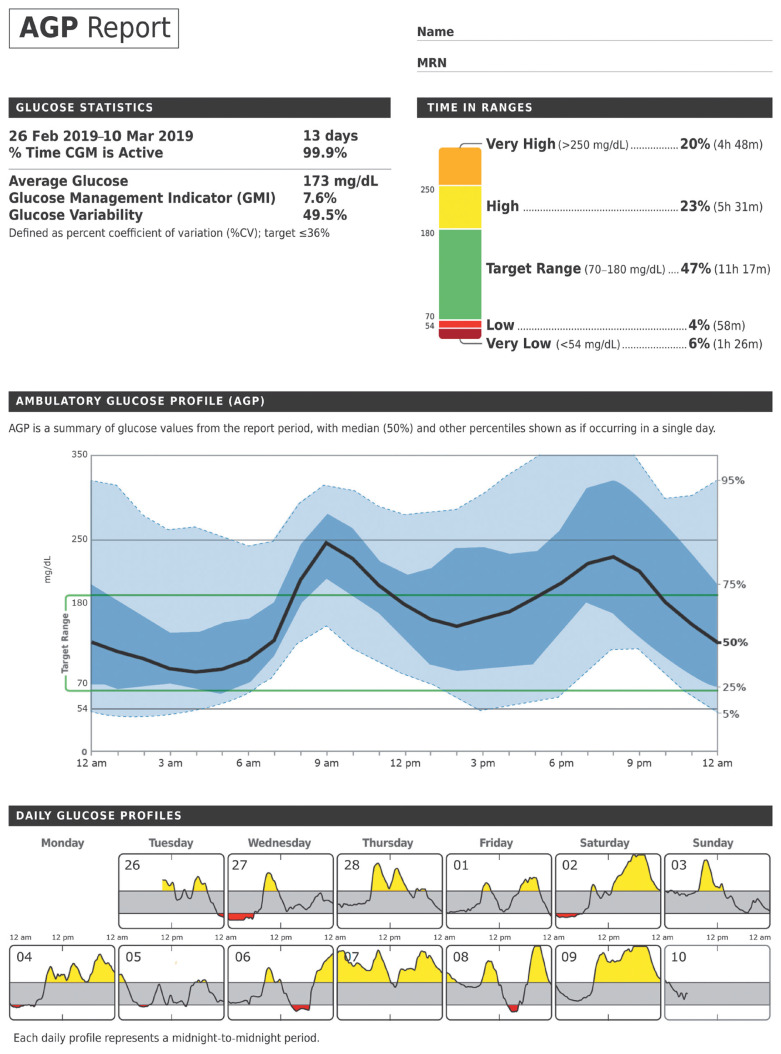
Glycosylated hemoglobin (HbA1c) has been the sole surrogate marker for assessing diabetic complications. However, consistently reported limitations of HbA1c are that it lacks detailed information on short-term glycemic control and can be easily interfered with by various clinical conditions such as anemia, pregnancy, or liver disease. Thus, HbA1c alone may not represent the real glycemic status of a patient. The advancement of continuous glucose monitoring (CGM) has enabled both patients and healthcare providers to monitor glucose trends for a whole single day, which is not possible with HbA1c. This has allowed for the development of core metrics such as time spent in time in range (TIR), hyperglycemia, or hypoglycemia, and glycemic variability. Among the 10 core metrics, TIR is reported to represent overall glycemic control better than HbA1c alone. Moreover, various evidence supports TIR as a predictive marker of diabetes complications as well as HbA1c, as the inverse relationship between HbA1c and TIR reveals. However, there are more complex relationships between HbA1c, TIR, and other CGM metrics. This article provides information about 10 core metrics with particular focus on TIR and the relationships between the CGM metrics for comprehensive understanding of glycemic status using CGM.
Keywords: Blood glucose; Blood glucose self-monitoring; Diabetes complications; Glycated hemoglobin A.
Conflict of interest statement
No potential conflict of interest relevant to this article was reported.
Figures

References
-
- Diabetes Control and Complications Trial Research Group. Nathan DM, Genuth S, Lachin J, Cleary P, Crofford O, Davis M, Rand L, Siebert C. The effect of intensive treatment of diabetes on the development and progression of long-term complications in insulin-dependent diabetes mellitus. N Engl J Med. 1993;329:977–86. - PubMed
-
- UK Prospective Diabetes Study (UKPDS) Group. Intensive blood-glucose control with sulphonylureas or insulin compared with conventional treatment and risk of complications in patients with type 2 diabetes (UKPDS 33) Lancet. 1998;352:837–53. - PubMed
-
- Action to Control Cardiovascular Risk in Diabetes Study Group. Gerstein HC, Miller ME, Byington RP, Goff DC, Jr, Bigger JT, Buse JB, Cushman WC, Genuth S, Ismail-Beigi F, Grimm RH, Jr, Probstfield JL, Simons-Morton DG, Friedewald WT. Effects of intensive glucose lowering in type 2 diabetes. N Engl J Med. 2008;358:2545–59. - PMC - PubMed
Publication types
MeSH terms
Substances
LinkOut - more resources
Full Text Sources
Medical