. 2021 May;5(5):467-480.
doi: 10.1038/s41551-020-00665-x. Epub 2021 Jan 4.

Pathogen-specific antimicrobials engineered de novo through membrane-protein biomimicry

Affiliations

Pathogen-specific antimicrobials engineered de novo through membrane-protein biomimicry

Andrew W Simonson et al. Nat Biomed Eng. 2021 May.

Abstract

Precision antimicrobials aim to kill pathogens without damaging commensal bacteria in the host, and thereby cure disease without antibiotic-associated dysbiosis. Here we report the de novo design of a synthetic host defence peptide that targets a specific pathogen by mimicking key molecular features of the pathogen's channel-forming membrane proteins. By exploiting physical and structural vulnerabilities within the pathogen's cellular envelope, we designed a peptide sequence that undergoes instructed tryptophan-zippered assembly within the mycolic acid-rich outer membrane of Mycobacterium tuberculosis to specifically kill the pathogen without collateral toxicity towards lung commensal bacteria or host tissue. These mycomembrane-templated assemblies elicit rapid mycobactericidal activity and enhance the potency of antibiotics by improving their otherwise poor diffusion across the rigid M. tuberculosis envelope with respect to agents that exploit transmembrane protein channels for antimycobacterial activity. This biomimetic strategy may aid the design of other narrow-spectrum antimicrobial peptides.


Conflict of interest statement

Competing interests

The authors declare no competing interests.

Figures

Fig. 1 |
Fig. 1 |. Biomimetic design and biophysical analysis of MAD1.
a, Model of the MspA porin docked in a rendering of the mycobacterial cell envelope (PDB structure 1UUN). b, Concentric rings of tryptophan residues (red) circumscribing the porin head is key to MspA’s ability to anchor at the mycolipid-water interface. Inset: Model of MspA viewed from above (red = tryptophan, blue = basic residues). c, Highlighted protein sub-unit of the MspA rim domain. d, Minimized model of a MAD1 helix (left: axial view; right: side view; red = tryptophan, blue = basic residues). The peptide mimics the facially amphiphilic character and extended terminal basic residues of the MspA rim subunit. e, f, Circular dichroism spectra of MAD1 at (e) physiologic pH (7.4; inset magnifies signal from 200 – 220 nm) or (f) as a function of decreasing pH from 10.5 (red) to 4.5 (purple). g, TEM micrograph of MAD1 nanofibrillar assembles (pH 4.5). Scale bar = 100 nm. Representative micrograph shown from three independent experiments with similar results. Two additional images from replicate experiments are shown in Supplementary Fig. 4. Inset: Histogram of lateral fibril width (n = 50). h, pH-dependent change in the molar ellipticity of MAD1 at 212nm (●, purple) or 228nm (■, orange). i, Temperature-dependent change in MAD1 molar ellipticity at 212nm (●, purple) or 228nm (■, orange). Closed symbols represent temperature ramp up, and open symbols the reverse temperature ramp down, of n = 3 technical replicates.
Fig. 2 |
Fig. 2 |. Atomistic mechanisms of MAD1 assembly.
a, Structure (left) of the MAD1 peptide at pH 7 (blue) and pH 5.5 (orange), and profile of MAD1 dynamics as root mean square fluctuations at each residue over simulation at equilibrium (right). b, Volume-constant specific heat of MAD1 monomer at pH 7 (blue) and pH 5.5 (orange). c, Root mean square fluctuations (left) at each residue of MAD1 pentameric assembly. Data shown are mean ± S.E.M. over 10 independent simulations. Vertical dashed lines separate individual monomers. As expected, we note peaks of increased fluctuation at peptide N- and C-termini. Box-whisker plot (right) of pairwise root mean square deviation comparison between consensus structures of 10 randomized simulation iterations of MAD1 pentameric assembly (45 comparisons total for each pH). The box bounds the interquartile range (acid: [11.51 Å – 13.60 Å], neutral: [11.32 Å – 13.79 Å]), with centerline being the median (acid: 12.54 Å, neutral: 12.49 Å). Whiskers extend to the adjacent values that lie within 1.5 x interquartile range beyond the box. Points lying outside the whiskers are outliers. d, Heat map of residue-residue contact frequencies in MAD1 pentamer assembly at pH 7 (upper diagonal) and pH 5.5 (lower diagonal). e, Heat map of tryptophan-tryptophan contact frequencies in MAD1 pentamer assembly at pH 7 (upper diagonal) and pH 5.5 (lower diagonal). f, Normalized histogram of potential energies of structures occurring at energetic transition at pH 5.5 (left) and pH 7 (right). Peaks represent discrete energetic transition states, with representative structures of each energetic state pictured over each peak.
Fig. 3 |
Fig. 3 |. Ex cellulo analysis of MAD1 myco-membrane specificity.
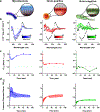
a, Schematic of mycobacterial, Gram-positive and Gram-negative outer membrane structures. b, CD spectrum of MAD1 in the presence of model liposomal membrane analogues. Peptide spectra at t = 0 represented in open black circles, and t → 90 min. shown as increasing lighter shades of color. c, Magnitude change in MAD1 β-sheet secondary structure (Δ2°sh) over time, derived from CD spectra shown in panel a. Dotted line demarcates complete loss of sheet-rich architectures. d, Fractional disruption of model microbial membranes determined by optical density (OD600) at 20 μM MAD1. Measurements normalized to unextruded lipids as a positive control. Symbols represent mean value; shaded regions report S.E.M. Statistical significance of final OD600 measurement (90 min.) for myco-membrane data (blue) determined using a two-tailed Student’s t-test relative to peak disruption (4 min.). n ≥ 3 for all experiments, with representative CD spectra shown.
Fig. 4 |
Fig. 4 |. In situ characterization of Mtb envelope disruption by MAD1.
a, Relative membrane integrity of Mtb after a 45 min. incubation in the absence (untreated, UNT) or presence (x MIC) of increasing MAD1 concentrations, as determined by NPN fluorescence. Digitonin (DIG) included as a positive lytic control. Bars represent mean ± S.E.M., with individual data points overlayed (n = 10 biologically independent samples across two independent experiments). Statistical significance determined using a one-tailed Student’s t-test relative to untreated control, with p values reported or * indicating p < 0.001. n.s. = not statistically significant. b, Circuit diagram utilized to model system impedance for IS experiments. Total impedance is comprised of solution resistance (Rsol), cell envelope resistance (Renv), cell envelope capacitance (Cenv), cytoplasmic resistance (Rcyt), and double-layer capacitance (Cdl). c, Left: Percent change of solution impedance (ΔZ @ 39.1 kHz) in the absence (Mtb) or presence (Mtb + MAD1) of MAD1 at 1 x MIC. In the absence of cells, total impedance is dominated by Rsol and Cdl. Right: Percent change in cell envelope impedance (ΔZ @ 1.95 MHz) in the absence or presence of MAD1 at 1 x MIC. Processed impedance spectra, and associated raw data, are shown in Supplementary Figs. 11 and 12, respectively. Individual data points shown as open circles (n = 5, representing three biologically independent samples), and bars represent mean ± S.E.M. Statistical significance determined relative to untreated control, with p values reported from a one-tailed Student’s t-test. d, SEM and e, TEM micrographs of Mtb cells before (0 x MIC) and after treatment with MAD1 at 0.1 x or 5 x MIC. Scale bar = 0.5 μm. Right: Magnified and false-colored EM images of the Mtb (d) outer surface (green = Mtb cell envelope, red = MAD1 supramolecular structures) and (e) cellular cross-section following treatment with 5 x MIC MAD1 (green = Mtb cytoplasm, yellow = intracellular leakage, white space = delaminated cell wall). Panel d inset: histogram of MAD1 cylindrical assembly width (n = 50); dashed line shows the reported diameter of the MspA porin. Scale bar = 100 nm. Representative micrographs in panels d and e are taken from three independent experiments, with similar results. Additional SEM and TEM images from replicate experiments are shown in Supplementary Figures 14 and 17, respectively.
Fig. 5 |
Fig. 5 |. MAD1 polymicrobial selectivity and combinatorial synergy.
a, Relative membrane integrity of Mtb cells in the absence (untreated) or presence (x MIC) of increasing MAD1 concentrations. Membrane disruption quantified by auramine-rhodamine staining in a polymicrobial co-culture of Mtb with S. aureus and K. pneumoniae. Bars represent mean ± S.E.M. and statistical significance determined via a two-tailed Student’s t-test relative to untreated control, with * indicating p < 0.001 (n = 135 cells measured across three independent experiments). n.s. = not statistically significant. b, Polymicrobial growth curves monitoring the proliferation of each bacterial strain in the absence (●) or presence (○) of MAD1 at 4 × MICMtb, shown as mean ± S.D. with n = 12 biologically independent samples across two independent experiments. c, Cytotoxicity of MAD1 against pathophysiologically relevant mammalian cell lines, including human normal lung epithelium (NL20), human monocytes (THP-1), murine macrophages (RAW 264.7; n = 36 biologically independent samples across three independent experiments), and vascular endothelial cells (HUVEC), shown as mean ± S.D. with n = 12 biologically independent samples across two independent experiments, unless otherwise specified. d, Cell count of M. tuberculosis H37Ra infected murine macrophages (RAW 264.7) treated with increasing concentrations of MAD1 for 24 hours (black bars; n = 6 across two independent experiments). Macrophage viability at equivalent MAD1 concentrations shown as grey bars (n = 12 biologically independent samples across two independent experiments). Data presented as mean ± S.E.M. Statistical significance determined using a one-tailed Student’s t-test relative to untreated control, with p values reported. e, Combinatorial synergy of MAD1 with first-line TB antibiotics isoniazid (INH), ethambutol (EMB) and rifampicin (RIF), as well as the second line anti-tubercular drug moxifloxacin (MOX). Fractional inhibition concentration (FIC) <1 and <0.5 are considered additive and synergistic, respectively. Data is presented as the FIC contribution of MAD1 against the contribution from the small molecule antibiotic.

References

    1. Blaser MJ Antibiotic use and its consequences for the normal microbiome. Science 352, 544–545 (2016). - PMC - PubMed
    1. Brito IL et al. Mobile genes in the human microbiome are structured from global to individual scales. Nature 535, 435–439 (2016). - PMC - PubMed
    1. Smillie CS et al. Ecology drives a global network of gene exchange connecting the human microbiome. Nature 480, 241 (2011). - PubMed
    1. Levy M, Blacher E & Elinav E Microbiome, metabolites and host immunity. Curr. Opin. Microbiol 35, 8–15 (2017). - PubMed
    1. Levy M, Kolodziejczyk AA, Thaiss CA & Elinav E Dysbiosis and the immune system. Nat. Rev. Immunol 17, 219 (2017). - PubMed

Publication types

LinkOut - more resources