Clinical Trial
. 2020 Dec 16:11:610300.
doi: 10.3389/fimmu.2020.610300. eCollection 2020.

Different Innate and Adaptive Immune Responses to SARS-CoV-2 Infection of Asymptomatic, Mild, and Severe Cases

Affiliations
Clinical Trial

Different Innate and Adaptive Immune Responses to SARS-CoV-2 Infection of Asymptomatic, Mild, and Severe Cases

Rita Carsetti et al. Front Immunol. .

Abstract

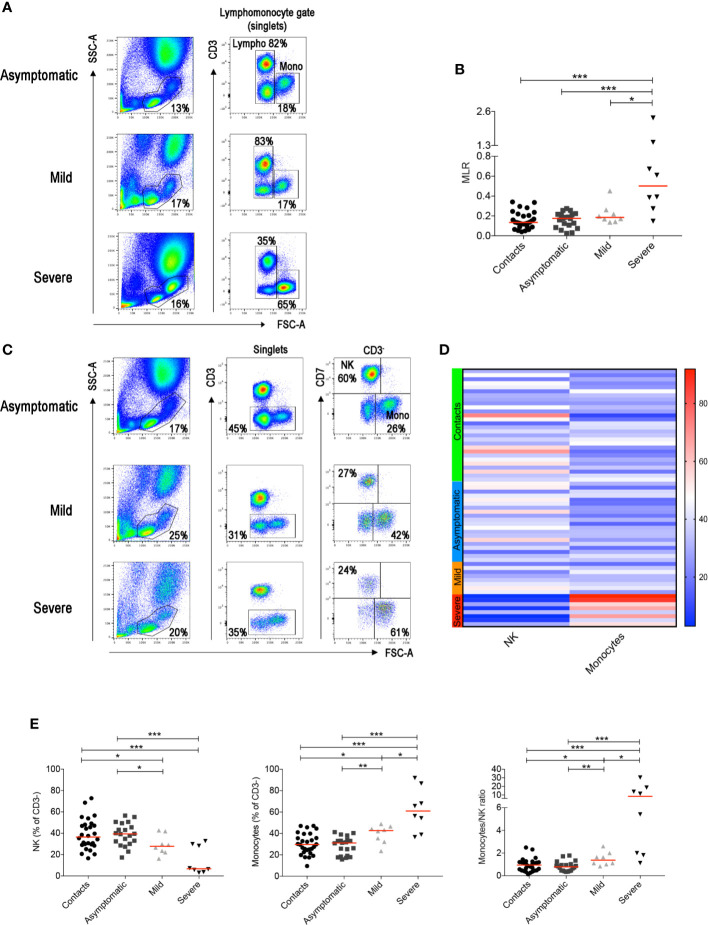
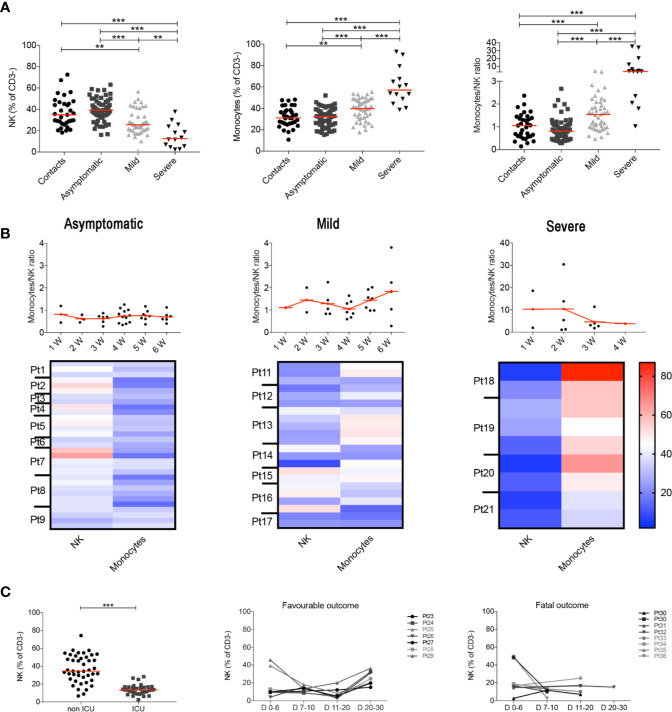
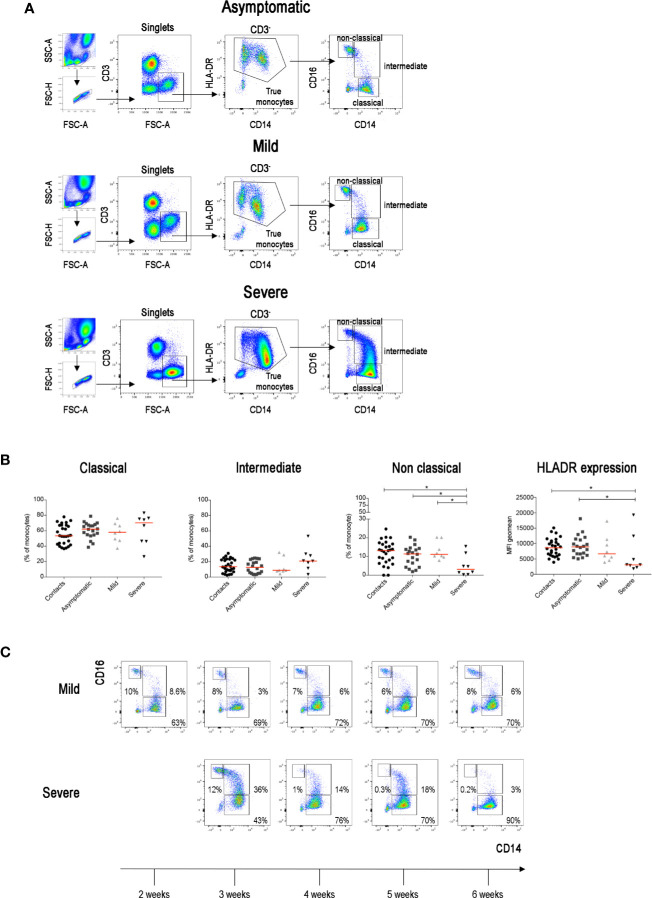
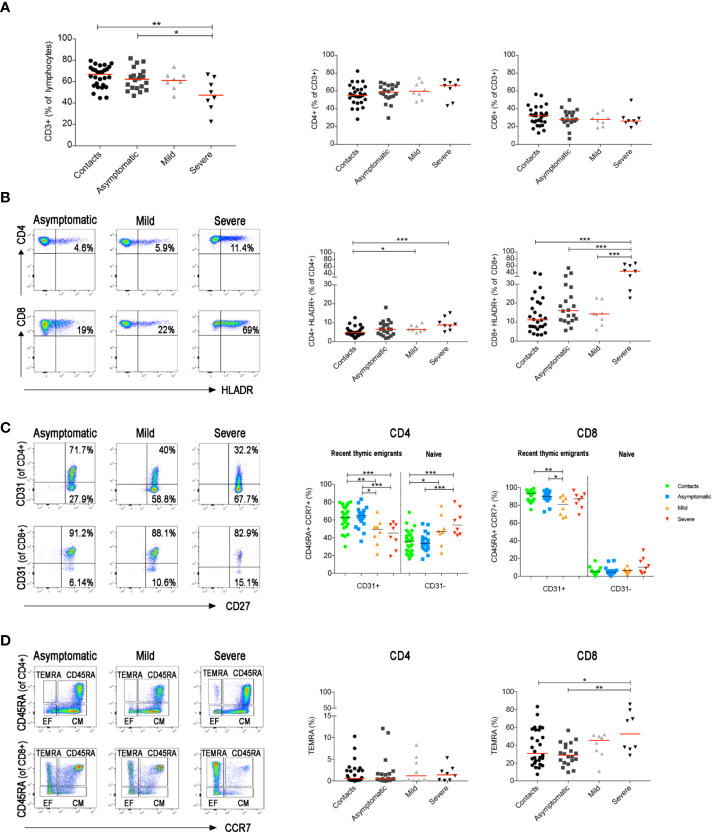
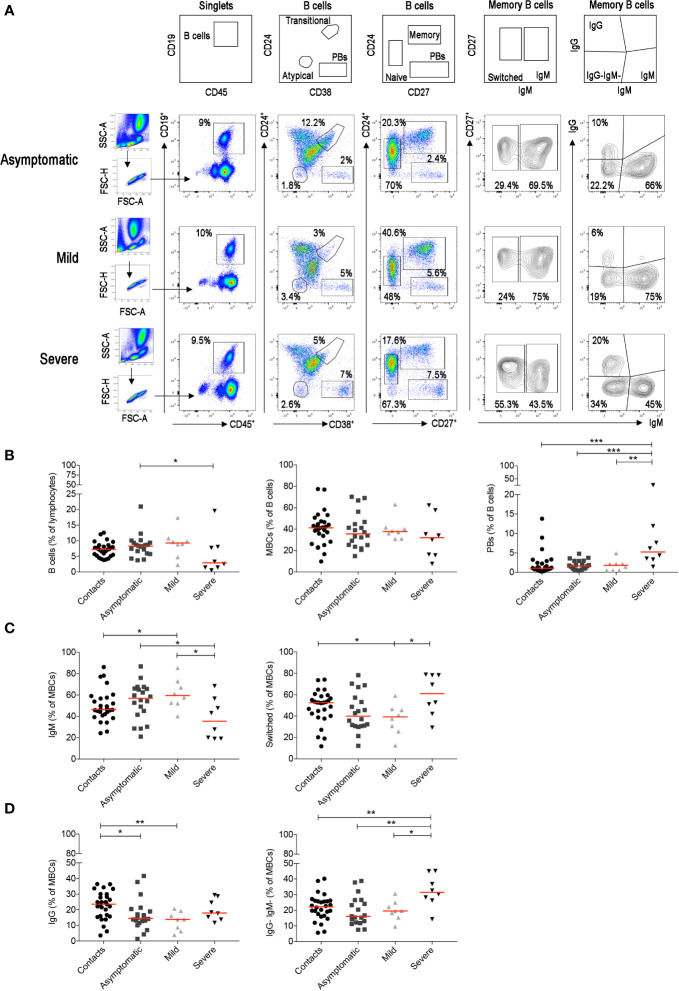
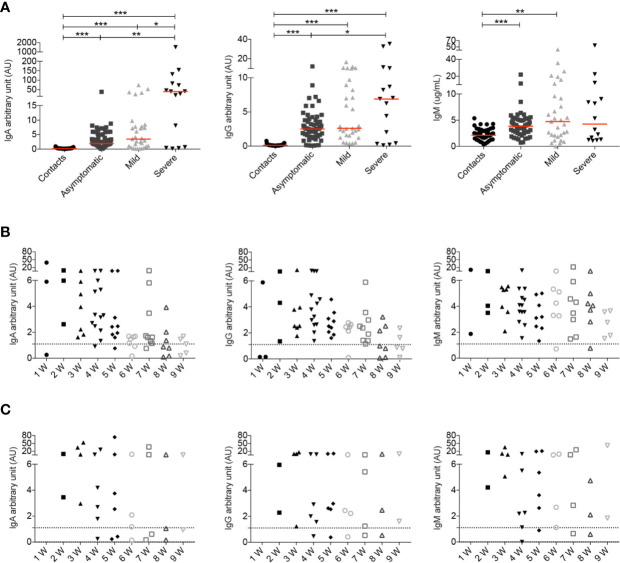
SARS-CoV-2 is a novel coronavirus, not encountered before by humans. The wide spectrum of clinical expression of SARS-CoV-2 illness suggests that individual immune responses to SARS-CoV-2 play a crucial role in determining the clinical course after first infection. Immunological studies have focused on patients with moderate to severe disease, demonstrating excessive inflammation in tissues and organ damage. In order to understand the basis of the protective immune response in COVID-19, we performed a longitudinal follow-up, flow-cytometric and serological analysis of innate and adaptive immunity in 64 adults with a spectrum of clinical presentations: 28 healthy SARS-CoV-2-negative contacts of COVID-19 cases; 20 asymptomatic SARS-CoV-2-infected cases; eight patients with Mild COVID-19 disease and eight cases of Severe COVID-19 disease. Our data show that high frequency of NK cells and early and transient increase of specific IgA, IgM and, to a lower extent, IgG are associated with asymptomatic SARS-CoV-2 infection. By contrast, monocyte expansion and high and persistent levels of IgA and IgG, produced relatively late in the course of the infection, characterize severe disease. Modest increase of monocytes and different kinetics of antibodies are detected in mild COVID-19. The importance of innate NK cells and the short-lived antibody response of asymptomatic individuals and patients with mild disease suggest that only severe COVID-19 may result in protective memory established by the adaptive immune response.

Keywords: B cells; COVID-19; NK cell; SARS-CoV-2; antibodies; innate and adaptiveimmune response; monocytes.


Conflict of interest statement

The authors declare that the research was conducted in the absence of any commercial or financial relationships that could be construed as a potential conflict of interest.

Figures

Figure 1
Figure 1
(A) Flow-cytometry analysis of the monocyte to lymphocyte ratio (MLR) in the blood of three representative patients with asymptomatic, mild and severe disease. Total blood (EDTA) was stained with antibodies against CD45, CD3, CD4, CD8, CD7, CD56, CD16. The lympho-monocyte gate was designed based on physical characteristics (FSC-A vs SSC-A). Lymphocytes were gated as FSC-Alow and CD3+ or CD3 and monocytes as CD3 FSC-Ahigh. (B) Scatter plot depicts the MLR in the sixty-four adult patients enrolled in the study (contacts n = 28; asymptomatic n = 20; mild n = 8; severe n = 8). (C) Gating strategy used to identify natural killer (NK) and monocytes inside the CD3- cells in three representative patients with asymptomatic, mild and severe disease. NK cells were defined as CD3CD7+FSC-Alow and monocytes as CD3CD7FSC-Ahigh. (D) Heatmap shows percentages of NK and monocytes in contacts (indicated by the light green bar), asymptomatic (blue), mild (orange) and severe (red) patients. Percentages are represented by the different expression of red, blue and white as indicated in the color code. (E) Plots indicate the frequency of NK, monocytes and the monocytes/NK ratio (MNKR) in our patients. (B, E) Midlines indicate median. Statistical significances were determined using unpaired, two-tailed Mann–Whitney U-tests. *p ≤ 0.05, **p < 0.01, ***p < 0.001.
Figure 2
Figure 2
(A) Plots indicate the frequency of NK, monocytes and MNKR ratio in all analyzed samples collected at different time points. (B) Graphs depict the kinetics of the MNKR during the first 6 weeks of disease (midlines indicate mean) in all patients samples. Data referring to severe patients has a different scale due to the high value of MNKR. Heatmaps show the percentage of NK and monocytes in patients who had samples collected at different time points during the first 6 weeks. In the heatmap percentages are represented by the different expression of red, blue and white as indicated in the color code. (C) Scatter plot shows the percentage of NK cells in non-ICU (n = 43) and ICU (n = 34) patients. Graphs show the kinetics over time of NK cells percentage in patients with favorable and fatal outcome. (A, C) Midlines indicate median. Statistical significances were determined using unpaired, two-tailed Mann–Whitney U-tests. **p < 0.01, ***p < 0.001.
Figure 3
Figure 3
(A) Total blood was stained with antibodies against CD45, CD3, CD4, CD8, CD14, CD16, CD33, CD38 and HLADR. FACS plot show the gating strategy for the identification of monocytes (CD3FSC-Ahigh) in three representative patients with asymptomatic, mild and severe disease. True monocytes are double positive for HLADR and CD14. In the true monocytes gate, we identified the classical (CD14++CD16), intermediate (CD14+CD16+) and non-classical (CD14+CD16++) populations. (B) Scatter plots indicate the percentage of classical, intermediate and non-classical monocytes in each group of patients reported as single value. The Mean Fluorescence Intensity (MFI) of HLADR on total monocytes is shown by the last scatter plot. Midlines indicate median. Statistical significances were determined using unpaired, two-tailed Mann–Whitney U-tests. *p ≤ 0.05. (C) FACS plots show the different distribution of monocytes populations in two representative patients (one mild and one severe) during the course of the disease (2–6 weeks).
Figure 4
Figure 4
Total blood was stained with antibodies against CD45, CD3, CD4, CD8, CD14, CD16, CD33, CD38 and HLADR and in a second staining antibodies used were anti-CD3, CD4, CD8, CD45RA, CD27, CD28, CD31 and CCR7. (A) Graphs indicate the percentage of total CD3+, CD3+CD4+ and CD3+CD8+ T cells. (B) FACS plots depict the gating strategy to measure the frequency of CD4+ and CD8+ T cells expressing HLADR in three representative patients (asymptomatic, mild and severe). Percentage of CD4+HLADR+ or CD8+HLADR+ T cells is shown in the relative graphs (at the first sample collected after diagnosis). (C) Pseudocolor plots show CD31 expression in CD4+ and CD8+ naïve T cells (CD3+CCR7+CD45RA+). CD31+ are recent thymic emigrants and CD31 are naïve T cells. Graphs show the percentage of CD31+ and CD31 T cells in all patients (at the first sample collected after diagnosis). (D) FACS plots show CD4+ or CD8+ central memory (CD3+CCR7+CD45RA), effector memory (CD3+CCR7CD45RA) T cells and TEMRA (CD3+CCR7CD45RA+) T cells. Scatter plots depict the percentage of CD4+ and CD8+ TEMRA (at the first sample collected after diagnosis). Median is shown as midline. Statistical significances were determined using unpaired, two-tailed Mann–Whitney U-tests. *p ≤ 0.05, **p < 0.01, ***p < 0.001.
Figure 5
Figure 5
For the staining of the B cells we used the B-cell tube (BD biosciences) that includes: CD19, CD24, CD27, CD38, IgM, IgG, IgD, and CD21. (A) Viable lymphocytes were gated and then selected as CD19+ B cells in three representative patients with asymptomatic, mild and severe disease. The identification of the different B-cell populations is shown in the empty plots of the upper line. We identified transitional (CD24+CD38++), naïve (CD24+CD27), memory (CD24+CD27+), atypical MBCs (CD24CD38) and plasmablasts (CD24CD27++CD38++). In the CD27+ memory B-cell population based on IgM expression, we show IgM and switched (IgM) MBCs. MBCs were also gated as IgM+, IgG+ and IgG-IgM MBCs. (B) Plots indicate the percentage of B cells, MBCs and plasmablasts. In (C) the frequencies of IgM and switched MBCs are shown. In panel (D) we show the frequency of IgG+ and IgGIgMMBCs. Midlines indicate median. Statistical significances were determined using unpaired, two-tailed Mann–Whitney U-tests. *p ≤ 0.05, **p < 0.01, ***p < 0.001.
Figure 6
Figure 6
(A) Arbitrary units (AU) of IgG and IgA specific for the S1 domain of the SARS-CoV-2 Spike protein and concentration of RBD specific IgM were detected by ELISA at different time points. For some patients we had the opportunity to have serum samples at different time points of the disease. Data relative to all samples collected are shown (Contacts n = 51; Asymptomatic n = 63; Mild n = 31; Severe n = 15). Midlines indicate median. Statistical significances were determined using unpaired, two-tailed Mann–Whitney U-tests. *p ≤ 0.05, **p < 0.01, ***p < 0.001. (B, C) Graphs show the levels of IgA, IgG and IgM during the course of the disease in asymptomatic (B) and mild (C) patients. Time is indicated in weeks starting from the first positive nasopharyngeal swab. Dashed line indicates detection threshold (1.1).

References

    1. Zhou F, Yu T, Du R, Fan G, Liu Y, Liu Z, et al. Clinical course and risk factors for mortality of adult inpatients with COVID-19 in Wuhan, China: a retrospective cohort study. Lancet (2020) 395(10229):1054–62. 10.1016/S0140-6736(20)30566-3 - DOI - PMC - PubMed
    1. Maggi E, Canonica GW, Moretta L. COVID-19: unanswered questions on immune response and pathogenesis. J Allergy Clin Immunol (2020) 146(1):18–22. 10.1016/j.jaci.2020.05.001 - DOI - PMC - PubMed
    1. Qin C, Zhou L, Hu Z, Zhang S, Yang S, Tao Y, et al. Dysregulation of immune response in patients with COVID-19 in Wuhan, China. Clin Infect Dis (2020) 71(15):762–8. 10.1093/cid/ciaa248 - DOI - PMC - PubMed
    1. Mehta P, McAuley DF, Brown M, Sanchez E, Tattersall RS, Manson JJ. COVID-19: consider cytokine storm syndromes and immunosuppression. Lancet (2020) 395(10229):1033–4. 10.1016/S0140-6736(20)30628-0 - DOI - PMC - PubMed
    1. Perlman S, Netland J. Coronaviruses post-SARS: Update on replication and pathogenesis. Nat Rev Microbiol (2009) 7(6):439–50. 10.1038/nrmicro2147 - DOI - PMC - PubMed

Publication types