

Melanocortin 1 receptor attenuates early brain injury following subarachnoid hemorrhage by controlling mitochondrial metabolism via AMPK/SIRT1/PGC-1α pathway in rats
- PMID: 33391490
- PMCID: PMC7738864
- DOI: 10.7150/thno.49426
Melanocortin 1 receptor attenuates early brain injury following subarachnoid hemorrhage by controlling mitochondrial metabolism via AMPK/SIRT1/PGC-1α pathway in rats
Abstract
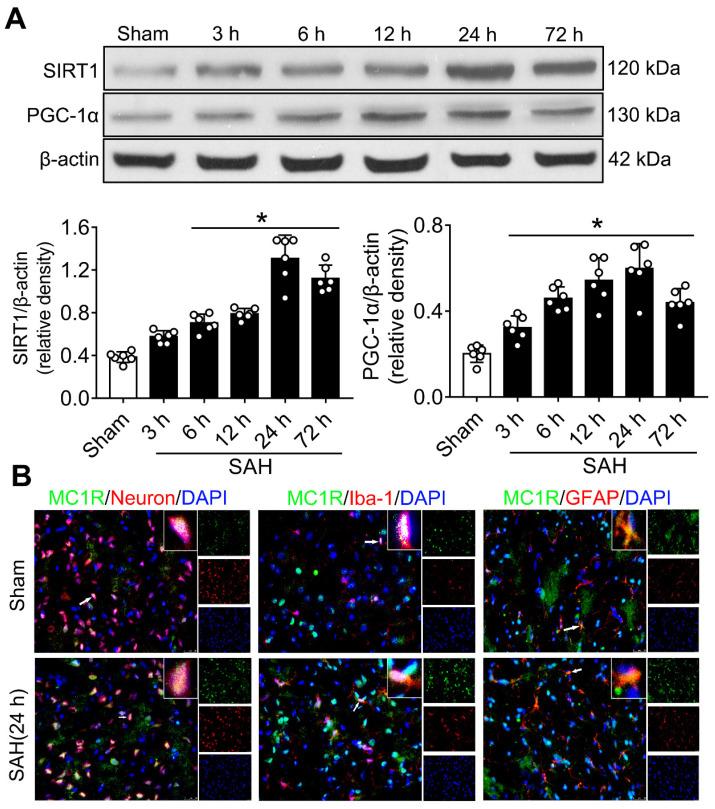
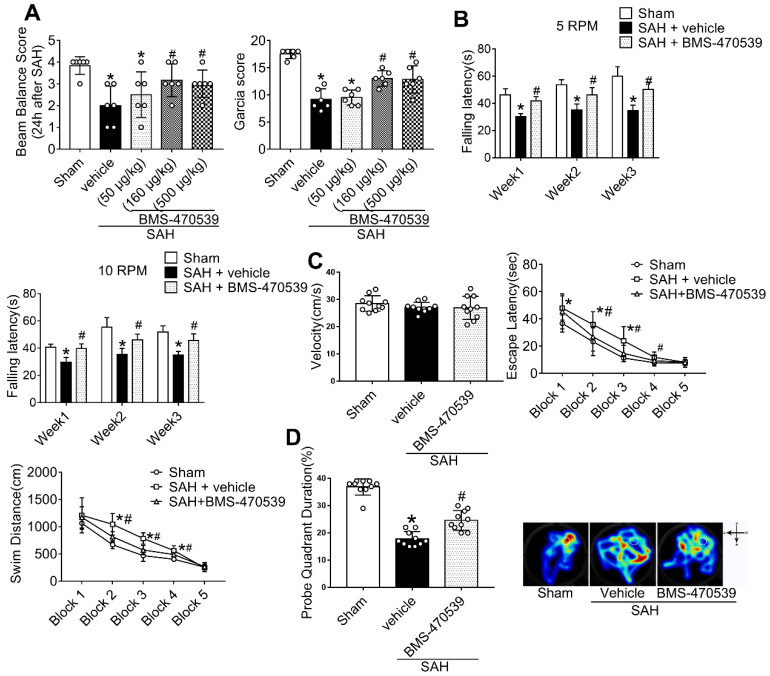
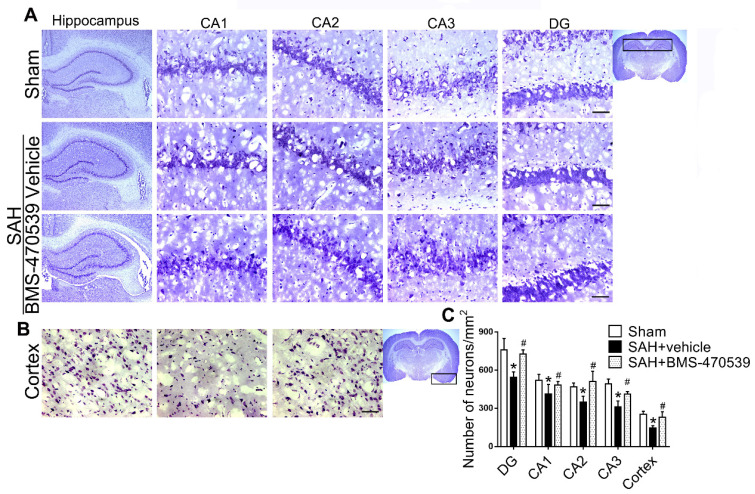
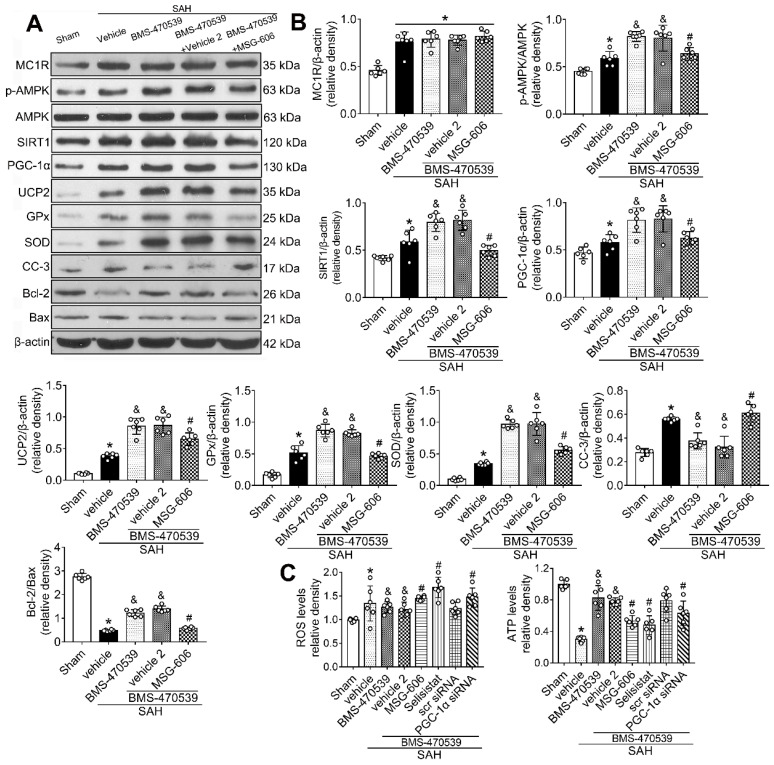
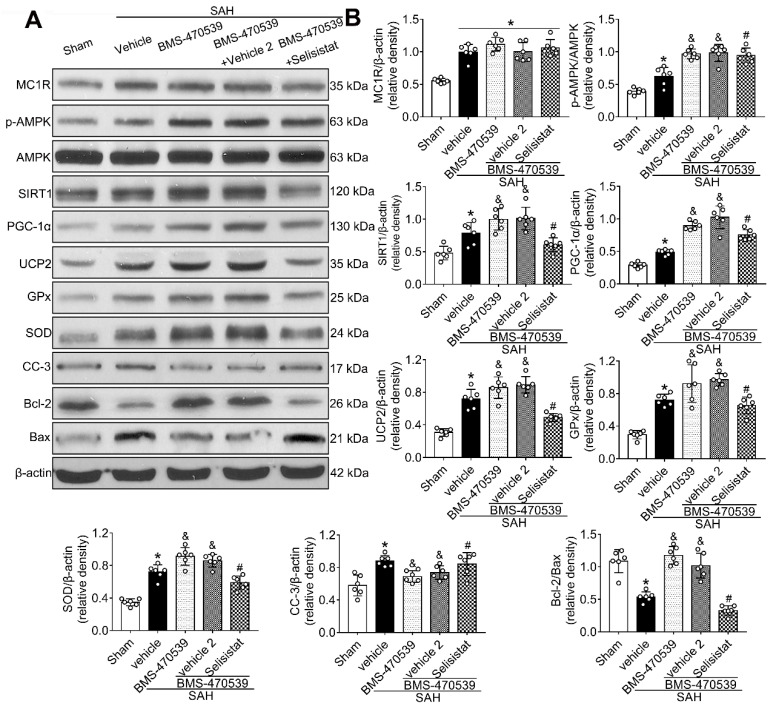
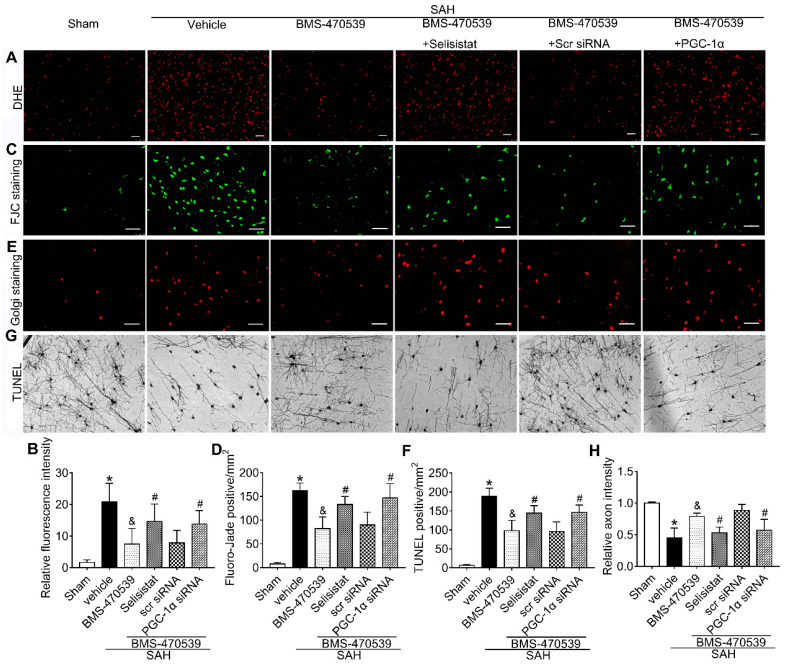
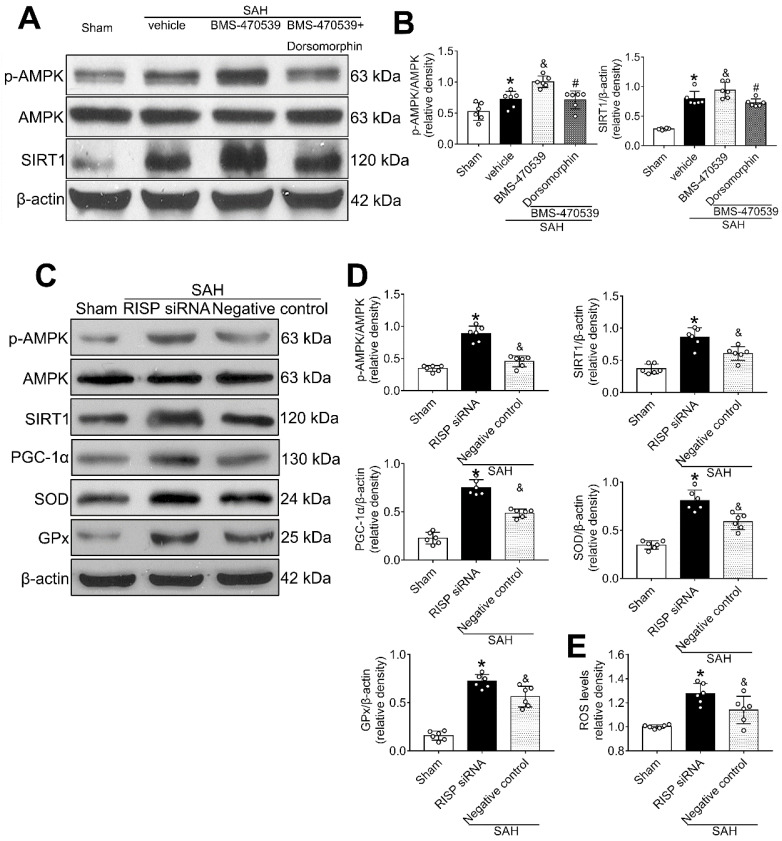
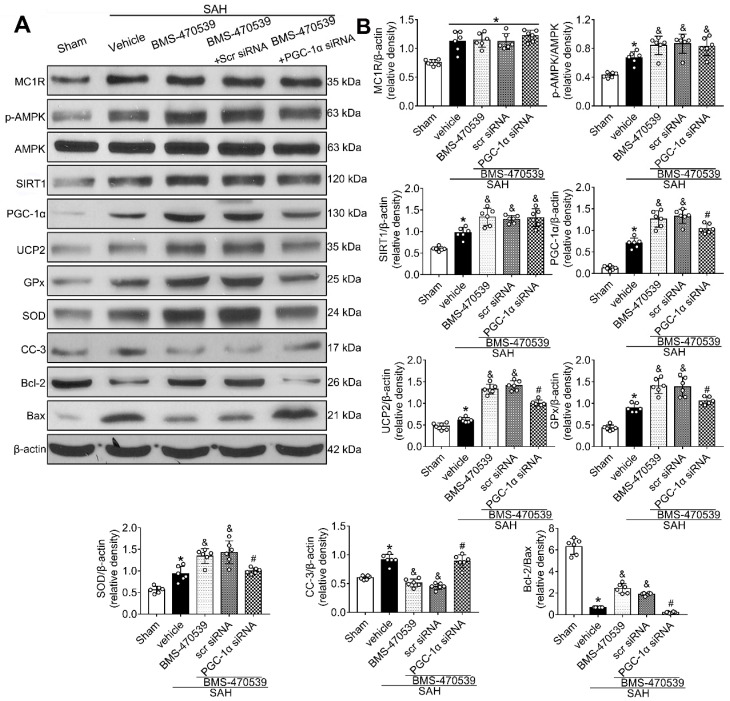
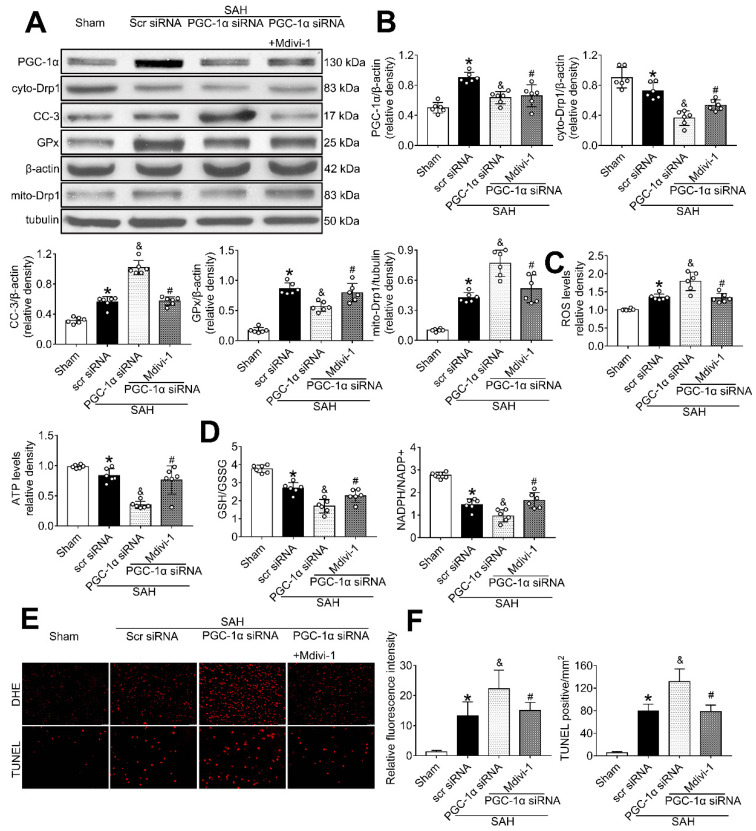
Mitochondria-mediated oxidative stress and apoptosis contribute greatly to early brain injury (EBI) following subarachnoid hemorrhage (SAH). This study hypothesized that activation of melanocortin 1 receptor (MC1R), using BMS-470539, attenuates EBI by controlling mitochondrial metabolism after SAH. Methods: We utilized BMS-470539, MSG-606, selisistat, and PGC-1α to verify the neuroprotective effects of MC1R. We evaluated short- and long-term neurobehavior after SAH. Western blotting, immunofluorescence, and Golgi staining techniques were performed to assess changes in protein levels. Results: The results of western blotting suggested that the expression of SIRT1 and PGC-1α were increased, reaching their peaks at 24 h following SAH. Moreover, BMS-470539 treatment notably attenuated neurological deficits, and also reduced long-term spatial learning and memory impairments caused by SAH. The underlying neuroprotective mechanisms of the BMS-470539/MC1R system were mediated through the suppression of oxidative stress, apoptosis, and mitochondrial fission by increasing the levels of SIRT1, PGC-1α, UCP2, SOD, GPx, Bcl-2, cyto-Drp1, and ATP, while decreasing the levels of cleaved caspase-3, Bax, mito-Drp1, ROS, GSH/GSSG, and NADPH/NADP+ ratios. The neuroprotective effects of the BMS-470539/MC1R system were significantly abolished by MSG-606, selisistat, and PGC-1α siRNA. Conclusions: The activation of MC1R with BMS-470539 significantly attenuated EBI after SAH by suppressing the oxidative stress, apoptosis, and mitochondrial fission through the AMPK/SIRT1/PGC-1α signaling pathway.
Keywords: melanocortin 1 receptor; mitochondrial fission; oxidative stress; peroxisome proliferator-activated receptor gamma coactivator 1-alpha; subarachnoid hemorrhage.
© The author(s).
Conflict of interest statement
Competing Interests: The authors have declared that no competing interest exists.
Figures

Similar articles
-
Activation of Melanocortin 1 Receptor Attenuates Early Brain Injury in a Rat Model of Subarachnoid Hemorrhage viathe Suppression of Neuroinflammation through AMPK/TBK1/NF-κB Pathway in Rats.Neurotherapeutics. 2020 Jan;17(1):294-308. doi: 10.1007/s13311-019-00772-x. Neurotherapeutics. 2020. PMID: 31486022 Free PMC article.
-
Heat shock protein 22 modulates NRF1/TFAM-dependent mitochondrial biogenesis and DRP1-sparked mitochondrial apoptosis through AMPK-PGC1α signaling pathway to alleviate the early brain injury of subarachnoid hemorrhage in rats.Redox Biol. 2021 Apr;40:101856. doi: 10.1016/j.redox.2021.101856. Epub 2021 Jan 6. Redox Biol. 2021. PMID: 33472123 Free PMC article.
-
Mesenchymal stem cell-conditioned media ameliorate diabetic endothelial dysfunction by improving mitochondrial bioenergetics via the Sirt1/AMPK/PGC-1α pathway.Clin Sci (Lond). 2016 Dec 1;130(23):2181-2198. doi: 10.1042/CS20160235. Epub 2016 Sep 9. Clin Sci (Lond). 2016. PMID: 27613156
-
Role of mitochondria in diabetic peripheral neuropathy: Influencing the NAD+-dependent SIRT1-PGC-1α-TFAM pathway.Int Rev Neurobiol. 2019;145:177-209. doi: 10.1016/bs.irn.2019.04.002. Epub 2019 Jun 8. Int Rev Neurobiol. 2019. PMID: 31208524 Free PMC article. Review.
-
The Role of PGC-1α in Digestive System Malignant Tumours.Anticancer Agents Med Chem. 2020;20(3):276-285. doi: 10.2174/1871520619666191105125409. Anticancer Agents Med Chem. 2020. PMID: 31702508 Review.
Cited by
-
Progesterone (P4) ameliorates cigarette smoke-induced chronic obstructive pulmonary disease (COPD).Mol Med. 2024 Aug 13;30(1):123. doi: 10.1186/s10020-024-00883-y. Mol Med. 2024. PMID: 39138434 Free PMC article.
-
New Mechanisms and Targets of Subarachnoid Hemorrhage: A Focus on Mitochondria.Curr Neuropharmacol. 2022;20(7):1278-1296. doi: 10.2174/1570159X19666211101103646. Curr Neuropharmacol. 2022. PMID: 34720082 Free PMC article. Review.
-
Activation of SIRT1 Alleviates Ferroptosis in the Early Brain Injury after Subarachnoid Hemorrhage.Oxid Med Cell Longev. 2022 Jul 9;2022:9069825. doi: 10.1155/2022/9069825. eCollection 2022. Oxid Med Cell Longev. 2022. PMID: 35855863 Free PMC article.
-
Clinical Potential of Immunotherapies in Subarachnoid Hemorrhage Treatment: Mechanistic Dissection of Innate and Adaptive Immune Responses.Aging Dis. 2023 Oct 1;14(5):1533-1554. doi: 10.14336/AD.2023.0126. Aging Dis. 2023. PMID: 37196120 Free PMC article. Review.
-
Inhibition of GPR17/ID2 Axis Improve Remyelination and Cognitive Recovery after SAH by Mediating OPC Differentiation in Rat Model.Transl Stroke Res. 2025 Apr;16(2):178-193. doi: 10.1007/s12975-023-01201-0. Epub 2023 Nov 7. Transl Stroke Res. 2025. PMID: 37935878
References
-
- Koch RE, Josefson CC, Hill GE. Mitochondrial function, ornamentation, and immunocompetence. Biol Rev Camb Philos Soc. 2017;92:1459–74. - PubMed
Publication types
MeSH terms
Substances
Grants and funding
LinkOut - more resources
Full Text Sources
Other Literature Sources
Research Materials
Miscellaneous
