. 2021 Jan 1;11(3):1232-1248.
doi: 10.7150/thno.48761. eCollection 2021.

M2 microglial small extracellular vesicles reduce glial scar formation via the miR-124/STAT3 pathway after ischemic stroke in mice

Affiliations

M2 microglial small extracellular vesicles reduce glial scar formation via the miR-124/STAT3 pathway after ischemic stroke in mice

Zongwei Li et al. Theranostics. .

Abstract

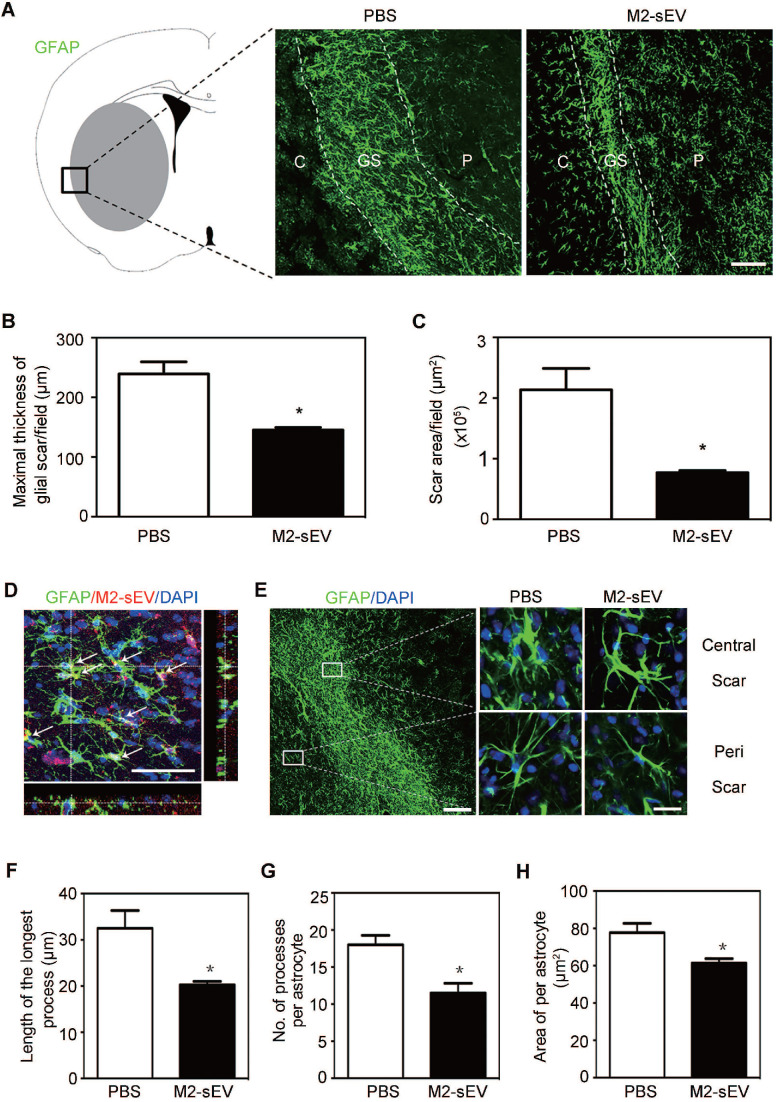
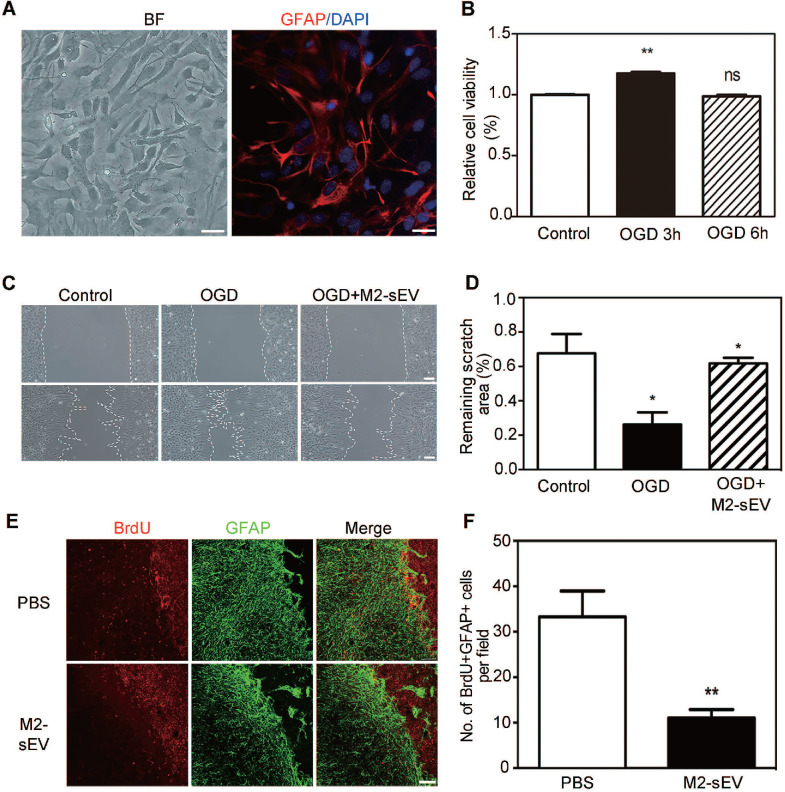
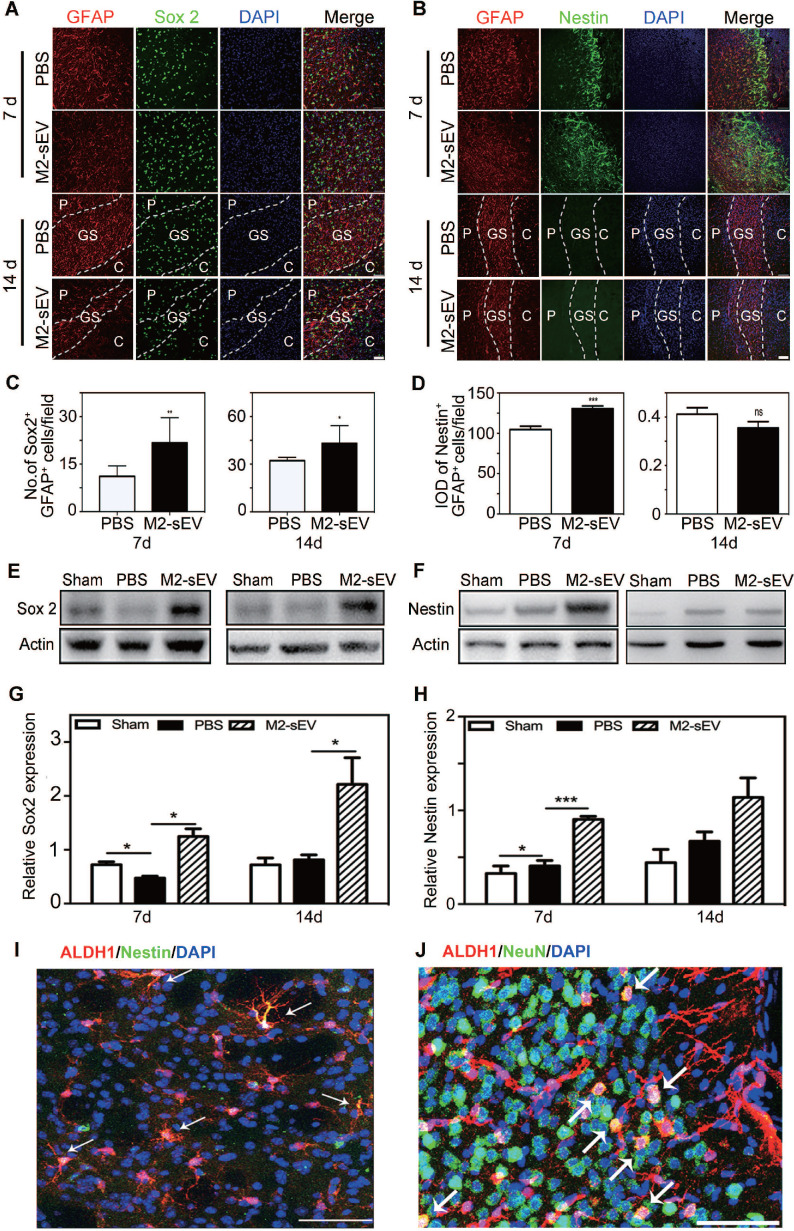
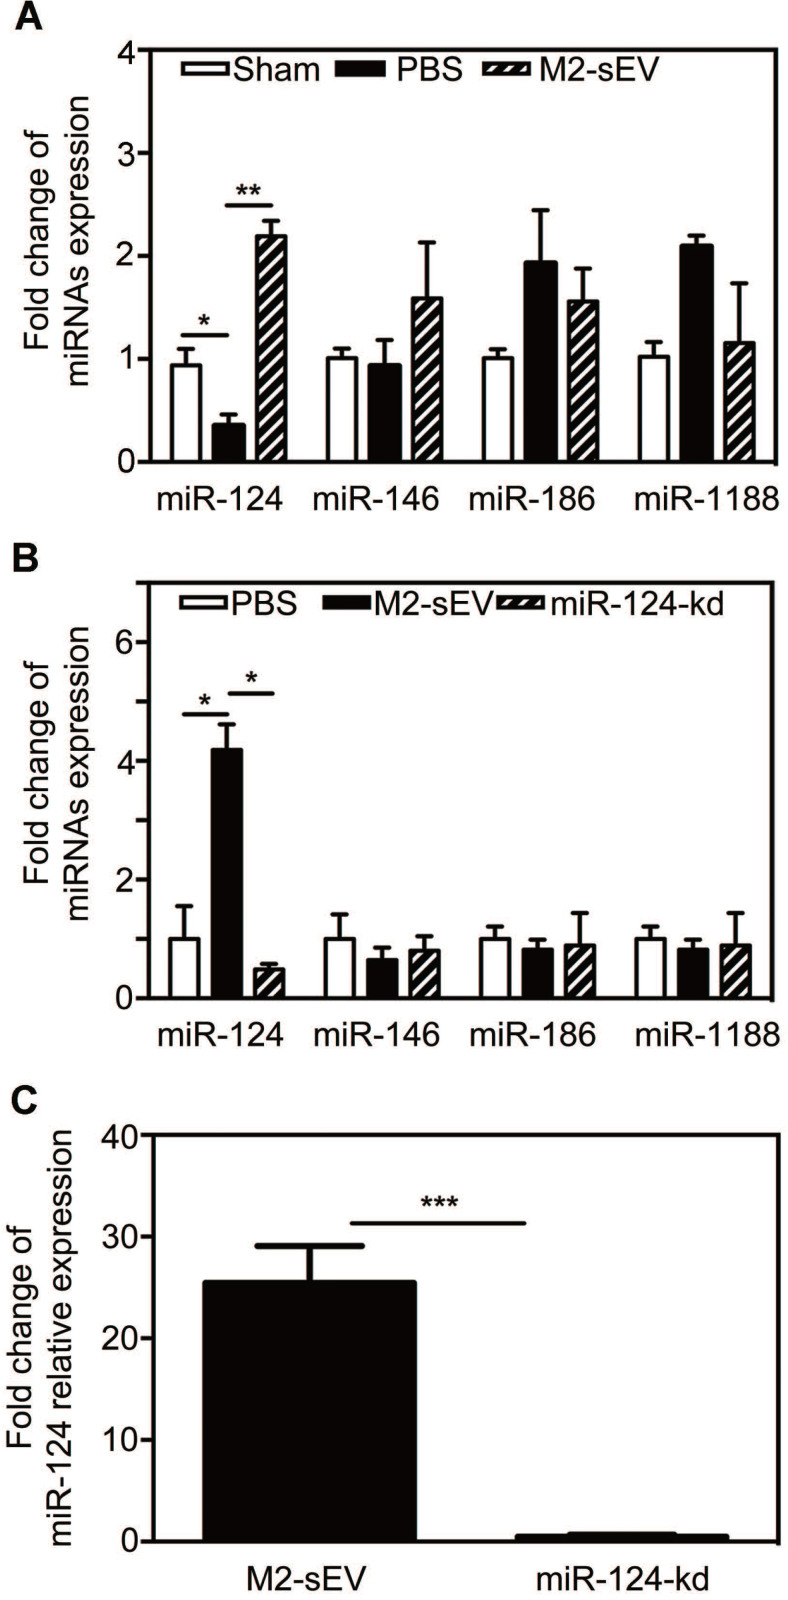
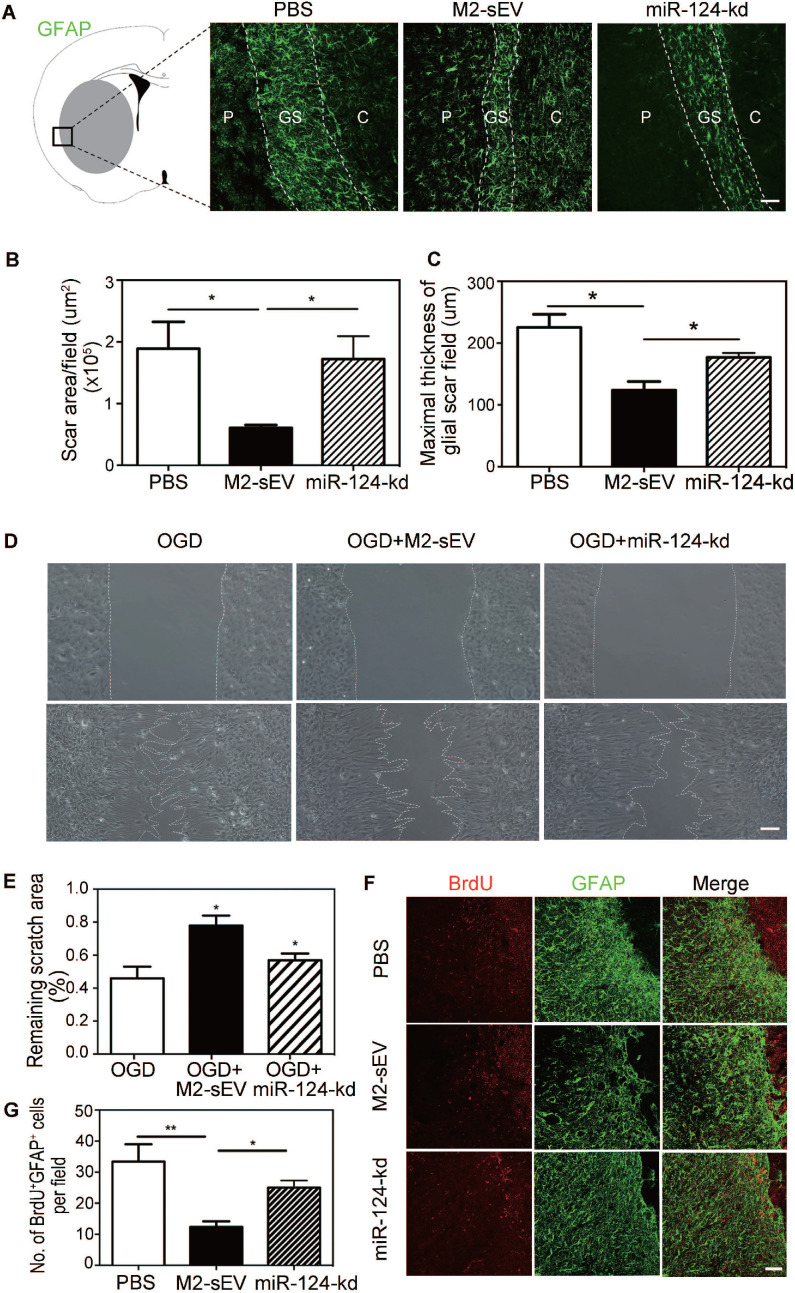
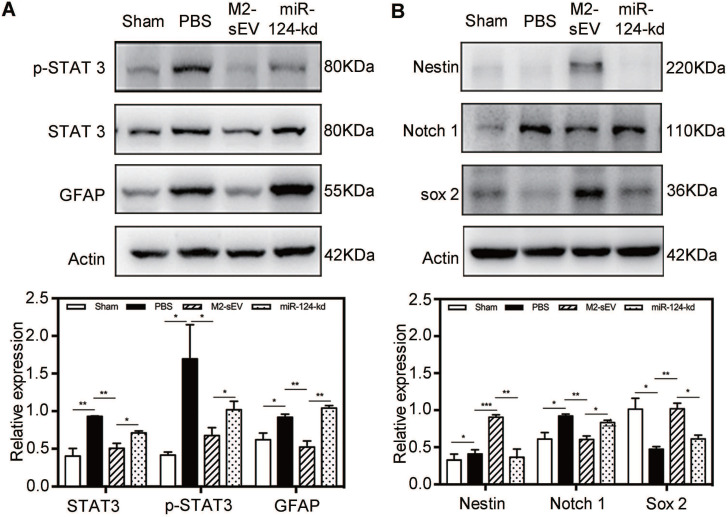
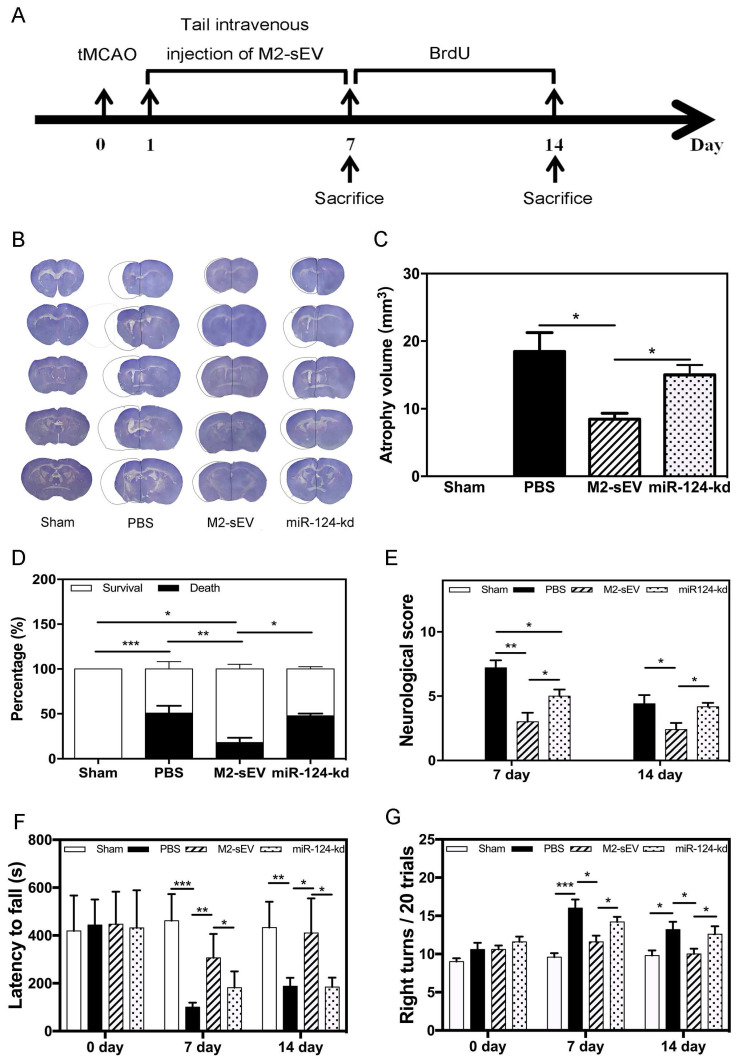
Rationale: Glial scars present a major obstacle for neuronal regeneration after stroke. Thus, approaches to promote their degradation and inhibit their formation are beneficial for stroke recovery. The interaction of microglia and astrocytes is known to be involved in glial scar formation after stroke; however, how microglia affect glial scar formation remains unclear. Methods: Mice were treated daily with M2 microglial small extracellular vesicles through tail intravenous injections from day 1 to day 7 after middle cerebral artery occlusion. Glial scar, infarct volume, neurological score were detected after ischemia. microRNA and related protein were examined in peri-infarct areas of the brain following ischemia. Results: M2 microglial small extracellular vesicles reduced glial scar formation and promoted recovery after stroke and were enriched in miR-124. Furthermore, M2 microglial small extracellular vesicle treatment decreased the expression of the astrocyte proliferation gene signal transducer and activator of transcription 3, one of the targets of miR-124, and glial fibrillary acidic protein and inhibited astrocyte proliferation both in vitro and in vivo. It also decreased Notch 1 expression and increased Sox2 expression in astrocytes, which suggested that astrocytes had transformed into neuronal progenitor cells. Finally, miR-124 knockdown in M2 microglial small extracellular vesicles blocked their effects on glial scars and stroke recovery. Conclusions: Our results showed, for the first time, that microglia regulate glial scar formation via small extracellular vesicles, indicating that M2 microglial small extracellular vesicles could represent a new therapeutic approach for stroke.

Keywords: astrocyte; glial scar; ischemic stroke; microglia; small extracellular vesicles.


Conflict of interest statement

Competing Interests: The authors declare no conflict of interest concerning the materials or methods used in this study or the findings specified in this paper.

Figures

Figure 1
Figure 1
Characterization of M2 BV2 cells induced by IL-4 and identification of sEVs derived from M2 BV2 cells. (A, B) Representative images of BV2 cells immunostained for Iba-1 (green), CD206 (red), and arginase (red). Cultured systems were treated with 0 or 20 ng/µL IL-4. Cell nuclei were counterstained with DAPI. Scale bar = 50 µm. (C) Western blotting analysis of CD206 and arginase expression in BV2 cells after 0 or 20 ng/µL IL-4 treatment. (D) Representative electron microscopy images showing the phenotype of M2-sEVs. Left image scale bar = 100 nm, right image scale bar = 50 nm. (F) NTA of M2-sEVs isolated by ultracentrifugation from M2 BV2 cells. Data represent the average size distribution profile of three samples and each purification normalized to the total nanoparticle concentrations. Data for each sample was derived from three different videos and analyses. (G) Western blotting analysis of TSG101 and CD63 levels in M2 BV2 cells and M2-sEVs.
Figure 2
Figure 2
M2-sEVs inhibited glial scar formation and attenuated astrocyte activation in the mouse brain after tMCAO. (A) Representative images of GFAP (green) immunostaining in the PBS and M2-sEV groups 14 days after tMCAO. C: infarct center, GS: glial scar, P: peri-infarct area. Scale bar = 100 µm. (B, C) Statistical analysis of the glial scar areas and maximal scar thickness per field in the PBS and M2-sEV groups at 14 days after tMCAO (n = 10). (D) Representative images of GFAP (green) and PKH26 (red) immunostaining in the tMCAO mouse brain. The yellow color indicates sEVs in astrocytes. The cell nuclei were counterstained with DAPI. Scale bar = 50 µm. (E) Left panel: Locations of central and peri-scarring observed using GFAP (green) immunostaining in mouse brains 14 days after tMCAO. Scale bar = 100 µm. Right panel: Representative images of magnified photographs of astrocyte morphology in the central and peri-scar areas of the PBS and M2-sEV groups. Scale bar = 10 µm. (F-I) Statistical analysis of the length of the longest process, the number of processes, and swallow area per astrocyte in the control and M2-sEV mouse brains 14 days after tMCAO (n = 10). The data are presented as mean ± SEM. *p < 0.05.
Figure 3
Figure 3
M2-sEVs inhibited the proliferation and migration of astrocytes after tMCAO. (A) Representative image of primary astrocytes in bright field and Immunostaining of GFAP (red) with DAPI counterstaining for cell nuclei. Left image scale bar = 50 µm, right image scale bar = 10 µm. (B) CCK-8 assay of cultured astrocytes after 0, 3, and 6 h of OGD treatment. The absorbance at 450 nm was normalized to and expressed as a percentage of the control values. (C) Scratch assay of cultured astrocytes after 0 or 3 h of OGD treatment and reoxygenation for 24 h. 10 µg/mL M2-sEVs were pretreated for 24 h before OGD treatment. Scale bar = 50 µm. (D) Statistical analysis of the remaining scratch area rates in the control, OGD, and OGD+M2-sEV groups at 24 h. OGD treatment promoted astrocyte migration to the scratch, while M2-sEVs inhibited the astrocyte migration. (E) Representative images of GFAP (green) and BrdU (red) immunostaining in the PBS and M2-sEV groups 14 days after tMCAO. Scale bar = 50 µm. (F) Statistical analysis of the number of GFAP+/BrdU+ cells in the PBS and M2-sEV groups 14 days after tMCAO (n = 12). Data are presented as mean ± SEM. *p < 0.05, **p < 0.01.
Figure 4
Figure 4
M2-sEVs promoted the transition of astrocytes to neural progenitors in the mouse brain after tMCAO. (A) Representative images of GFAP (red) and Sox 2 (green) immunostaining in the PBS and M2-sEV groups at 7 days and 14 days after tMCAO. Scale bar = 50 µm. (B) Representative images of GFAP (red) and nestin (green) immunostaining in the control and M2-sEV groups. Scale bar = 50 µm. (C) Statistical analysis of the number of GFAP+/Sox 2+ cells in the PBS and M2-sEV groups after tMCAO (n = 12). (D) Statistical analysis of the integrated optical density of GFAP+/nestin+ cells in the control and M2-sEV groups after tMCAO (n = 12). (E, F) Western blotting analysis of Sox 2 and nestin expression in the sham, PBS, and M2-sEV groups at 7 days and 14 days after tMCAO (n = 12). (G, H) Quantification of Sox 2 and nestin expression. (I) Representative images of Aldh1l1 (red) and nestin (green) in M2-sEV group at 7 days after tMCAO. Scale bar = 50 µm. (J) Representative images of Aldh1l1 (red) and NeuN (green) in M2-sEV groups at 14 days after tMCAO. Scale bar = 50 µm. Data are presented as mean ± SEM. **p < 0.01, ***p < 0.005.
Figure 5
Figure 5
M2-sEV improved miR-124 expression in the mouse brain after tMCAO. (A) miR-124, miR-146, miR-186, and miR-1188 expression in the sham-, PBS -, and M2-sEV groups 7 days after tMCAO (n = 9). Data are presented as mean ± SEM. *p < 0.05, **p < 0.01. (B) miR-124, miR-146, miR-186, and miR-1188 expression in the PBS -, M2-sEV, - and miR-124-kd groups at 7 days after tMCAO (n = 9). (C) miR-124 expression in M2-sEV and miR-124-kd groups at 7 days after tMCAO. Data are presented as mean ± SEM. *p < 0.05, **p < 0.01, ***p < 0.005.
Figure 6
Figure 6
Downregulation of miR-124 blocked the inhibitory effect of M2-sEVs on glial scar formation after tMCAO. Representative images of GFAP (green) immunostaining in the PBS -, M2-sEV -, and miR-124-kd groups 14 days after tMCAO. C: infarct center, GS: glial scar, P: peri-infarct area. Scale bar = 100 µm. (B, C) Semi-quantification of the glial scar areas and maximal scar thickness per field in the PBS, M2-sEV, and miR-124-kd groups (n = 15). (D) Scratch assay results of cultured astrocytes after 3 h of OGD treatment and reoxygenation for 24 h. 10 µg/mL M2-sEVs as well as miR-124-kd M2-sEVs were pretreated for 24 h before OGD treatment. Scale bar = 50 µm. (E) The remaining scratch areas in the OGD, OGD+M2-sEV, and OGD+miR-124-kd groups at 24 h. (F) Representative images of GFAP (green) and BrdU (red) immunostaining in the PBS and M2-sEV groups 14 days after tMCAO. Scale bar = 50 µm. (G) The number of GFAP+/BrdU+ cells in the PBS, M2-sEV, and miR-124-kd groups 14 days after tMCAO (n = 15). Data are presented as mean ± SEM. **p < 0.01, *p < 0.05.
Figure 7
Figure 7
M2-sEV blocked the STAT3 signal pathway through miR-124 in the mouse brain after tMCAO. (A) Western blotting analysis and quantification of p-STAT3, STAT3, and GFAP expression in the sham, PBS -, M2-sEV -, and miR-124-kd groups after tMCAO (n = 15). (B) Western blotting analysis and quantification of the expression of nestin, Notch 1, and Sox 2 in the sham, PBS, M2-sEV, and miR-124-kd groups 7 days after tMCAO (n = 15). Data are presented as mean ± SEM. *p < 0.05, **p < 0.01.
Figure 8
Figure 8
M2-sEVs reduced atrophy volume and improved neurobehavioral outcomes through miR-124 after ischemia in mice. (A) Diagram of experimental design. Animal sacrifice time points were 7 days or 14 days after tMCAO. (B) Cresyl violet staining for atrophy volume of brain sections in the three groups 14 days after tMCAO. The dashed line shows the original size of the ischemia side. (C) Atrophy volume in the sham, PBS, M2-sEV, and miR-124-kd groups 14 days after tMCAO (n = 36). (D) Survival percentage in the sham, PBS, M2-sEV, and miR-124-kd groups after tMCAO. (E) Neurological scores in the sham, PBS, M2-sEV, and miR-124-kd groups after tMCAO. (F) Rotarod test results in the sham, PBS, M2-sEV, and miR-124-kd groups after tMCAO. (G) Right turns test results in the sham, PBS, M2-sEV, and miR-124-kd groups after tMCAO. Data are presented as mean ± SEM. *p < 0.05, **p < 0.05, ***p < 0.005.

References

    1. Faulkner JR, Herrmann JE, Woo MJ, Tansey KE, Doan NB, Sofroniew MV. Reactive astrocytes protect tissue and preserve function after spinal cord injury. J Neurosci. 2004;24:2143–55. - PMC - PubMed
    1. Cai H, Ma Y, Jiang L, Mu Z, Jiang Z, Chen X. et al. Hypoxia Response Element-Regulated MMP-9 Promotes Neurological Recovery via Glial Scar Degradation and Angiogenesis in Delayed Stroke. Mol Ther. 2017;25:1448–59. - PMC - PubMed
    1. Koyama Y. Signaling molecules regulating phenotypic conversions of astrocytes and glial scar formation in damaged nerve tissues. Neurochem Int. 2014;78:35–42. - PubMed
    1. Radulovic M, Yoon H, Wu J, Mustafa K, Fehlings MG, Scarisbrick IA. Genetic targeting of protease activated receptor 2 reduces inflammatory astrogliosis and improves recovery of function after spinal cord injury. Neurobiol Dis. 2015;83:75–89. - PMC - PubMed
    1. Wanner IB, Anderson MA, Song B, Levine J, Fernandez A, Gray-Thompson Z. et al. Glial scar borders are formed by newly proliferated, elongated astrocytes that interact to corral inflammatory and fibrotic cells via STAT3-dependent mechanisms after spinal cord injury. J Neurosci. 2013;33:12870–86. - PMC - PubMed

Publication types

MeSH terms