. 2020 Nov 16;125(21):e2020JD033421.
doi: 10.1029/2020JD033421. Epub 2020 Oct 29.

Sensitivity of Atmospheric River Vapor Transport and Precipitation to Uniform Sea Surface Temperature Increases

Affiliations

Sensitivity of Atmospheric River Vapor Transport and Precipitation to Uniform Sea Surface Temperature Increases

Elizabeth E McClenny et al. J Geophys Res Atmos. .

Abstract

Filaments of intense vapor transport called atmospheric rivers (ARs) are responsible for the majority of poleward vapor transport in the midlatitudes. Despite their importance to the hydrologic cycle, there remain many unanswered questions about changes to ARs in a warming climate. In this study we perform a series of escalating uniform SST increases (+2, +4, and +6K, respectively) in the Community Atmosphere Model version 5 in an aquaplanet configuration to evaluate the thermodynamic and dynamical response of AR vapor content, transport, and precipitation to warming SSTs. We find that AR column integrated water vapor (IWV) is especially sensitive to SST and increases by 6.3-9.7% per degree warming despite decreasing relative humidity through much of the column. Further analysis provides a more nuanced view of AR IWV changes: Since SST warming is modest compared to that in the midtroposphere, computing fractional changes in IWV with respect to SST results in finding spuriously large increases. Meanwhile, results here show that AR IWV transport increases relatively uniformly with temperature and at consistently lower rates than IWV, as modulated by systematically decreasing low-level wind speeds. Similarly, changes in AR precipitation are related to a compensatory relationship between enhanced near-surface moisture and damped vertical motions.

Keywords: CC scaling; aquaplanet; atmospheric rivers; attribution; sensitivity.


Figures

Figure 1
Figure 1
Snapshot of ARs (solid black outlines) as well as a TC (dotted black outlines) as identified by TE. We show them here on a field of (a) IVT and (b) the Laplacian of IVT from the Baseline SST run.
Figure 2
Figure 2
Zonal mean AR (a) occurrence frequency and (b) zonal extent for each SST run. Shading shows the 95% confidence intervals, computed with respect to N=20 three‐month ensembles.
Figure 3
Figure 3
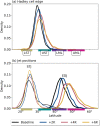
Kernel density estimates (KDEs) of (a) Hadley cell edge for each run and (b) subtropical jet (STJ; thin lines) and eddy‐driven jet (EDJ; thick lines) positions. Colored boxes and accompanying labels on the x‐axis denote the analysis subregions described in section 2.4, and are shown here for reference.
Figure 4
Figure 4
(a) Meridional distributions of zonal mean AR (solid) and non‐AR (dotted) IVT. Shading shows 95% confidence intervals. (b) Relative differences with respect to the baseline SST (% K−1), using the same line color and style conventions. (c–f) Area‐weighted mean relative change per K SST increase (blue; line style conventions as before). Gray dashed lines show changes in near‐surface e as predicted by the CC relation computed with respect to the prescribed uniform SST increases, which we show here for reference.
Figure 5
Figure 5
As in Figure 4, but for (a–f) zonal IVT (uIVT) and (g–l) meridional IVT (vIVT) components. Note the differences in ordinate scales. Also note numerical issues which prevented us from plotting some non‐AR quantities: (1) Non‐AR uIVT is consistently near‐zero between the LST and UST, resulting in an artificial inflation of relative changes in subplot (b), though the subregion means (c–f) were possible; (2) non‐AR vIVT has a similar problem, though the values pass through the y‐intercept in the LST; hence, we could plot neither the zonal (h) nor the regional (i–l) fractional changes.
Figure 6
Figure 6
As in Figure 4, but for IWV.
Figure 7
Figure 7
Vertical distributions of zonal mean absolute temperature in (a) AR and (b) non‐AR grid points. (c–e) Vertical distributions of the absolute change in absolute temperature in AR grid points. (f–h) Vertical distributions of the absolute change in absolute temperature in non‐AR grid points. Boxes delineating subregions are as for the previous figures, and are shown for reference.
Figure 8
Figure 8
Same as Figure 7, but for relative humidity (RH; %).
Figure 9
Figure 9
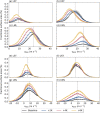
Histograms of AR (a–d) zonal wind at 850 hPa (u850) and (e–h) meridional wind at 850 hPa (v850) in each analysis subregion, with spacing at 1 m/s; y‐axis shows the fractional area of the subregion occupied by a particular bin value. Steps show the median of the 3‐month ensemble members, while error bars show the inter‐quartile range with respect to N=20 ensemble members. The gray, dashed lines show the mode of the baseline histogram for reference.
Figure 10
Figure 10
The same as Figure 4, but for 3‐hourly average precipitation rate.
Figure 11
Figure 11
The same as Figure 9, but for 3‐hourly average (a–d) precipitation rates and (e–h) pressure velocities at 700 hPa (ω700). For (a–d), bin spacing is 1 mm/day with every third bin shown for clarity; we only consider points precipitating with a rate of at least 1 mm/day. For (e–h), bin spacing is 0.01 Pa/s, with every other shown.
Figure 12
Figure 12
(a) Area‐mean precipitation rates for all SSTs (mm/day). Circles indicate unweighted means, while diamonds indicate that the means were weighted by IVT values, as described by Equation 5. Markers show the median value with respect to the 20‐member ensemble, while error bars show the interquartile range. Panels (b)–(e) show the fractional change in area precipitation means with respect to the Baseline for each uniform SST increase (% K−1). We use dotted lines for nonweighted and solid lines for IVT‐weighted, with line markers consistent with those used in panel (a). Gray, dashed lines show the same fractional changes in AR precipitation as in Figures 10c–10f for reference.

References

    1. AMS (2019). Atmospheric river. Retrieved from https://glossary.ametsoc.org/w/index.php?title=Atmospheric_river&oldid=1988
    1. Butler, A. H. , Thompson, D. W. J. , & Heikes, R. (2010). The steady‐state atmospheric circulation response to climate change like thermal forcings in a simple general circulation model. Journal of Climate, 23(13), 3474–3496. 10.1175/2010JCLI3228.1 - DOI
    1. Chang, E. K. M. , Guo, Y. , & Xia, X. (2012). CMIP5 multimodel ensemble projection of storm track change under global warming. Journal of Geophysical Research, 117, D23118 10.1029/2012JD018578 - DOI
    1. Cordeira, J. M. , Ralph, F. M. , & Moore, B. J. (2013). The development and evolution of two atmospheric rivers in proximity to Western North Pacific tropical cyclones in October 2010. Monthly Weather Review, 141(12), 4234–4255. 10.1175/MWR-D-13-00019.1 - DOI
    1. Davis, N. , & Birner, T. (2013). Seasonal to multidecadal variability of the width of the tropical belt. Journal of Geophysical Research: Atmospheres, 118, 7773–7787. 10.1002/jgrd.50610 - DOI